
Agrochemicals Market Size Analysis Report 2035
The global agrochemicals market size was estimated at USD 285.36 billion in 2025 and is expected to increase from USD 300.91 billion in 2026 to USD 485.13 billion by 2035, growing at a CAGR of 5.45% from 2026 to 2035. The growing food demand, changing dietary preferences, and growing production of crops drive the market growth.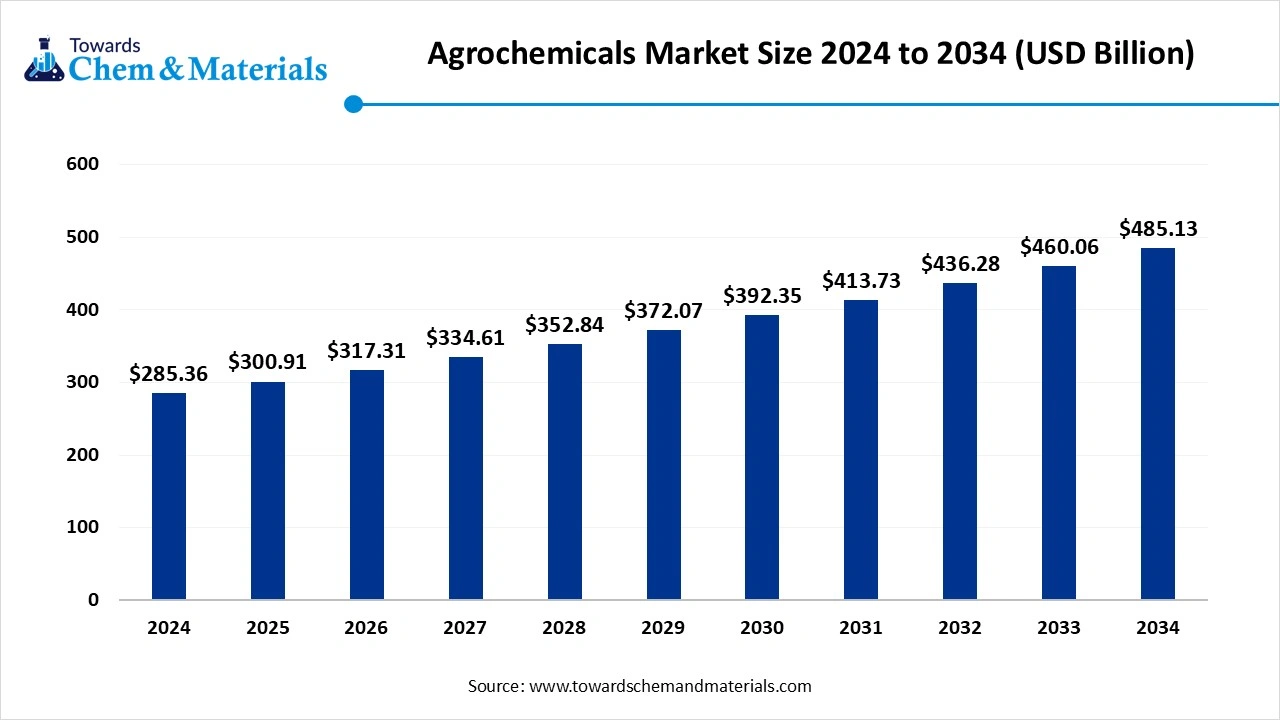
Market Highlights
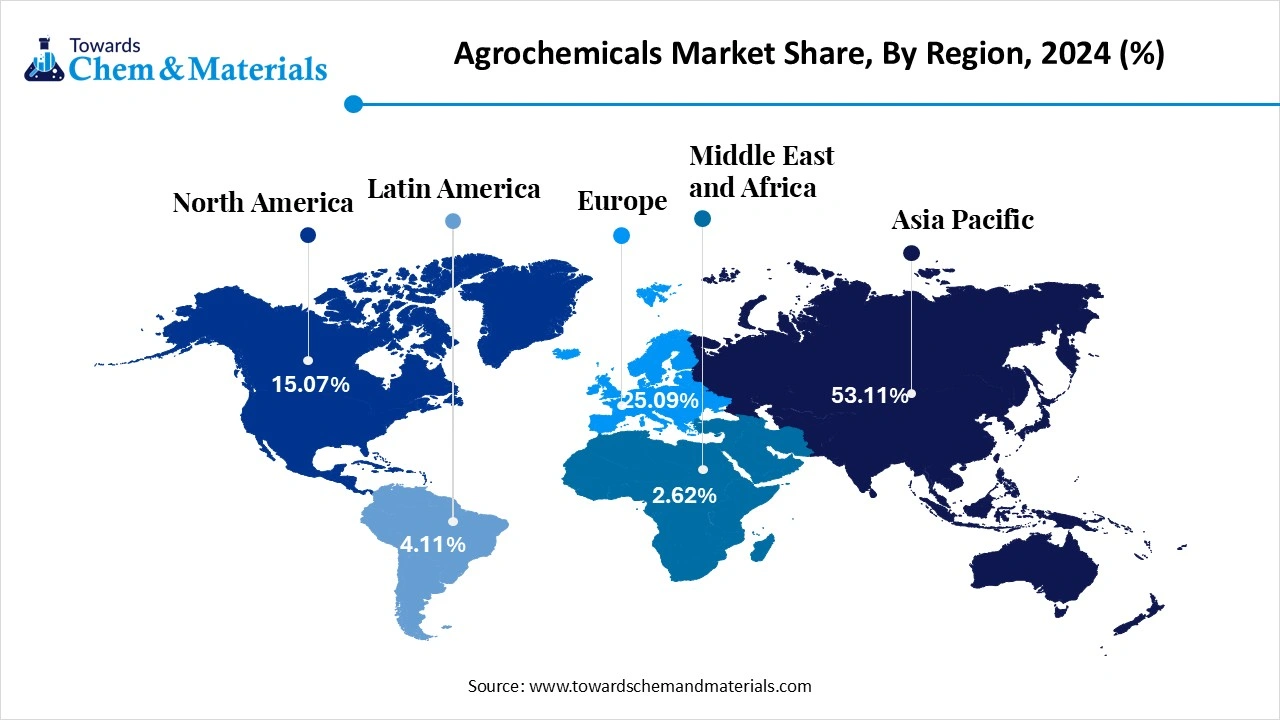
- The Asia Pacific dominated the agrochemicals market with the largest volume share of 54.34% in 2025.
- By product, the fertilizers segment dominated the market and accounted for the largest volume share of 79.28% in 2025.
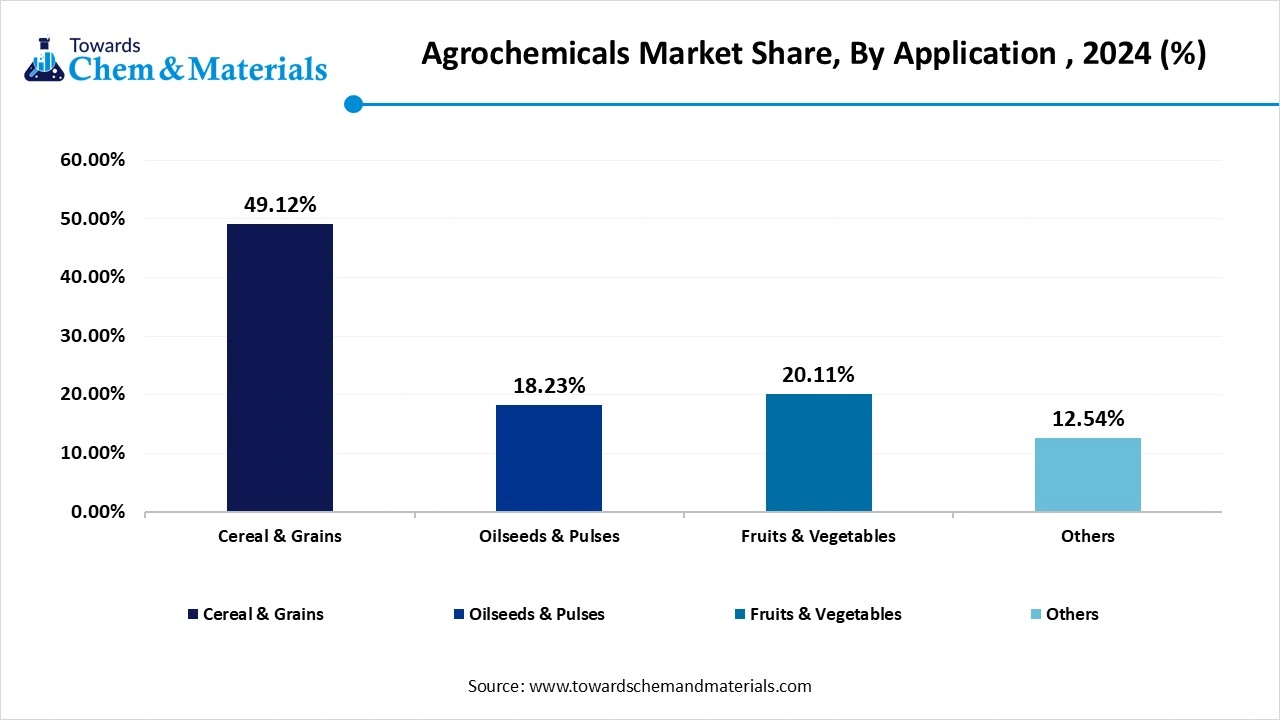
- By application, the cereal & grains segment led the market with the largest revenue volume share of 50.72% in 2025.
The Role of Agrochemicals in Crop Protection & Modern Agriculture
Agrochemical is a chemical used in agricultural practices to protect crops from pests & diseases. They help to improve the quality of crops and enhance crop yields. They consist of various types, like fertilizers, crop protection chemicals, plant growth regulators, and many more. Fertilizers offer essential nutrients to the soil and help in the growth of the plants, which include potassium, nitrogen, and phosphorus fertilizers. Crop protection chemicals prevent damage to crops caused due to diseases, pests, & weeds, which include pesticides, fungicides, insecticides, and herbicides. Plant growth regulators focus on the development of plant growth, like promoting flowering, including gibberellins & ethylene.
Agrochemicals reduce crop losses and ensure food security. The growing population and rising demand for food globally increase demand for agrochemicals. The growing adoption of precision agriculture techniques helps in the market growth. The growing demand for increasing crop productivity fuels the adoption of agrochemicals. Factors like limited arable land, growing food security demand, rising intensive agriculture practices, technological advancements in agriculture, and growing awareness about the benefits of agrochemicals contribute to the overall growth of the market.
- According to Volza’s Global Export data, Brazil exported 1295 shipments of agrochemicals. (Source: volza)
- According to Volza’s Global Export data, Syngenta Crop Protection SDN BHD accounted maximum export share of agrochemicals.
(Source: volza) - According to OEC World, Russia exported $15.3B of fertilizers in 2023.
(Source:oec.world) - According to OEC World, Canada exported $10.4B of fertilizers in 2023.
(Source: oec.world) - According to OEC, the United States exported $ 5.04B of pesticides in 2023.
(Source:oec.world) - According to OEC, France exported $ 3.99B of pesticides in 2023.
(Source: oec.world)
Growing Population and Rising Food Demand Drive the Agrochemicals Market
The rapid growth in population in various regions and rising demand for food increases demand for higher crop yields, fueling the adoption of various agrochemicals. The growing food demand puts pressure on agricultural infrastructure, which increases demand for agrochemicals for better crop yields. The farmers are giving preference to agrochemicals to meet the growing demand for food. The strong focus on maximizing agricultural yields increases demand for agrochemicals to protect crops and enhance the fertility of soil. The growing demand for cereals, vegetables, fruits, legumes, and many other food products increases the adoption of agrochemicals to enhance the lifespan and nutritional quality. The growing population increases the demand for food security. The growing population and the shrinkage of arable lands increase demand for agrochemicals to enhance agricultural yields. The growing population and rising food demand are key drivers for the agrochemicals market growth.
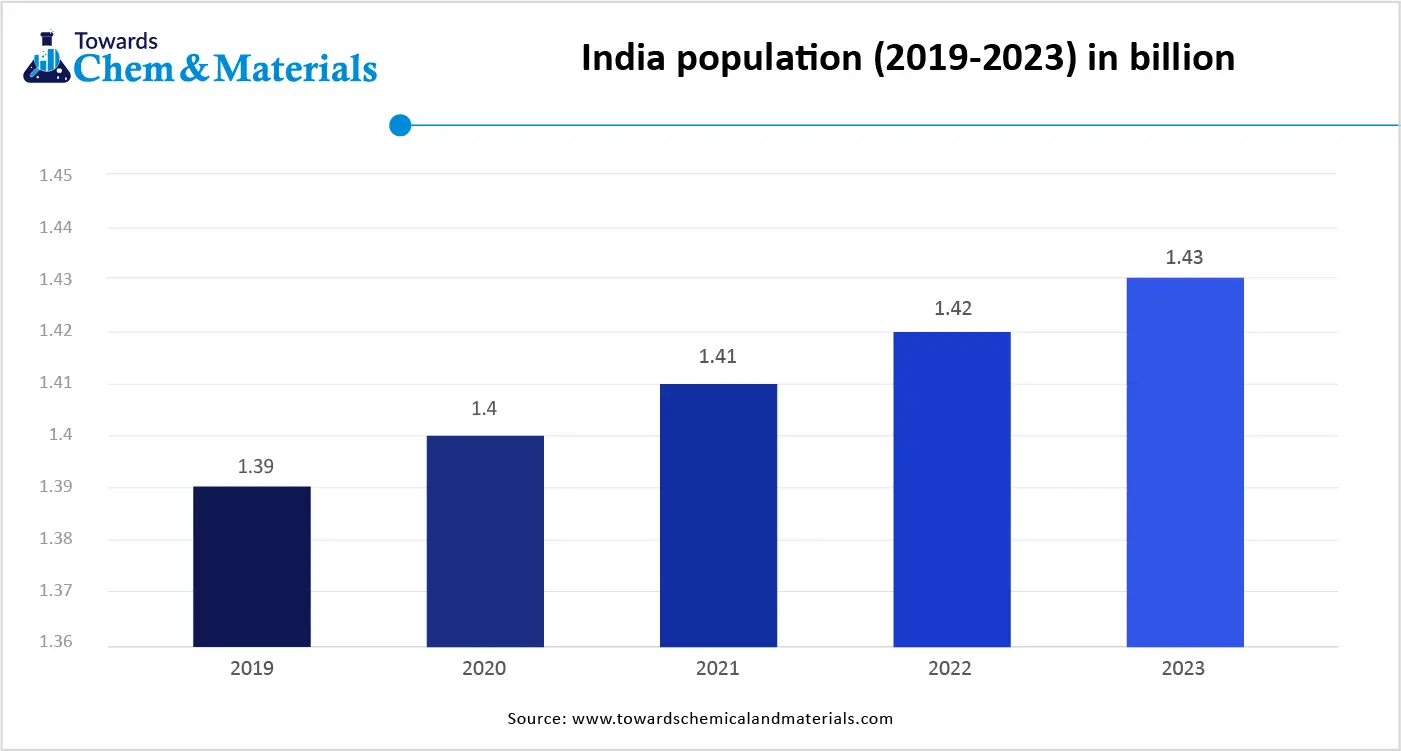
- According to the World Bank Group, the population of India is growing continuously. In 2023, India's Population was 1.44 billion.
Market Trends
- Technological Advancements in Farming:- The growing technological advancements in farming, like precision agriculture, increase demand for agrochemicals. These chemicals maximize crop yields and minimize environmental impacts.
- Growing Awareness About the Advantages of Agrochemicals:- The growing awareness of agrochemicals benefits among farmers & consumers increases adoption. Agrochemicals help farmers to meet growing food demand and enhance food quality.
- Increasing Development of New Crop Solutions:- The growing various diseases and pests to crops increases demand for the production of new crop solutions. The growing demand for food security and a focus on sustainability encourage the development of new crop solutions.
Report Scope
| Report Attributes | Details |
| Market Size in 2026 | USD 300.91 Billion |
| Expected Size by 2036 | USD 485.13 Billion |
| Growth Rate from 2026 to 2035 | CAGR 5.45% |
| Base Year of Estimation | 2025 |
| Forecast Period | 2026 - 2035 |
| Dominant Region | Asia Pacific |
| Segment Covered | By Product, By Application, By Region |
| Key Companies Profiled | OCP Group, Phos Agro, Rashtriya Chemical Fertilizer Ltd., Royal Dutch Shell plc, SABIC, Yara International, Adjuvants Plus Inc., Praxair Technology Inc., NCP Chlorchem (Pty) Ltd, Merck KGaA, Southern Agricultural Insecticides, Inc., Ineos Group Ltd, Graham Chemical Corporation, Cargill Incorporated, Evonik Industries, Targray Technology International Inc |
Market Dynamics
Market Drivers
The agrochemicals market is driven by the rising need to improve crop productivity and ensure food security amid growing global population pressure and declining arable land availability. Increasing incidence of pest infestations, plant diseases, and weed resistance is reinforcing demand for crop protection chemicals across cereals, oilseeds, fruits, and vegetables. Farmers are adopting agrochemicals to stabilize yields and reduce losses caused by climate variability, erratic rainfall patterns, and soil degradation. Expansion of commercial farming, horticulture, and high-value crop cultivation is further supporting sustained use of fertilizers, herbicides, insecticides, and fungicides. In addition, government-backed agricultural support programs and extension services are encouraging the use of modern inputs to enhance farm-level productivity.
Market Restraints
The agrochemicals market faces restraints from stringent regulatory frameworks governing product approval, usage limits, and environmental safety across multiple regions. Concerns related to soil health degradation, water contamination, and adverse effects on non-target organisms are increasing scrutiny of chemical-intensive farming practices. Rising resistance among pests and weeds to conventional active ingredients is reducing long-term effectiveness and increasing application frequency, which raises costs for farmers. Volatility in raw material prices and dependence on petrochemical feedstocks can also affect production economics. In some markets, limited awareness and affordability constraints among smallholder farmers restrict optimal adoption of agrochemical products.
Market Opportunities
Significant opportunities exist in the development of next-generation agrochemicals that offer targeted action, lower application rates, and improved environmental profiles. Growth in integrated pest management and precision agriculture is creating demand for formulations compatible with variable-rate application and data-driven farming systems. Increasing adoption of specialty crops, protected cultivation, and greenhouse farming is expanding the market for high-performance crop protection and nutrient solutions. Advances in formulation technologies, including controlled-release and nano-enabled products, are enhancing efficacy and reducing environmental impact. Expansion of agricultural exports and rising focus on quality standards are also encouraging farmers to invest in effective crop protection inputs.
Market Challenges
The agrochemicals market faces challenges related to balancing productivity gains with sustainability and regulatory compliance. Managing resistance development requires continuous innovation, stewardship programs, and farmer education, which can increase development and operational costs. Fragmented regulatory standards across countries complicate global product launches and limit scalability for manufacturers. Public perception issues and increasing preference for organic and residue-free produce are putting pressure on conventional agrochemical usage. Additionally, ensuring equitable access to effective agrochemicals for small and marginal farmers remains a challenge, particularly in emerging economies with limited infrastructure and extension support.
Value Chain Analysis
- Research & Development (R&D): This involves the discovery of new AI and the development of formulations to address specific agricultural challenges, such as pest resistance or nutrient delivery.
- Key Activities: Bayer AG, Syngenta Crop Protection AG, BASF SE, Corteva Agriscience, and FMC Corporation.
- Regulatory Approval and Field Trials: After following R&D, products must undergo extensive field trials and data submission to regulatory bodies to ensure they meet stringent safety and environmental standards.
- Key Players: Bayer, Syngenta, BASF, Corteva
- Manufacturing and Formulation:This involves two key steps: the capital-intensive manufacturing of the AI and the blending of AI with inert ingredients, solvents, and additives to create the final, usable product.
- Key Players: Bayer AG, Syngenta, BASF SE, UPL Limited, PI Industries, Sumitomo Chemical, ADAMA, and Nufarm.
- Marketing, Sales, and Application:This involves promoting products and ensuring they are applied correctly by farmers for effective application and achieving desired yields.
- Key Players: Bayer AG, UPL, and Syngenta.
Segmental Insights
By product
How did the Fertilizers Segment Hold the Largest Share of the Agrochemicals Market?
The fertilizers segment led the agrochemicals market in 2025. The growing demand for essential nutrients like potassium, nitrogen, and phosphorus in crop production increases demand for agrochemicals. The growing demand for food increases the demand for crop productivity, helping in the market growth. The growing demand for nitrogen fertilizer due to protein synthesis & plant growth helps in the market growth.
Fertilizers are easily available, affordable, and an ideal choice for farmers. The growing demand from diverse crops like cereals, fruits, grains, & vegetables, and growing technological advancements in fertilizers technology help in the market growth. Additionally, growing demand for various fertilizers like phosphorus, micronutrients, and potassium fertilizers drives the overall growth of the market.
The crop protection chemicals are the fastest-growing in the market during the forecast period. The growing demand for maximizing crop yield due to the increasing worldwide population increases demand for crop protection chemicals. The rising demand for food helps in the market growth. The growing food security demand and the presence of limited arable land increase demand for crop protection chemicals.
The growing adoption of precision farming and the development of effective crop protection chemicals help in the market growth. The growing demand for staple crops like maize, wheat, and rice fuels demand for crop protection chemicals. The growing demand for various crop protection chemicals like fungicides, pesticides, insecticides, and herbicides drives the overall growth of the market.
By Application
Why did the Cereals & Grains Segment Dominate the Agrochemicals Market?
The cereals & grains segment dominated the agrochemicals market in 2025. The growing demand for cereals & grains like maize, wheat, and rice increases demand for agrochemicals. The growing demand for food production increases demand for the production of cereal & grains. The growing variety of diseases like weeds & pests on cereals & grains helps in the market growth.
The strong government focus on boosting food production propels the production of cereals & grains. The changing dietary preferences, growing cultivation, and consumption of cereals & grains drive the market growth. Additionally, growing consumption of cereal & grains in the Asia Pacific region supports the overall growth of the market.
The fruits & vegetables segment is the fastest-growing in the market during the forecast period. The growing consumption of fruits & vegetables in various regions helps in the market growth. The growing awareness about nutritional benefits and healthier diets increases demand for fruits & vegetables. The growing cultivation of fruits & vegetables increases demand for agrochemicals.
The adoption of intensive farming in the cultivation of fruits & vegetables fuels demand for agrochemicals to enhance yields. The growing export of fruits & vegetables needs agrochemicals for maintaining longer shelf life & and quality during transportation. The growing shift towards high-value crops like fruits & vegetables drives the overall growth of the market.
Regional Insights
Why did Asia Pacific Dominate the Agrochemicals Market?
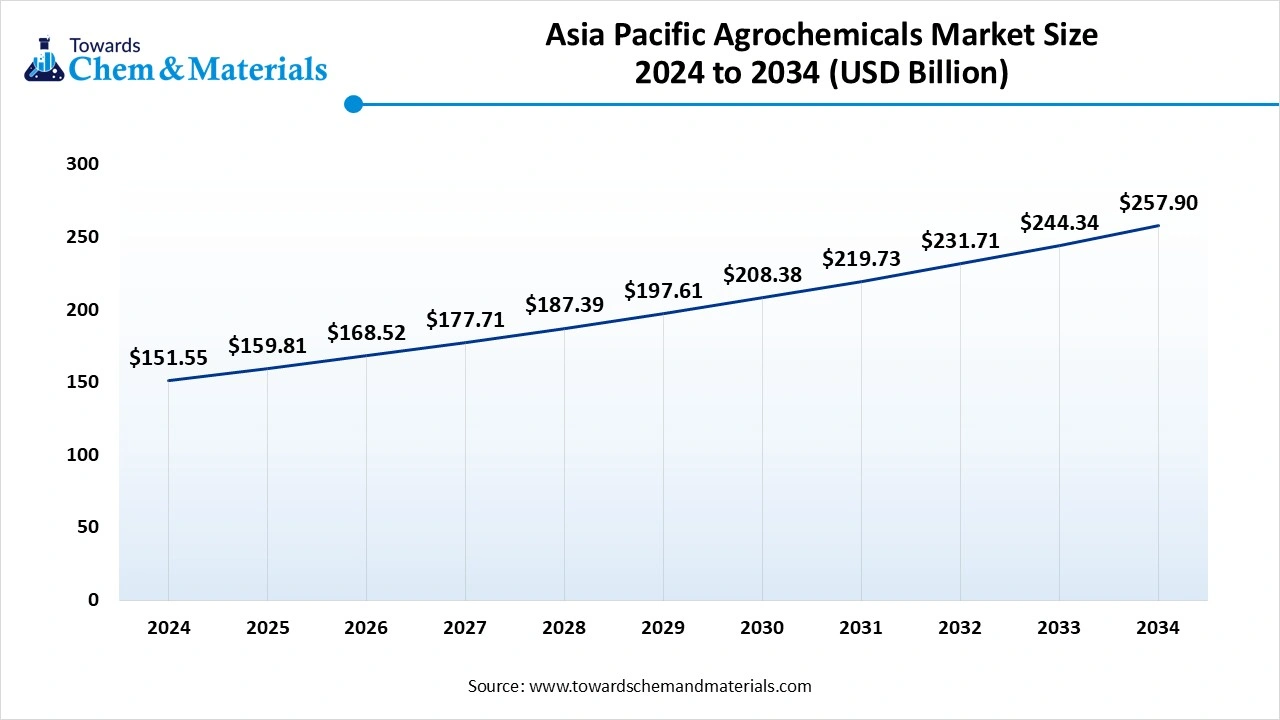
The Asia Pacific agrochemicals market is expected to increase from USD 159.81 billion in 2025 to USD 271.95 billion by 2034, growing at a CAGR of 5.46% throughout the forecast period from 2025 to 2034. Asia Pacific dominated the agrochemicals market in 2025. The growing food demand and the presence of a large population increase demand for agrochemicals to improve crop yields. The well-established agricultural landscape and growing production of various crops help in the market growth. The growing adoption of modern farming techniques increases demand for agrochemicals for the efficient production of crop yields. The rising intensive farming cultures like monocultures increase risks of pests & diseases, fueling demand for agrochemicals.
The government's investment in agriculture and focus on sustainable farming practices drive the market growth. The growing focus on local production of agrochemicals in the region helps market growth. The presence of key players like Syngenta, Bayer, Corteva, DuPont, and BASF supports the overall growth of the market.
A Growing Population Surges Demand for Agrochemicals in China
China is a key player in the agrochemicals market. The large-scale agricultural production increases demand for agrochemicals like crop protection chemicals & fertilizers. The growing population and rising demand for food help in the market growth. The strong government support for the production of pesticides drives the market growth. The growing production of agrochemicals like fertilizers, herbicides, & pesticides, and increasing export of phosphate fertilizers, herbicides, and fungicides contribute to the overall market growth.
- According to Volza’s Global Export data, China exported 5110 shipments of agrochemicals. (Source: volza)
- According to OEC World, China exported $10.9B of fertilizers in 2023.
(Source:oec.wolrd) - According to Volza’s India Export data, China exported 32024 shipments of fungicide.(Source: volza)
- According to OEC, China exported $ 9.47B of pesticides in 2023.(Source: oec.world)
- According to Volza’s India Export data, China exported 13829 shipments of plant growth regulators.(Source: volza)
How is India Growing in the Agrochemicals Market?
India is rapidly growing in the agrochemicals market. The rapid growth in the population and the continuously growing demand for food increases demand for agricultural production, fueling demand for agrochemicals. The strong government support for farmers and sustainable agriculture helps market growth. The rising adoption of modern agricultural techniques like precision farming increases demand for agrochemicals. The growing demand for higher quality foods and Indian companies' strong investment in new production facilities of agrochemicals drive the overall growth of the market.
- According to Volza’s Global Export data, India exported 3667 shipments of agrochemicals. (Source:volza)
- According to Volza’s India Export data, from October 2023 to September 2024, India exported 943 shipments of agrochemicals.(Source:Volza)
- According to OEC World, India exported $177M of fertilizers in 2023.
(Source:oec.world) - According to Volza’s India Export data, India exported 70365 shipments of fungicide. (Source: volza)
- According to Volza’s India Export data, India exported 17950 shipments of plant growth regulators. (Source:volza)
Which Region is Fastest-Growing in the Agrochemicals Market in 2024?
Europe is experiencing the fastest growth in the market during the forecast period. Strong presence of the agricultural sector in countries like the UK, Germany, and France increases demand for agrochemicals. The growing export of agrochemicals in the region helps in the market growth. The strong focus on sustainable agricultural practices increases demand for organic herbicides, biopesticides, and biofertilizers.
The growing agricultural productivity in Eastern Europe and the adoption of precision farming fuel demand for agrochemicals. The growing demand for insecticides, herbicides, and fungicides drives the market growth. The stringent regulatory frameworks, like the Farm to Fork Strategy and the Green Deal, increase demand for sustainable agrochemicals. The presence of major companies like BASF and Bayer CropScience supports the overall growth of the market.
Germany Agrochemicals Market Trends
Germany is a significant player in the agrochemicals market. The well-established agricultural sector and growing adoption of advanced farming technologies like precision farming increase demand for agrochemicals. The growing focus on sustainable agricultural practices increases demand for low-risk or bio-based agrochemicals.
The growing innovation and development of agrochemical solutions help in the market growth. The growing demand for crop protection solutions in the country helps the market growth. Additionally, the growing innovation, production, and distribution of agrochemicals drive the overall growth of the market.
- According to OEC, Germany exported $1.93B of potassic fertilizers in 2023(Source:oec.world)
- According to Volza’s India Export data, Germany exported 13822 shipments of fungicide.(Source:volza)
- According to Volza’s Germany Fertilizers Export data, AMAZONEN WERKE H DREYER SE CO K is the leading supplier of fertilizers in Germany. (Source:volza)
How Will North America Be Considered a Notable Region in the Agrochemicals Market?
North America is expected to see notable growth in the near future. This growth will primarily stem from the increasing demand for enhanced food production, the adoption of precision agriculture, and a strong shift towards sustainable and bio-based solutions, driven by consumer preferences and strict regulations. A growing population and the demand for high-quality food necessitate greater agricultural productivity. As a result, the use of agrochemicals to maximize yields is on the rise, encouraging the adoption of high-input, sustainable farming practices and investment in new technologies and products.
U.S. Agrochemicals Market Trends
The U.S. plays a foundational role in the global market due to its advanced farming technologies, large agricultural sector, and significant investments in research and development (R&D). The U.S. is a center for agrochemical R&D, with major corporations such as Corteva, FMC, and BASF heavily investing in innovative, often bio-based and sustainable formulations, along with pushing the industry towards safer, eco-friendly alternatives and precision farming techniques.
Emergence of Latin America in the Agrochemicals Market
Latin America is also experiencing substantial growth in the global market, driven by increasing demand to enhance agricultural productivity to meet rising global food needs, widespread issues with pest resistance, invasive species, and significant investments in technological advancements like precision farming. The rapid expansion of acreage for major crops such as soybeans and corn in Brazil and Argentina, fueled by strong export demand, has created a large market for related agrochemicals, particularly herbicides and fertilizers.
Brazil Agrochemicals Market Trends
Brazil plays a key role in the global market, known for its vast agricultural landscape and status as a top exporter of agricultural commodities. It is the largest consumer of agrochemicals, relying heavily on these inputs to maintain high yields of major crops like soybeans, corn, and sugarcane. Brazil also depends on imports for a significant portion of its fertilizer needs and agrochemical technical ingredients, making its market vulnerable to global price fluctuations and supply chain disruptions.
How Will the Middle East and Africa Contribute to the Agrochemicals Market?
The Middle East and Africa are important contributors to the global market due to urgent food security concerns driven by population growth and limited arable land, alongside significant investments in agricultural modernization and technology. National governments are recognizing the need to reduce reliance on food imports and diversify their economies. They are actively promoting the agricultural sector by providing subsidies for fertilizers and pesticides, expanding irrigation infrastructure, and offering grants for mechanization and precision farming technologies.
UAE Agrochemicals Market Trends
The UAE plays a significant role in the global market due to its strategic location and excellent logistics infrastructure. The UAE serves as a major trade and re-export hub for agrochemical products, connecting suppliers from Asia, North America, and Europe. The UAE government and private entities are investing heavily in agritech and acquiring farmland overseas to ensure national food security, which drives demand for specialized agrochemicals tailored to challenging environments.
Recent Developments
- In January 2026, enforcement agencies in Gujarat unearthed a large, organized network involved in the manufacture and distribution of counterfeit and spurious agrochemicals, raising serious concerns over farmer livelihoods, consumer safety, and the stability of India’s agricultural economy. (Source: www.global-agriculture.com)
- In December 2025, the Haryana Agriculture and Farmers Welfare Department has set a target of covering one lakh acres through drone-based spraying of agrochemicals under the state-run “Agrishakti Namo Drone Didi” scheme. The initiative aims to promote women empowerment in rural areas while ensuring the scientific and precise application of fertilizers and insecticides in agriculture.(Source: www.tribuneindia.com)
Top Companies List
- OCP Group
- Phos Agro
- Rashtriya Chemical Fertilizer Ltd.
- Royal Dutch Shell plc
- SABIC
- Yara International
- Adjuvants Plus Inc.
- Praxair Technology Inc.
- NCP Chlorchem (Pty) Ltd
- Merck KGaA
- Southern Agricultural Insecticides, Inc.
- Ineos Group Ltd
- Graham Chemical Corporation
- Cargill Incorporated
- Evonik Industries
- Targray Technology International Inc
Segments Covered
By product
- Fertilizers
- Nitrogenous
- Phosphatic
- Potassic
- Secondary Fertilizers
- Others
- Crop Protection Chemicals
- Herbicides
- Fungicides
- Insecticides
- Others
- Plant Growth Regulators
- Others
By application
- Cereals & Grains
- Fruits & Vegetables
- Oilseeds & Pulses
- Others
By region
- North America
- U.S.
- Canada
- Europe
- Germany
- UK
- France
- Italy
- Spain
- Sweden
- Denmark
- Norway
- Asia Pacific
- China
- Japan
- India
- South Korea
- Thailand
- Latin America
- Brazil
- Mexico
- Argentina
- Middle East & Africa
- South Africa
- UAE
- Saudi Arabia
- Kuwait
A Seven-Phase Framework
Our methodology is designed to be universally applicable across commodity chemicals, specialty chemicals, petrochemicals, construction chemicals, coatings, electronic chemicals, industrial gases, agrochemicals, water treatment chemicals, and performance materials. Each phase builds upon the last, creating a layered validation structure that minimizes estimation error and maximizes analytical confidence.
The framework ensures comprehensive market coverage, robust cross-validation, and reliable long-term forecasting — producing market estimates that withstand scrutiny from investors, regulators, and corporate strategy teams.

Seven-Phase Framework — Analytical Effort Distribution
Relative analytical effort allocated across each phase of the Chemicals & Materials research framework

Phase 1 - Secondary Research: Establishing the Foundation
Secondary research collects and evaluates publicly available information from authoritative sources, establishing the foundational understanding of market structure, value chain dynamics, competitive landscape, and end-use demand patterns. Every source is evaluated for credibility, recency, geographic relevance, and methodological soundness before inclusion.
Industry Associations
Sources include ACC, CEFIC, ICCA, JCIA, CPCIF, and SOCMA providing production volumes, consumption trends, capacity developments, and sustainability initiatives.
Company Disclosures
Annual reports, investor presentations, earnings transcripts, and regulatory filings reveal product portfolios, manufacturing footprints, capacity expansions, and revenue segmentation.
Government Databases
National statistical offices, customs authorities, environmental agencies, and industrial production databases provide verified statistics on output, trade flows, and regulatory compliance.
Trade Databases
UN Comtrade, ITC, Eurostat, and national customs authorities enable assessment of global product movement, import dependency, and export competitiveness across regions.
Our Secondary Research Sources
- Ministry of Chemicals and Fertilizers
- European Chemicals Agency
- United States Department of Energy
- Ministry of Industry and Information Technology
- Ministry of Economy Trade and Industry
- Ministry of Trade Industry and Energy
- National Institute of Standards and Technology
- Council of Scientific and Industrial Research
- Fraunhofer Society
- National Institute for Materials Science
Phase 2 — Supply-Side Assessment: Mapping Production Capabilities
Production Capacity Analysis
All major manufacturers are assessed for existing installed capacity, planned additions, expansions, new plant announcements, and technology adoption — mapped at global, regional, and country levels.
Capacity Utilization Adjustment
Installed capacity is adjusted using utilization rates based on demand conditions, feedstock availability, plant operating rates, maintenance schedules, and regulatory restrictions.
Manufacturer Revenue Analysis
Product-specific revenues, segment-level performance, regional distribution, average selling prices, and margin trends are evaluated to establish market value estimates.
Supply-Side Assessment — Capacity vs. Effective Production by Region
Illustrative comparison of installed capacity vs. effective production volume (after utilization rate adjustment) across major regions

Phase 3 — Demand-Side Assessment: Quantifying Chemical Consumption
Demand-side analysis quantifies chemical consumption across industries, applications, and geographies — identifying where and how chemicals are consumed throughout the value chain with precision.
End-Use Industry Analysis
Chemical demand is evaluated across automotive, construction, packaging, electronics, agriculture, healthcare, consumer goods, industrial manufacturing, energy and utilities, and water treatment. Industry output, production trends, and consumption intensity are analyzed to determine demand patterns.
Consumption Modeling
Demand is estimated using measurable indicators: kilograms per vehicle, kilograms per square meter of construction, dosage per cubic meter of water treated, kilograms per hectare of agricultural land, and kilograms per ton of manufactured products. Consumption factors are validated through industry publications and primary interviews.
Application Analysis
The market is segmented by application area to understand product performance requirements, formulation trends, technology adoption, customer preferences, and regulatory requirements improving demand accuracy and segmentation granularity.
Demand-Side Assessment — End-Use Industry Demand Distribution
Illustrative distribution of chemical & materials demand across key end-use industries

Phase 4 - Trade Flow Analysis: Balancing Regional Supply and Demand
Trade flow analysis reconciles regional supply and demand estimates through import and export data, identifying net supply positions, regional dependencies, and market imbalances. It serves as an independent validation layer that tests the consistency of supply-side and demand-side estimates.
Import Analysis
Import data is evaluated to determine volumes, source countries, product dependency, regional supply gaps, and pricing trends — identifying markets that rely heavily on external supply and where domestic production is insufficient to meet demand.
Export Analysis
Export assessments reveal production surplus, export competitiveness, regional manufacturing strength, and global market participation. Export patterns also help validate domestic production estimates and identify net exporting regions.
Apparent Consumption Model
Regional consumption is assessed using the standard apparent consumption formula:
Results identify net importing regions, net exporting regions, regional deficits, and surpluses — serving as an independent validation of supply and demand estimates.
Trade Flow Analysis — Net Supply Position by Region
Illustrative apparent consumption vs. domestic production across major regions — positive gap indicates net import dependency

Phase 5 — Primary Research: The Critical Validation Layer
Primary research tests and refines findings from secondary research through direct engagement with industry participants across the supply chain, demand side, and expert community. It captures intelligence that no database or published report can provide — the real-world experience of manufacturers, buyers, and specialists operating in the market.

Supply-Side Interviews
Conversations with chemical manufacturers, raw material suppliers, contract manufacturers, technology providers, and plant operators cover production trends, capacity utilization, pricing developments, technology shifts, and competitive dynamics.

Demand-Side Interviews
Engagement with OEMs, industrial consumers, procurement managers, distributors, formulators, and end-use manufacturers focuses on consumption trends, purchasing behavior, product substitution, demand outlook, and emerging applications.

Industry Expert Consultations
Additional interviews with industry consultants, independent experts, regulatory specialists, technical professionals, and research institutions provide deeper market context and validate key analytical assumptions.
Focus Areas of Primary Research:
Market Size & Forecast Validation
Revenue estimates, volume consumption, growth rates, forecast assumptions, regional demand.Supply Chain & Value Chain Assessment
Raw material sourcing, supply chain challenges, distribution networks, procurement practices.Production & Capacity Analysis
Manufacturing capacity, utilization rates, expansion projects, plant investments.Pricing & Cost Structure Analysis
Product pricing trends, feedstock costs, energy costs, margin pressures, pricing outlook.Competitive Landscape Assessment
Volume and value estimates confirmed to be fully consistent with one another before publicationInterview Volume by Market Scope
| Study Scope | Number of Interviews |
|---|---|
| Niche Market | 20 – 30 |
| Mid-Sized Market | 30 – 50 |
| Global Market | 50 – 80 |
| Highly Fragmented Market | 80 – 120 |
Interview Details:
Category : Manufacturers, Suppliers, Distributors, End Users, Experts/Associations
Average Duration : 30–60 Minutes
Interview Mode : Video calls, telephonic interviews, expert consultations
Interview Format : Structured / Semi-Structured questionnaire
Focus Areas of Primary Research:
Market Size & Forecast Validation :
Revenue estimates, volume consumption, growth rates, forecast assumptions, regional demand.
Supply Chain & Value Chain Assessment :
Raw material sourcing, supply chain challenges, distribution networks, procurement practices.
Production & Capacity Analysis :
Manufacturing capacity, utilization rates, expansion projects, plant investments.
Pricing & Cost Structure Analysis :
Product pricing trends, feedstock costs, energy costs, margin pressures, pricing outlook.
Competitive Landscape Assessment :
Market share, competitor positioning, strategic initiatives, partnerships, acquisitions.
Primary Research — Stakeholder Coverage by Category
Distribution of interview respondents across stakeholder categories (% share from PPT data)

Primary Research — Respondent Designation Profile
Seniority breakdown of interview respondents (% share from PPT data)

Primary Research — Geographic Coverage of Interviews
Regional distribution of primary research engagement (% share from PPT data)

Phase 6 — Data Triangulation and Market Validation
No single methodology is relied upon in isolation. Multiple independent estimation approaches are combined and reconciled to ensure consistency, accuracy, and analytical defensibility. Any material deviations between approaches are investigated and adjusted through additional validation cycles.
The final market size is derived through weighted triangulation of all validated methodologies. Any material deviations between approaches are investigated and adjusted through additional validation cycles. The outcome represents the most realistic assessment of the market based on available evidence and expert confirmation ensuring that volume and value estimates are fully consistent with one another.
Triangulation Framework — Input Contribution Weight
Relative weight each sizing input contributes to the final reconciled market estimate

Phase 7 — Forecast Modeling: Projecting Future Market Evolution
Forecasting evaluates the future trajectory of the market using a combination of quantitative indicators and qualitative assessments across economic, industry, and regulatory dimensions. Rather than simple extrapolation, each driver is independently modeled and integrated into a composite forecast.
Macroeconomic Indicators
GDP growth, industrial production, manufacturing output, construction activity, consumer spending, and capital investment form the quantitative foundation of long-term demand projections. These are applied at country, regional, and global levels.
Industry Growth Drivers
Urbanization, infrastructure development, industrialization, technological innovation, sustainability initiatives, and evolving product performance requirements are assessed at regional and industry levels — capturing both structural and cyclical demand drivers.
Capacity Expansion Analysis
Announced plant expansions, new manufacturing facilities, technology upgrades, and strategic investments are evaluated to determine future supply-demand dynamics and potential market tightness or oversupply situations.
Regulatory & Sustainability
Environmental regulations, chemical safety standards, emission reduction targets, circular economy initiatives, and sustainability requirements are incorporated as they often influence product adoption rates and market growth trajectories.
Scenario Forecast Range — Indexed Market Growth (Year 1–10)
Illustrative indexed growth trajectories across Base, Optimistic, and Pessimistic scenarios over a 10-year forecast horizon

Forecast Drivers — Relative Impact Score by Category
Impact score (0–100) of each driver type on chemicals & materials market forecast




Comments
Share your thoughts, ask a question, or provide feedback about this report.