
Stainless Steel-Filled Polymer Filaments Market Size and Forecast 2026 to 2035
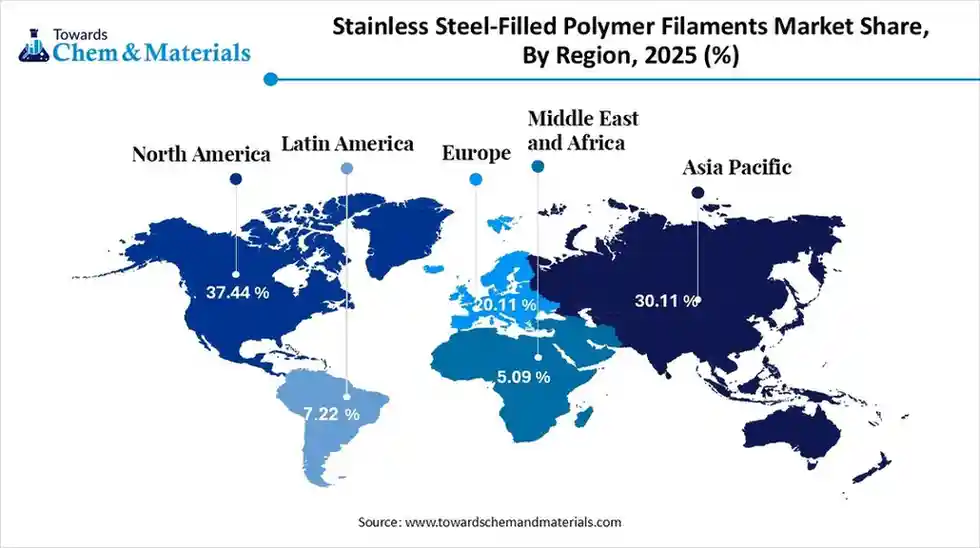
The global stainless steel-filled polymer filaments market size is calculated at USD 85.19 million in 2025 and is predicted to increase from USD 90.61 million in 2026 and is projected to reach around USD 157.82 million, The market is expanding at a CAGR of 6.36% between 2026 and 2035. North America dominated the stainless steel-filled polymer filaments market with a market share of 37.44% the global market in 2025.The growth of the market is driven by rising demand for high-strength metals like 3D printing materials that offer enhanced durability, precision, and cost-effective manufacturing for automotive, aerospace, and industrial applications.
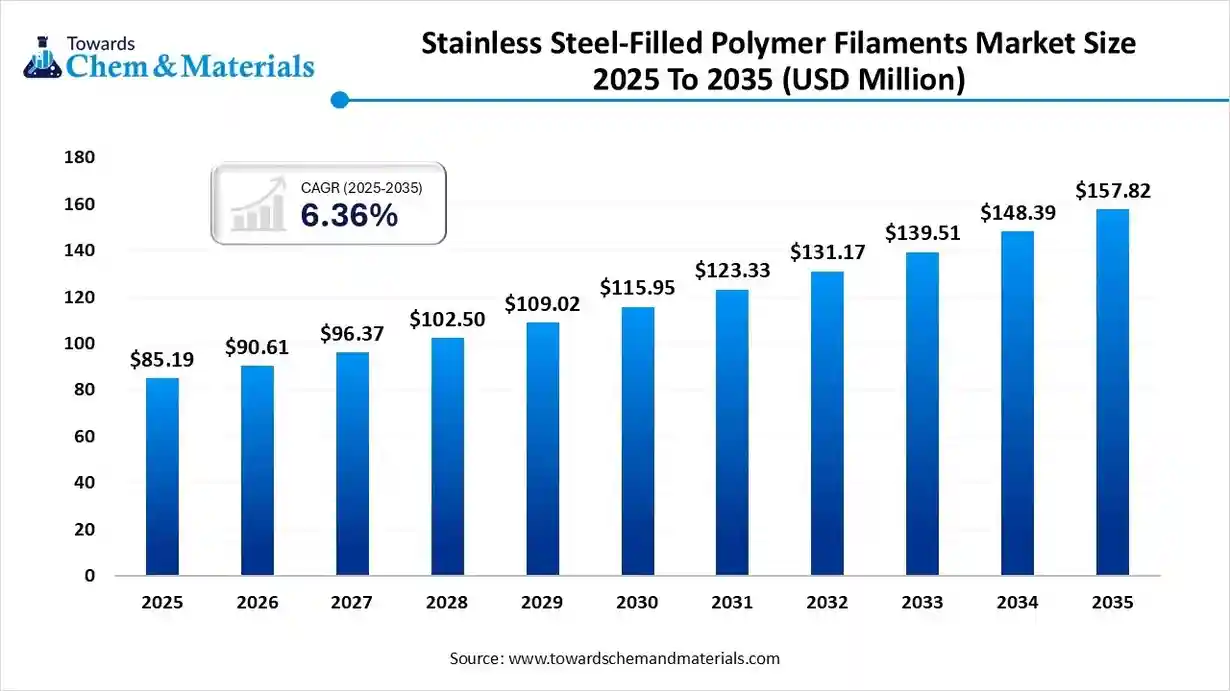
Key Takeaways
- By region, North America led the stainless steel-filled polymer filaments market with the largest revenue share of over 37.44% in 2025.
- By type, the PLA-stainless steel filament segment led the market with the largest revenue share of 43.72% in 2025.
- By application, the prototyping & design models segment led the market with the largest revenue share of 34.79% in 2025.
Market Overview
Metal-enhanced 3D printing materials are being used by industries to create components that are stronger and more durable because of the filament's exceptional strength, dimensional stability, and economical production. Adoption is increasing due to growing demand from the automotive, aerospace, and industrial tooling sectors. The market is growing faster thanks to ongoing developments in additive manufacturing.
Market Outlook
- Industry Growth Overview: As manufacturers move toward more sophisticated additive manufacturing materials that provide metal-like strength at lower costs, the market for stainless steel-filled polymer filaments is steadily expanding. Demand is rising due to increased use in engineering, automotive, aerospace, and functional prototyping, which is bolstered by ongoing advancements in material performance and printability.
- Sustainability Trends: As filament manufacturers investigate recycled steel powders, environmentally friendly polymers based and energy-efficient production techniques, sustainability is influencing the market. These filaments are becoming more appealing for environmentally friendly industrial processes due to their capacity to 3D print robust long long-lasting components, which minimizes material waste and supports circular manufacturing models.
- Global Expansion: Global expansion is being driven by rising 3D printing adoption in North America, Europe rapidly industrialization Asia markets. Companies are widening distribution networks, forming cross-border partnerships, and investing in local production facilities to meet growing demand for high-performance, metal-filled filaments across diverse industries.
Key Technological Shifts
| Technological Shifts | Description |
| Improved Sintering Technologies | Advancements in debinding and sintering allow near-metal densities, better mechanical strength, and reduced part distortion. |
| Higher Metal Loading Ratios | New formulations enable higher stainless-steel powder content inside filaments, improving durability and a metal-like finish. |
| Enhanced FFF Printer Compatibility | Filaments are now optimized to run on standard FFF/FDM printers, enabling broader industrial and consumer adoption. |
| Automation & Process Control | Integrated software, temperature control, and automated debinding cycles increase production consistency and reduce error rates. |
| Advanced Binder Systems | New binder chemistries ensure smoother extrusion, easier post-processing, and improved structural stability during printing. |
Trade Analysis of the Stainless Steel-Filled Polymer Filaments Market
- According to India import data, the India imported 349 shipments of Plastic Filament.
- The United States, Ukraine and Vietnam are the leading importers of plastic filaments. The U.S. leads with 3,022 shipments, followed by Ukraine with 2,094 shipments and Vietnam with 1,693 shipments.
- According to Global Import, the world imported 640,263 shipments of Stainless Steel during June 2024 to May 2025
- Leading Stainless-steel importers are Vietnam, United States, and Japan. Vietnam leads with the import of 870,156 shipments, United States with 433,119 shipments, and Japan with 120,770 shipments.
Report Scope
| Report Attribute | Details |
| Market Size Value in 2026 | USD 90.61 Million |
| Revenue Forecast in 2035 | USD 157.82 Million |
| Growth Rate | CAGR 6.36% |
| Forecast Period | 2026 - 2035 |
| Base Year | 2025 |
| Dominant Region | North America |
| Fastest Growing Region | Asia Pacific |
| Segments covered | By Type, By Application, By Region |
| Key companies profiled | The Virtual Foundry, ProtoPlant (Proto-pasta), ColorFabb, Nobufil, Zetamix , Fiberlogy, Wan Hao 3D, Dai-Ichi Ceramo, FlashForge |
Value Chain Analysis
- Chemical Synthesis and Processing: To create stainless steel-filled polymer filaments that are uniform, print smoothly, and can be sintered for high-density metal parts, fine stainless steel powder is combined with a polymer binder. Particle size, filament consistency, and proper powder loading are the main concerns of the procedure.
- Key Players: BAFS Ultra fuse, the Virtual Foundry, Proto pasta, Zetamix
- Quality Testing and Certification: After sintering, quality checks guarantee that the filament prints consistently and creates sturdy parts. Businesses test the garments dimensional accuracy, shrinkage, etc., content, and thermal stability, while some conduct internal testing, others rely on accredited outside laboratories.
- Key Players: Fusion3, Independent AM testing labs, and leading filament manufacturers.
- Distribution to Industrial Users: AM-focused distributors, technical resellers, and manufacturers direct online sales are how these filaments get to industrial consumers. These partners frequently provide industry buyers with printing and sintering advice in addition to material supply.
- Key Players: M. Holland, The Virtual Foundry, Proto pasta.
Segmental Insights
Type Insights
What Made PLA-Stainless Steel Filament Segment Dominate The Stainless Steel-Filled Polymer Filaments Market In 2025?
The PLA-stainless steel filament segment dominates the market share of 43.72% in 2025 due to its metallic finish, biodegradability, and simplicity of printing. They are the best options for prototyping and decorative applications due to their high aesthetic appeal and compatibility with common 3D printers. When it comes to industrial and consumer adoption, this type leads the market. Furthermore, it is perfect for high precision designs due to its low warping and dimensional stability for economical small batch production. Manufacturers also prefer plastic stainless steel.
The nylon (PA) segment is the fastest-growing type in the market, driven by its chemical resistance, flexibility, and mechanical strength. Functional prototyping and engineering applications, and aerospace are common uses for it. Its quick expansion is driven by the growing need for strong, high-performing filaments.
ABS-stainless steel filaments are notable for their impact resistance, thermal stability, and ease of post-processing. They are being utilized more frequently in custom components and structural prototypes that need to be strong and have a metallic appearance. Performance and aesthetics are known to be bridged by this type. It is also appropriate for a functional end-use part due to its higher temperature resistance.
Application Insights
What Made The Prototyping & Design Models Segment Dominate The Stainless Steel-Filled Polymer Filaments Market In 2025?
Prototyping & design models segment dominate the market share of 34.79% in 2025, thanks to the stainless steel-filled filaments metallic sheen and fine detail accuracy, because they cut down on development time and expenses. These filaments are favored for early-stage product validation. The largest portion of filament consumption is represented by this segment. The segment also gains from the growth of design schools and 3D printing education.
Functional engineering parts segment expects the fastest growth in the market during the forecast period, driven by the machinery, automotive, and aerospace industries. Filaments filled with stainless steel offer the metallic qualities, durability, and heat resistance needed for finished parts. The transition from prototyping to functional applications is what propels growth. Market demand is accelerated by the growing need for customized parts and low-volume production.
Jewelry & decorative objects segment are notable for leveraging the metallic aesthetic and polishable surface of filaments. They are more affordable than real metal and are used by designers and artists to create elaborate, superior works. Growing consumer interest in customized and personalized products helps this market. Furthermore, the filaments enable intricate shapes and great detail that are difficult to achieve with conventional metalwork.
Regional Insights
The North America stainless steel-filled polymer filaments market size was valued at USD 31.90 million in 2025 and is expected to surpass around USD 59.20 million by 2035, expanding at a compound annual growth rate (CAGR) of 6.37% over the forecast period from 2026 to 2035.

North America dominates the market due to early 3D printing technology adoption, sophisticated manufacturing infrastructure, and robust industrial demand. Leading filament producers and creative startups bolster regional leadership. Furthermore, innovation in filament applications is fueled by significant investments in R&D and tech incubators.
U.S. Stainless Steel-Filled Polymer Filaments Market Trends
The U.S. dominates the stainless steel-filled polymer filaments market due to strong industrial 3D printing adoption, advanced R&D, and extensive use of metal polymer materials in aerospace, automotive, and defense. A mature ecosystem of service bureaus and engineering firms supports rapid integration of high-performance filaments. Consistent investment in precision printing technologies keeps the U.S. in a position of authority.
Asia Pacific is the fastest-growing region due to increased cost-effective production, quick industrialization, and the growing application of advanced manufacturing in the automotive electronics and tooling industries. The demand for engineering materials filled with metal has increased due to an increase in small and mid-sized manufacturers. Robust investments in automation accelerate the region's growth.
India Stainless Steel-Filled Polymer Filaments Market Trends
India is seeing a gradual rise in the adoption of stainless steel-filled polymer filaments as advanced 3D printing is being used by industries more and more for lightweight metal replacement tooling and prototyping. Strong heat resistant and corrosion resistant composite materials that perform like metal while being simple to print are becoming more in demand. The growing use of additive manufacturing and the move toward high performance engineered materials growing steadily even through domestic production is still limited.
Europe Stainless Steel-Filled Polymer Filaments Market Trends
Europe is a notable market driven by the need for lightweight components, sustainable material innovation, and precisely engineered prototypes. Adoption of composite and metal-enhanced filaments is accelerated by its advanced manufacturing base. Stable regional growth is still supported by robust design-focused industries and growing 3D printing hubs.
Germany Stainless Steel-Filled Polymer Filaments Market Trends
Germany is experiencing growing use of stainless steel-filled polymer filaments as more industries use sophisticated 3D printing to create components that are strongly resistant to heat and resemble metal. Stable market growth is being supported by a robust adoption of industrial additive manufacturing and continuous investment in engineered materials.
Middle East & Africa Stainless Steel-Filled Polymer Filaments Market Trends
The Middle East & Africa region is an emerging notable market as localized low-volume manufacturing and stainless steel-filled filaments are progressively adopted by industries for robust heat-resistant parts. Growing adoption of 3D printing technologies and growing interest in cutting-edge materials support the market's steady but gradual growth.
UAE Stainless Steel-Filled Polymer Filaments Market Trends
The UAE is witnessing the growing adoption of stainless steel-filled polymer filaments, driven by the growing use of industrial 3D printing in manufacturing aerospace and construction. As the nation makes investments in cutting-edge production technologies and quick prototyping capabilities, the need for robust corrosion-resistant and metal-like composites is growing.
South America is gradually increasing its use of stainless steel-filled polymer filaments as businesses switch to more robust, cost-effective, and heat-resistant materials to replace metal in functional parts and prototypes. The regional market is growing steadily due to the increasing use of industrial 3D printing.
Brazil Stainless Steel-Filled Polymer Filaments Market Trends
Brazil is seeing rising demand for stainless steel-filled polymer filaments, encouraged by the expanding use of additive manufacturing in industrial machinery and automotive repair applications. The need for long-lasting high high-performing materials and the drive for affordable metal-like components are propelling steady market growth.
Recent Developments
- In November 2025, Nanoe announced it will debut new metal and ceramic filaments at Formnext 2025, including 304L stainless steel and Monel filaments (in addition to other UHTC and metal/ceramic offerings). (Source: www.metal-am.com)
- In August 2024, Markforged introduced a new industrial 3D-printer kit enabling metal filament printing (including stainless-steel 316L) on their FX10 printer, expanding availability of metal-filament additive manufacturing on factory floors. This enhancement enables manufacturers to combine metal and composite capabilities in a single platform, supporting hybrid production workflows.(Source: www.manufacturingtodayindia.com)
Top Stainless Steel-Filled Polymer Filaments Market Companies
BASF SE
Corporate Information
BASF SE headquartered in Ludwigshafen, Germany.
- Founded: 6 April 1865
- Business Segments: As of now, BASF organizes its operations into core businesses: Chemicals; Materials;
- Industrial Solutions; Nutrition & Care and standalone / specialized segments: Surface Technologies (which includes divisions like Environmental Catalyst & Metal Solutions, Battery Materials, Coatings) and Agricultural Solutions.
History and Background
- BASF was founded in 1865 by Friedrich Engelhorn in Mannheim, initially to produce chemicals (soda and acids) needed for dye production. Soon after foundation, operations were moved to Ludwigshafen due to concerns over pollution.
- Early operations centered around aniline dyes and basic chemical production, derived from coal tar byproducts.
Key Developments and Strategic Initiatives
The introduction of the strategy framework called “Winning Ways” (announced 2024) under which BASF aims to sharpen portfolio management, improve capital allocation, and promote a performance oriented culture.
Under “Winning Ways”, BASF categorizes businesses into core vs standalone and moves to simplify organization, reduce bureaucracy, and increase accountability at the business unit level.
Mergers & Acquisitions
- In 2024, BASF acquired one of two previously jointly run MDI production plants (with partner companies) from a joint venture with Huntsman Corporation in China (Shanghai Lianheng Isocyanate Co., Ltd). The acquisition included the plant, precursor production (aniline, nitrobenzene), and associated employees. Purchase price: €192 million (cash).
- On April 22, 2024, BASF also acquired 49% of shares in certain wind farm projects (Vattenfall’s Nordlicht 1 and 2) signaling investment in renewable energy / power generation assets.
Partnerships & Collaborations
- BASF has partnered with waste management / recycling firms (e.g. Braven Environmental) to secure recycled feedstock (e.g. “Braven PyChem®” derived from mixed plastic waste) to reduce fossil resource dependence and boost circular economy initiatives.
Product Launches / Innovations
- BASF invests heavily in R&D and innovation: as of 2024, around 10,000 employees globally are dedicated to R&D.
- In 2024, products launched over the preceding five years stemming from BASF research generated ~€11 billion in sales, indicating a strong rate of product renewal and innovation success.
Key Technology Focus Areas
- Sustainable chemistry: Chemicals with reduced or net-zero carbon footprint, renewable feedstocks.
- Battery materials & recycling: BASF has launched a commercial “black mass” plant for lithium ion battery recycling (in Schwarzheide, Germany) one of the largest in Europe targeting processing of end-of-life batteries and scrap.
R&D Organisation & Investment
- R&D is central to BASF’s strategy: around 10,000 staff worldwide in R&D as of 2024.
- R&D spending: approximately €2.13 billion in 2023.
- Output: New products launched in the last five years accounted for ~€11 billion in sales indicating strong conversion of R&D into marketable products.
SWOT Analysis
Strengths
- Massive scale and global presence well diversified across sectors (materials, specialty chemicals, agrochemicals, etc.).
- Strong R&D and innovation capability, with consistent new product pipelines and large R&D investment.
- Strategic pivot toward sustainability, circular economy, renewable feedstocks aligning with global megatrends.
Weaknesses / Challenges
- Exposure to volatile raw material and energy costs; chemical industry is sensitive to global commodity and energy market fluctuations.
- Complexity: Operating in many different business segments; managing such diversity can dilute focus or lead to bureaucratic inefficiency (though “Winning Ways” aims to address this).
Opportunities
- Electrification and energy transition: Battery materials, battery recycling services, sustainable materials supply to EV and energy storage markets.
- Green chemistry and circular economy: Offering low carbon, renewable, recyclable solutions to industries seeking sustainability growing demand globally.
Threats / Risks
- Economic downturns or slowdowns in key downstream sectors (automotive, construction, consumer goods) could reduce demand.
- Continued energy price volatility and regulatory constraints (carbon pricing, environmental regulations) may increase production costs and compress margins.
Recent News & Strategic Updates
- In October 2025, BASF announced construction of a new electronic-grade ammonium hydroxide plant in Ludwigshafen a move to support semiconductor supply chains in Europe.
- Also in 2025, BASF completed startup of a commercial battery recycling “black mass” plant in Schwarzheide, Germany, to process end of-life lithium-ion batteries.
Companies Analysis
- The Virtual Foundry: A US-based innovator known for its "Filamet™" products, focusing on high metal content filaments that allow standard FDM printers to create solid metal objects after sintering.
- ProtoPlant (Proto-pasta): Renowned for specialty filaments, this company offers aesthetic-focused stainless steel PLA that is polishable and magnetic, ideal for artistic and cosplay applications.
- ColorFabb: This Dutch company is a leader in filament innovation, offering quality metal-filled composites like their "SteelFill" for a wide range of global clients.
- Nobufil: Identified as a key player in the market, this company contributes to innovation in metal-filled filament technology.
- Zetamix (by Nanoe): Part of the French company Nanoe, Zetamix specializes in ceramic and metal filaments designed for a complete FFF, debinding, and sintering workflow.
- Fiberlogy: A Polish manufacturer offering a variety of filament types, including metal-filled options, noted for their quality and contribution to market growth.
- Wan Hao 3D: A Chinese company recognized for its role in the competitive market, offering various 3D printing materials, including metal composites.
- Dai-Ichi Ceramo: A Japanese company that manufactures specific, high-quality stainless steel filaments such as CeraFila SUS316L.
- FlashForge: Primarily known as a 3D printer manufacturer, they also produce their own lines of specialized filaments, including metal composites, to support their hardware ecosystem.
Top Companies in Stainless Steel-Filled Polymer Filaments Market

- The Virtual Foundry
- ProtoPlant (Proto-pasta)
- ColorFabb
- Nobufil
- Zetamix
- Fiberlogy
- Wan Hao 3D
- Dai-Ichi Ceramo
- FlashForge
Segments Covered in the Report
By Type
- PLA-Stainless Steel Filament
- ABS-Stainless Steel Filament
- Nylon (PA)
- Other Polymer Matrices
By Application
- Prototyping & Design Models
- Functional Engineering Parts
- Jewelry & Decorative Objects
- Aerospace & Automotive Components
- Consumer Products
- Other Applications
By Region
- North America
- U.S.
- Canada
- Mexico
- Europe
- Germany
- UK
- France
- Italy
- Spain
- Asia Pacific
- China
- India
- Japan
- South Korea
- Latin America
- Brazil
- Argentina
- Middle East & Africa
- Saudi Arabia
- South Africa
A Seven-Phase Framework
Our methodology is designed to be universally applicable across commodity chemicals, specialty chemicals, petrochemicals, construction chemicals, coatings, electronic chemicals, industrial gases, agrochemicals, water treatment chemicals, and performance materials. Each phase builds upon the last, creating a layered validation structure that minimizes estimation error and maximizes analytical confidence.
The framework ensures comprehensive market coverage, robust cross-validation, and reliable long-term forecasting — producing market estimates that withstand scrutiny from investors, regulators, and corporate strategy teams.

Seven-Phase Framework — Analytical Effort Distribution
Relative analytical effort allocated across each phase of the Chemicals & Materials research framework

Phase 1 - Secondary Research: Establishing the Foundation
Secondary research collects and evaluates publicly available information from authoritative sources, establishing the foundational understanding of market structure, value chain dynamics, competitive landscape, and end-use demand patterns. Every source is evaluated for credibility, recency, geographic relevance, and methodological soundness before inclusion.
Industry Associations
Sources include ACC, CEFIC, ICCA, JCIA, CPCIF, and SOCMA providing production volumes, consumption trends, capacity developments, and sustainability initiatives.
Company Disclosures
Annual reports, investor presentations, earnings transcripts, and regulatory filings reveal product portfolios, manufacturing footprints, capacity expansions, and revenue segmentation.
Government Databases
National statistical offices, customs authorities, environmental agencies, and industrial production databases provide verified statistics on output, trade flows, and regulatory compliance.
Trade Databases
UN Comtrade, ITC, Eurostat, and national customs authorities enable assessment of global product movement, import dependency, and export competitiveness across regions.
Our Secondary Research Sources
- Ministry of Chemicals and Fertilizers
- European Chemicals Agency
- United States Department of Energy
- Ministry of Industry and Information Technology
- Ministry of Economy Trade and Industry
- Ministry of Trade Industry and Energy
- National Institute of Standards and Technology
- Council of Scientific and Industrial Research
- Fraunhofer Society
- National Institute for Materials Science
Phase 2 — Supply-Side Assessment: Mapping Production Capabilities
Production Capacity Analysis
All major manufacturers are assessed for existing installed capacity, planned additions, expansions, new plant announcements, and technology adoption — mapped at global, regional, and country levels.
Capacity Utilization Adjustment
Installed capacity is adjusted using utilization rates based on demand conditions, feedstock availability, plant operating rates, maintenance schedules, and regulatory restrictions.
Manufacturer Revenue Analysis
Product-specific revenues, segment-level performance, regional distribution, average selling prices, and margin trends are evaluated to establish market value estimates.
Supply-Side Assessment — Capacity vs. Effective Production by Region
Illustrative comparison of installed capacity vs. effective production volume (after utilization rate adjustment) across major regions

Phase 3 — Demand-Side Assessment: Quantifying Chemical Consumption
Demand-side analysis quantifies chemical consumption across industries, applications, and geographies — identifying where and how chemicals are consumed throughout the value chain with precision.
End-Use Industry Analysis
Chemical demand is evaluated across automotive, construction, packaging, electronics, agriculture, healthcare, consumer goods, industrial manufacturing, energy and utilities, and water treatment. Industry output, production trends, and consumption intensity are analyzed to determine demand patterns.
Consumption Modeling
Demand is estimated using measurable indicators: kilograms per vehicle, kilograms per square meter of construction, dosage per cubic meter of water treated, kilograms per hectare of agricultural land, and kilograms per ton of manufactured products. Consumption factors are validated through industry publications and primary interviews.
Application Analysis
The market is segmented by application area to understand product performance requirements, formulation trends, technology adoption, customer preferences, and regulatory requirements improving demand accuracy and segmentation granularity.
Demand-Side Assessment — End-Use Industry Demand Distribution
Illustrative distribution of chemical & materials demand across key end-use industries

Phase 4 - Trade Flow Analysis: Balancing Regional Supply and Demand
Trade flow analysis reconciles regional supply and demand estimates through import and export data, identifying net supply positions, regional dependencies, and market imbalances. It serves as an independent validation layer that tests the consistency of supply-side and demand-side estimates.
Import Analysis
Import data is evaluated to determine volumes, source countries, product dependency, regional supply gaps, and pricing trends — identifying markets that rely heavily on external supply and where domestic production is insufficient to meet demand.
Export Analysis
Export assessments reveal production surplus, export competitiveness, regional manufacturing strength, and global market participation. Export patterns also help validate domestic production estimates and identify net exporting regions.
Apparent Consumption Model
Regional consumption is assessed using the standard apparent consumption formula:
Results identify net importing regions, net exporting regions, regional deficits, and surpluses — serving as an independent validation of supply and demand estimates.
Trade Flow Analysis — Net Supply Position by Region
Illustrative apparent consumption vs. domestic production across major regions — positive gap indicates net import dependency

Phase 5 — Primary Research: The Critical Validation Layer
Primary research tests and refines findings from secondary research through direct engagement with industry participants across the supply chain, demand side, and expert community. It captures intelligence that no database or published report can provide — the real-world experience of manufacturers, buyers, and specialists operating in the market.

Supply-Side Interviews
Conversations with chemical manufacturers, raw material suppliers, contract manufacturers, technology providers, and plant operators cover production trends, capacity utilization, pricing developments, technology shifts, and competitive dynamics.

Demand-Side Interviews
Engagement with OEMs, industrial consumers, procurement managers, distributors, formulators, and end-use manufacturers focuses on consumption trends, purchasing behavior, product substitution, demand outlook, and emerging applications.

Industry Expert Consultations
Additional interviews with industry consultants, independent experts, regulatory specialists, technical professionals, and research institutions provide deeper market context and validate key analytical assumptions.
Focus Areas of Primary Research:
Market Size & Forecast Validation
Revenue estimates, volume consumption, growth rates, forecast assumptions, regional demand.Supply Chain & Value Chain Assessment
Raw material sourcing, supply chain challenges, distribution networks, procurement practices.Production & Capacity Analysis
Manufacturing capacity, utilization rates, expansion projects, plant investments.Pricing & Cost Structure Analysis
Product pricing trends, feedstock costs, energy costs, margin pressures, pricing outlook.Competitive Landscape Assessment
Volume and value estimates confirmed to be fully consistent with one another before publicationInterview Volume by Market Scope
| Study Scope | Number of Interviews |
|---|---|
| Niche Market | 20 – 30 |
| Mid-Sized Market | 30 – 50 |
| Global Market | 50 – 80 |
| Highly Fragmented Market | 80 – 120 |
Interview Details:
Category : Manufacturers, Suppliers, Distributors, End Users, Experts/Associations
Average Duration : 30–60 Minutes
Interview Mode : Video calls, telephonic interviews, expert consultations
Interview Format : Structured / Semi-Structured questionnaire
Focus Areas of Primary Research:
Market Size & Forecast Validation :
Revenue estimates, volume consumption, growth rates, forecast assumptions, regional demand.
Supply Chain & Value Chain Assessment :
Raw material sourcing, supply chain challenges, distribution networks, procurement practices.
Production & Capacity Analysis :
Manufacturing capacity, utilization rates, expansion projects, plant investments.
Pricing & Cost Structure Analysis :
Product pricing trends, feedstock costs, energy costs, margin pressures, pricing outlook.
Competitive Landscape Assessment :
Market share, competitor positioning, strategic initiatives, partnerships, acquisitions.
Primary Research — Stakeholder Coverage by Category
Distribution of interview respondents across stakeholder categories (% share from PPT data)

Primary Research — Respondent Designation Profile
Seniority breakdown of interview respondents (% share from PPT data)

Primary Research — Geographic Coverage of Interviews
Regional distribution of primary research engagement (% share from PPT data)

Phase 6 — Data Triangulation and Market Validation
No single methodology is relied upon in isolation. Multiple independent estimation approaches are combined and reconciled to ensure consistency, accuracy, and analytical defensibility. Any material deviations between approaches are investigated and adjusted through additional validation cycles.
The final market size is derived through weighted triangulation of all validated methodologies. Any material deviations between approaches are investigated and adjusted through additional validation cycles. The outcome represents the most realistic assessment of the market based on available evidence and expert confirmation ensuring that volume and value estimates are fully consistent with one another.
Triangulation Framework — Input Contribution Weight
Relative weight each sizing input contributes to the final reconciled market estimate

Phase 7 — Forecast Modeling: Projecting Future Market Evolution
Forecasting evaluates the future trajectory of the market using a combination of quantitative indicators and qualitative assessments across economic, industry, and regulatory dimensions. Rather than simple extrapolation, each driver is independently modeled and integrated into a composite forecast.
Macroeconomic Indicators
GDP growth, industrial production, manufacturing output, construction activity, consumer spending, and capital investment form the quantitative foundation of long-term demand projections. These are applied at country, regional, and global levels.
Industry Growth Drivers
Urbanization, infrastructure development, industrialization, technological innovation, sustainability initiatives, and evolving product performance requirements are assessed at regional and industry levels — capturing both structural and cyclical demand drivers.
Capacity Expansion Analysis
Announced plant expansions, new manufacturing facilities, technology upgrades, and strategic investments are evaluated to determine future supply-demand dynamics and potential market tightness or oversupply situations.
Regulatory & Sustainability
Environmental regulations, chemical safety standards, emission reduction targets, circular economy initiatives, and sustainability requirements are incorporated as they often influence product adoption rates and market growth trajectories.
Scenario Forecast Range — Indexed Market Growth (Year 1–10)
Illustrative indexed growth trajectories across Base, Optimistic, and Pessimistic scenarios over a 10-year forecast horizon

Forecast Drivers — Relative Impact Score by Category
Impact score (0–100) of each driver type on chemicals & materials market forecast




Comments
Share your thoughts, ask a question, or provide feedback about this report.