
NPK Fertilizers Market Size, Share, Trends and Forecast 2026 to 2035
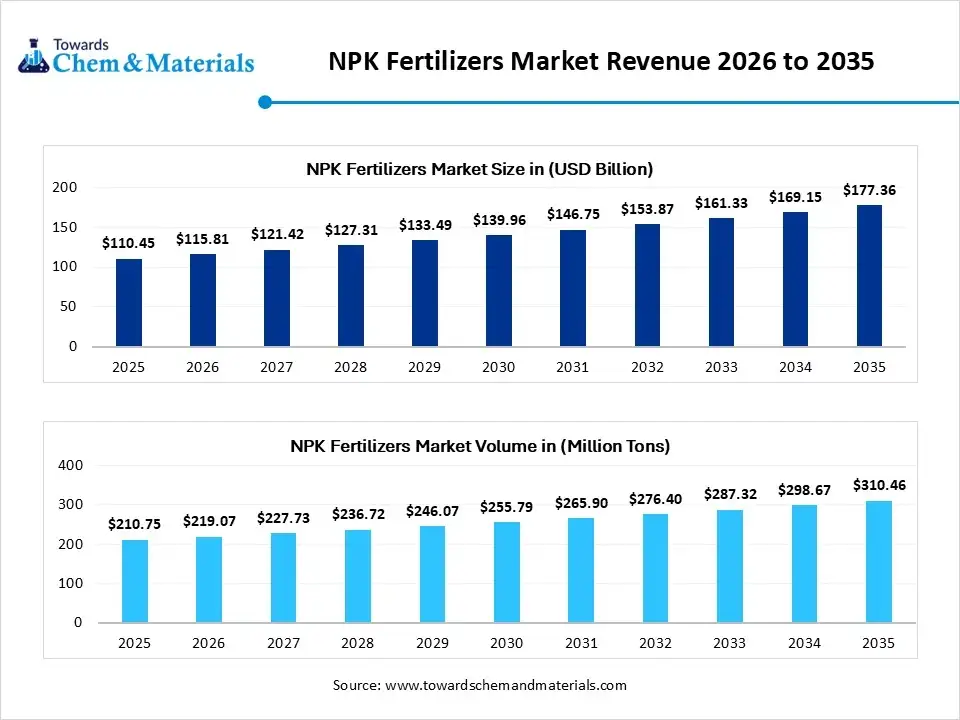
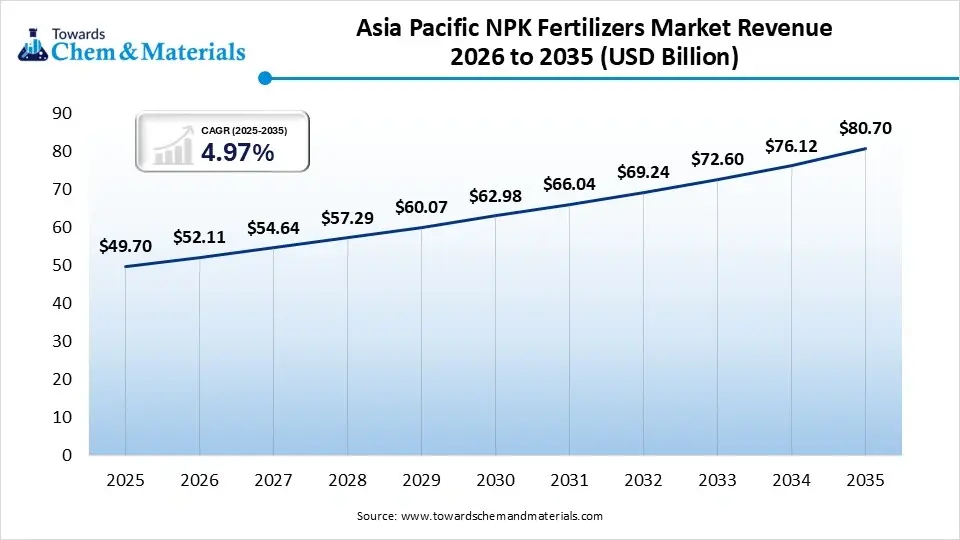
The global NPK fertilizers market size was valued at USD 110.45 billion in 2025 and is projected to grow from USD 115.81 billion in 2026 to USD 177.36 billion by 2035, at a CAGR of 4.85% from 2026 to 2035. Asia Pacific dominated the NPK fertilizers market with the largest revenue share of 45% in 2025 and is expected to grow at the fastest CAGR of 4.97% during the forecast period. In terms of volume, the NPK fertilizers market is projected to grow from 210.75 million tons in 2025 to 310.46 million tons by 2035, growing at a CAGR of 3.95% from 2026 to 2035. Market growth is supported by demand for balanced crop nutrition, higher agricultural productivity, precision agriculture, and fertigation. Nutrient price volatility, raw-material availability, environmental requirements, and fertilizer subsidies also influence market development The major industry players like Nutrien Ltd., The Mosaic Company, and EuroChem Group AG are investing heavily in the expansion of the projects for ultra-concentrated nano-NPK solutions, according to the latest report.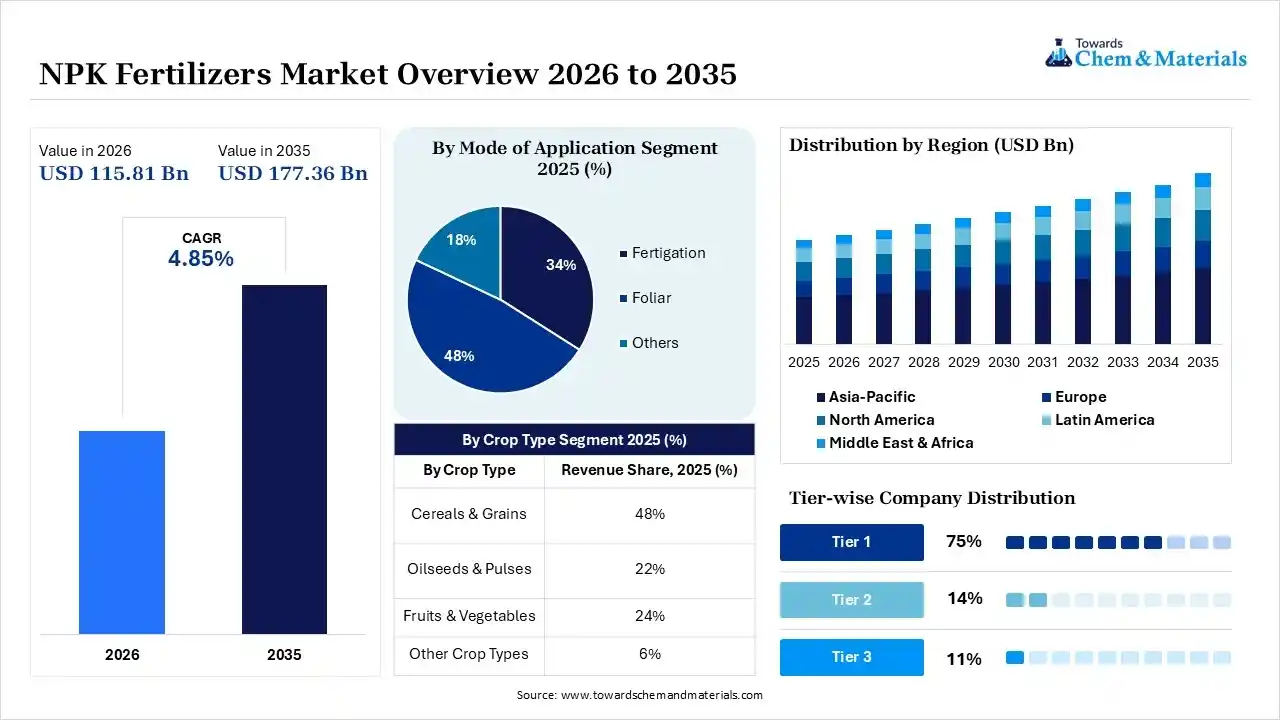
Key Takeaways
- Asia Pacific accounted for 45% of 2025 revenue, supported by its large agricultural base and fertilizer-intensive crop production.
- By region, Europe held 16% market share in 2025 and is expected to experience the fastest growth with a CAGR of 6% in the forecast period. Sustainable farming initiatives encourage balanced nutrition.
- By crop type, the cereals & grains segment dominated the market with 48% share in 2025. Large-scale cultivation drives fertilizer consumption.
- By crop type, the fruits & vegetables segment held 24% market share in 2025 and is expected to have the fastest growth with a CAGR of 6.2% in the forecast period. High-value crops require intensive nutrient management.
- By mode of application, the foliar segment dominated the market with 48% share in 2025. Rapid nutrient absorption enhances crop performance.
- By mode of application, the fertigation segment held 34% market share in 2025 and is expected to have the fastest growth with a CAGR of 6.5% in the forecast period. Expansion of drip irrigation boosts adoption.
- By form type, the dry segment dominated the market with 72% share in 2025. A large agricultural base drives fertilizer consumption.
- By form type, the liquid segment held 28% market share in 2025 and is expected to have the fastest growth with a CAGR of 6.1% in the forecast period. Sustainable farming initiatives encourage balanced nutrition.
Quick Stats at a Glance
- Market in Size (2025): USD 110.45 Billion | CAGR (2026–2035): 4.85%
- Market Estimated Size in 2026: USD 115.81 Billion
- Market Projected Size (2035): USD 177.36 Billion
- Largest regional Market: Asia Pacific (45% revenue share, 2025) CAGR (2026-2035): 5.3%
- Fastest Growing Regional Market: North America (16% revenue share, 2025) CAGR (2026-2035): 6%
- By country: China held the largest market share of 36% in 2025.
- Market in Volume (2025): 210.75 Million Tons | Volume CAGR (2026–2035): 3.95%
- Market Estimated Volume (2026): 219.07 Million Tons
- Market Projected Volume (2035): 219.07 Million Tons
- Market Pricing (2025):
- Average Manufacturing Price: USD 435/Ton
- Average Selling Price: USD 520/Ton
- Pricing CAGR (2026–2035): 2.75%
Country-Level Shares
- United States: 78% of revenue share in 2025
- Germany: 25% of revenue share in 2025
- China: 36% of revenue share in 2025
- Brazil: 54% of revenue share in 2025
- Saudi Arabia: of 22% revenue share in 2025
The NPK fertilizers market plays a vital role in global food security, serving as its backbone. By providing the three key macronutrients, nitrogen (N) for leaf growth, phosphorus (P) for roots and flowers, and potassium (K) for overall plant health, these fertilizers are crucial for boosting crop yields and maintaining soil fertility.
The market's importance stems from its supply of essential nutrients needed for healthy plant development, crop production, and feeding a growing population. As worldwide demand for food rises and available arable land diminishes, NPK fertilizers become increasingly essential for optimizing agricultural productivity. They form the foundation for growing high-demand crops like cereals and grains and are also vital in the expanding horticulture sector and for fruits and vegetables, which need specific nutrient mixtures to enhance size and quality.
- For instance, IFFCA, the world's largest farmer-owned multi-state cooperative society, launched indigenous nano NPK fertilizers, which is an initiative and a great milestone in India towards sustainable and self-reliant farming. (Source: https://www.aninews.in)
Global Investment Flow for NPK Fertilizers Market 2026
- Leading fertilizer producers such as Nutrien, IFFCO, and other global nutrient suppliers are continuing investments in capacity expansion, distribution networks, and advanced fertilizer technologies to meet rising global demand for balanced nutrient products, including NPK fertilizers.
- The Government of India approved a ?41,533.81 crore Nutrient-Based Subsidy (NBS) package for the 2026 Kharif season covering phosphatic and potassic fertilizers, including NPK grades, to ensure fertilizer availability and affordability for farmers.
- Governments across major agricultural economies are increasing support for fertilizer security programs amid volatile global nutrient prices, driving investments in domestic production, storage, and supply-chain infrastructure for NPK and related fertilizers.
- Coromandel International Limited has announced the expansion of the brownfield at its Kakinada plant. The investment aims to build India's largest phosphatic fertilizer complex with an investment of 500 crore. (Source: https://fertilizerfield.com/)
NPK Fertilizers Market Trends and Growth Factors
- Sustainability and Eco Regulations: Stricter environmental policies like the EU’s Carbon Border Adjustment Mechanism are increasing the shift from traditional systems to low-emission bio-based blends, which help in enhancing the efficiency of polymer-coated fertilizers and precision nutrient management.
- Shift to High-Value Crops: Increased demand for fruits and vegetables, as there is an increased demand and a shift towards the adoption of high-value, nutrient-rich crops among farmers and consumers, is a growing trend in the market.
- Controlled-Release Solutions: To comply with stricter environmental rules like emission regulations in the EU, Fertilizer producers are developing and commercializing slow- and controlled-release products to improve nutrient-use efficiency and reduce nutrient losses.
Report Scope
| Report Attributes | Details |
| Market Size and Volume in 2026 | USD 115.81 Billion / 219.07 Million Tons |
| Revenue Forecast in 2035 | USD 177.36 Billion / 310.46 Million Tons |
| Growth Rate | CAGR 4.85% |
| Base Year of Estimation | 2025 |
| Forecast Period | 2025 - 2035 |
| High Impact Region | Asia Pacific |
| Segment Covered | By Crop Type, By Mode of Application, By Form Type, By Region |
| Key Companies Profiled | Other key players in the NPK fertilizers market include OCP Group, CF Industries Holdings, Inc., SQM (Sociedad Química y Minera), Haifa Group, PhosAgro PJSC, Coromandel International Ltd., Indian Farmers Fertiliser Cooperative (IFFCO), K+S Aktiengesellschaft, Rashtriya Chemicals and Fertilizers Ltd. (RCF), Chambal Fertilisers & Chemicals Ltd., Deepak Fertilisers and Petrochemicals Corporation Limited, Gujarat State Fertilizers & Chemicals Ltd. (GSFC), Sinochem Holdings, Acron Group, and UPL Limited. |
AI and Precision Agriculture in the NPK Fertilizers Market
The integration of artificial intelligence is rapidly transitioning the NPK fertilizers market from generic bulk supply toward precision, data-driven nutrient management. This shift optimizes chemical inputs, maximizes crop yields, and reduces environmental harm.Machine-learning systems can combine soil, weather, remote-sensing, and field data to support nutrient recommendations and variable-rate application.
NPK Fertilizers Regulatory Landscape
| Country / Region | Regulatory Body | Key Regulations | Focus Areas | Notable Notes |
| United States | Environmental Protection Agency; United States Department of Agriculture | Federal Insecticide, Fungicide, and Rodenticide Act; State Fertilizer Laws | Nutrient management, environmental protection | The U.S. regulates NPK fertilizer composition, labeling, and application practices to improve agricultural productivity and reduce environmental impact. |
| European Union | European Commission; European Chemicals Agency | EU Fertilising Products Regulation (EU 2019/1009); REACH Regulation | Fertilizer quality, sustainability, nutrient efficiency | Europe promotes sustainable fertilizer use and strict quality standards for NPK products. |
| China | Ministry of Agriculture and Rural Affairs; Ministry of Ecology and Environment | Fertilizer Registration Measures; Environmental Protection Law | Agricultural productivity, nutrient efficiency | China supports balanced fertilizer application and improved nutrient management in agriculture. |
| India | Department of Fertilizers; Fertilizer Control Order | Essential Commodities Act; Fertilizer Control Order (1985) | Fertilizer quality, subsidy programs, and crop productivity | India is one of the largest consumers of NPK fertilizers, supported by extensive agricultural activities and government subsidy schemes. |
| Brazil | Ministry of Agriculture and Livestock | National Fertilizer Plan; Fertilizer Registration Regulations | Crop yield improvement, agricultural expansion | Brazil is increasing NPK fertilizer usage to support large-scale soybean, corn, and sugarcane production. |
| Japan | Ministry of Agriculture, Forestry and Fisheries | Fertilizer Regulation Act | Sustainable agriculture, soil health | Japan emphasizes efficient fertilizer use and environmental sustainability in crop production. |
Supply Chain Analysis of NPK Fertilizers Market:
Fertilizer Production & Blending
- NPK fertilizers are produced by combining nitrogen (N), phosphorus (P), and potassium (K) nutrients through granulation, compaction, or bulk blending processes to provide balanced plant nutrition for crops.
- The compound production chemically fuses elements into single uniform pellets, while blending mechanically mixes distinct granular ingredients like urea, DAP, and MOP to create targeted, site-specific nutrient ratios.
- Key players: Yara International, Nutrien, Mosaic Company, Indian Farmers Fertiliser Cooperative
Quality Testing and Certification
- NPK fertilizers must comply with standards for nutrient composition, granule uniformity, moisture content, contaminant limits, and agricultural safety regulations before commercialization.
Quality testing and certification of NPK fertilizers ensure products deliver precise nutrients, comply with agricultural standards, and protect soil ecosystems.- Applicable fertilizer standards and regulatory authorities vary by market; identify the relevant national fertilizer-registration, quality, labeling, and product-safety authorities for each region
Distribution to Industrial Users
- NPK fertilizers are supplied to agricultural producers, horticulture farms, plantation crops, greenhouse operators, and agricultural cooperatives to improve crop yield and soil fertility.
Distribution of NPK fertilizers to industrial users involves tailored B2B bulk supply chains, as distribution commonly involves manufacturers, wholesalers, retailers, agricultural cooperatives, distributors, and direct farm channels
NPK Fertilizers Market Dynamics
| Drivers | Restraints | Opportunities |
| Growing Demand for High-Value Crops:The increased demand to meet changing dietary habits and export demand drives demand for high-tech and advanced crops, which are specialized and nutrient-specific NPK blends. | Supply Chain Disruptions:Geopolitical tensions and trade restrictions like export limits on urea from major producing nations leave global supply chains highly vulnerable to political risk and supply shortages. | Micronutrient Integration: |
| Technological Advancements in Fertilizer Delivery:Innovation in fertilizers, like slow and controlled release, helps minimize nutrient loss and boosts nutrient use efficiency, driving growth. | Raw Material Price Volatility: Fluctuating global costs for key inputs, specifically natural gas, phosphate rock, and potash, drive up production costs, leading to gross margin pressure for manufacturers and affordability challenges for farmers. | Precision Agriculture & Digital Integration: |
| Supportive Government Policies & Environmental Directives:Government subsidies and policies promoting sustainable agriculture are encouraging the adoption of efficient fertilizers. | Environmental & Regulatory Challenges:Excessive application of nitrogen and phosphorus leads to runoff, causing eutrophication and harmful algal blooms in water bodies. | Specialty & Controlled-Release Solutions: |
Segmental Insights
Crop Type Insights
The Cereals & Grains Segment Dominated the NPK Fertilizers Market With 48% Market Share in 2025
The cereals & grains segment dominated the market with a 48% share in 2025, owing to the existence of a huge cultivation scale as staple cereal production worldwide. Other key factors responsible for dominance are high nutrient demands, government support and subsidies, and innovations in delivery, which are ideal for large-scale production. Government initiatives, including India’s Nutrient Based Subsidy program, support fertilizer availability and affordability.
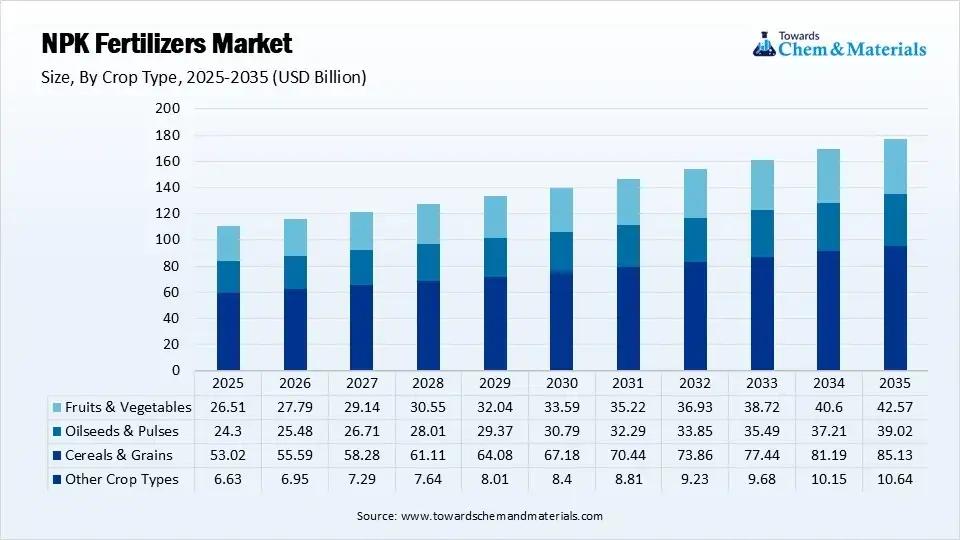 The fruits & vegetables segment held 24% market share in 2025 and is expected to have the fastest growth with a CAGR of 6.2% in the forecast period, driven by a massive global shift toward high-value horticultural crops, shifting dietary habits, and the need for high-quality, export-oriented agricultural produce. The adoption of precision farming and fertigation for advanced and efficient fertilizer technologies further drives the growth and expansion of the market.
NPK Fertilizers Market Share, By Crop Type, 2025 (%)
| By Crop Type | Revenue Share, 2025 (%) |
| Cereals & Grains | 48% |
| Oilseeds & Pulses | 22% |
| Fruits & Vegetables | 24% |
| Other Crop Types | 6% |
Mode of Application Insights
The Foliar Segment Dominated the Market With 48% Market Share in 2025
The foliar segment dominated the market with 48% share in 2025. This growth is propelled by the need to maximize crop yields with faster nutrient uptake, precision agriculture, and the need to address specific nutrient deficiencies quickly. The modernization of crop nutrition has seen widespread integration of AI-driven drones and IoT platforms. Foliar application is the preferred method for high-yield, premium crops where targeted nutrient application directly influences visual quality, shelf life, and marketability.
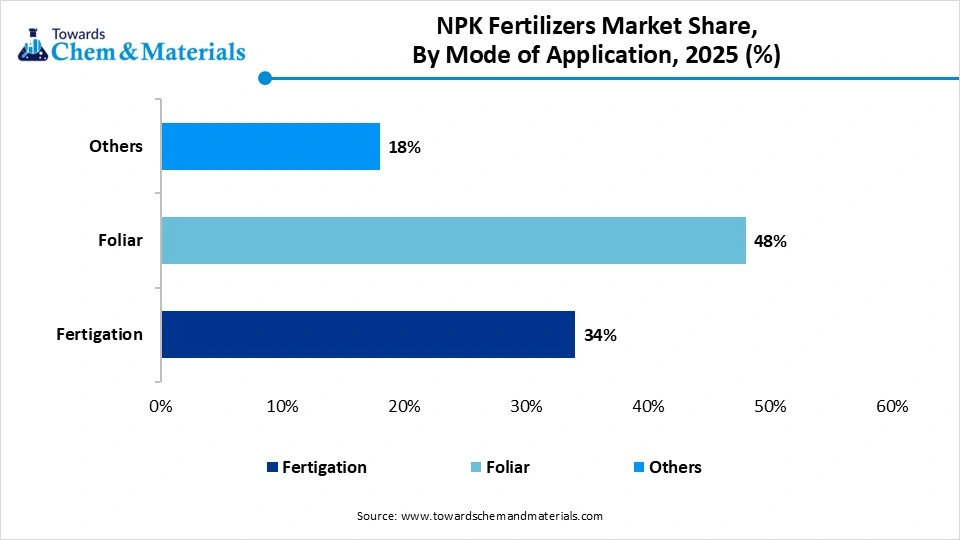 The fertigation segment held a 34% market share in 2025 and is expected to have the fastest growth with a CAGR of 6.5% in the forecast period because it maximizes nutrient use efficiency while reducing both water usage and labor costs. Fertigation delivers dissolved nutrients to the crop root zone through irrigation systems such as drip or sprinkler irrigation.Fertigation fertilizers are formulated to dissolve completely with no residue. AI models assist in determining the optimal chemical structure and solubility for controlled-release granular fertilizers.
NPK Fertilizers Market Share, By Mode of Application, 2025 (%)
| By Mode of Application | Revenue Share, 2025 (%) |
| Fertigation | 34% |
| Foliar | 48% |
| Others | 18% |
Form Type Insights
The Dry Segment Dominated the Market With 72% NPK Fertilizers Market Share in 2025
The dry segment dominated the market with a 72% share in 2025, due to its cost-efficiency, ease of use in large-scale agriculture, and steady, slow-release nutrient profile. Dry NPK fertilizers are cheaper to produce, transport, and store compared to liquids. Their low-moisture content gives them a longer shelf life and prevents spoilage. They are ideal for large, mechanized farming operations and staple crops like cereals and grains. They are easily applied using traditional methods such as broadcasting, top-dressing, and side-dressing.
The liquid segment accounted for 28% of 2025 revenue and benefits from compatibility with fertigation and other precision-application systems.It stands out due to rapid nutrient absorption, seamless integration into precision farming, and perfect compatibility with advanced irrigation systems. Liquid NPKs are easily injected into drip irrigation systems, distributing nutrients directly to the root zone. This reduces fertilizer waste and mitigates water pollution.
NPK Fertilizers Market Share, By Form Type, 2025 (%)
| By Form Type | Revenue Share, 2025 (%) |
| Dry | 72% |
| Liquid | 28% |
Regional Analysis
How did Asia Pacific dominate the NPK fertilizer market in 2025?
Asia Pacific dominated the market in 2025, supported by its large agricultural base, fertilizer consumption, government support, and adoption of modern crop-nutrition practices. Government fertilizer-subsidy programs can reduce farmers’ effective fertilizer costs and support product availability. India's nutrient-based subsidy (NBS) and China's soil fertility enhancement initiatives directly encouraged high-volume NPK adoption and balanced fertilization. These initiatives and growing adoption fuel demand is supported by efforts to improve crop productivity, nutrient-use efficiency, and fertilizer application precision
 India
India
- The Indian government's strategic focus on equalizing subsidies across nutrients has directly reduced the disproportionate dominance of urea. Programs like PM-PRANAM incentivize states to reduce traditional chemical usage and adopt high-efficiency alternatives.
- Micro-Irrigation Expansion: Driven by government schemes like PMKSY (Pradhan Mantri Krishi Sinchayee Yojana), the shift from traditional broadcasting to drip/foliar irrigation is accelerating.
China
- China's strict food security mandates and massive population require high agricultural productivity, driving sustained, high-volume consumption of complex and specialty NPK formulations.
- Central initiatives promoting precision agriculture and sustainable nutrient management have accelerated the adoption of water-soluble NPK fertilizers.
Europe NPK Fertilizers Market Growth Factor
The Europe NPK fertilizers market size was estimated at USD 17.67 billion in 2025 and is projected to reach USD 29.26 billion by 2035, growing at a CAGR of 5.17% from 2026 to 2035. Europe held the market share of 16% in 2025 and is expected to have fastest growth, growing with a CAGR of 6% in the forecast period, driven by strict environmental regulations like the EU Green Deal, the need to optimize crop yields with limited arable land, and the surging popularity of specialty and water-soluble fertilizers. Directives like the EU's "Farm to Fork" strategy seek to reduce overall chemical fertilizer use. This drives rapid adoption of precision agriculture, controlled-release fertilizers, and organo-mineral fertilizers that minimize nutrient runoff.
Germany
- Stringent European environmental regulations and German climate targets act as a major catalyst.
- There is a high demand for innovative, low-carbon fertilizer blends and phosphate-recovery technologies that ensure high soil fertility without polluting local waterways
Italy
- Italian farmers are rapidly adopting smart, data-driven farming. Technologies like fertigation, applying water-soluble NPK directly through irrigation systems, allow for precise nutrient distribution, reducing waste by up to 25%.
- Manufacturers are highly investing in research and development to produce efficient, eco-friendly fertilizers. Innovations in fertilizer composition ensure that maximum nutrients are absorbed by plants without exceeding chemical limits.
North America NPK Fertilizers Market Growth Factors
The North America NPK fertilizers market size was estimated at USD 19.88 billion in 2025 and is projected to reach USD 32.81 billion by 2035, growing at a CAGR of 5.14% from 2026 to 2035. North America held the market share of 18% in 2025, driven by highly intensive commercial farming, the necessity to maximize crop yields, and the rapid adoption of precision agriculture technologies. The integration of variable-rate nutrient platforms and cost-share initiatives, which reimburse U.S. and Canadian growers up to 50 percent for precision nutrient expenses, allows for highly targeted, site-specific NPK application. The U.S. and Canada house massive agricultural sectors, driving growth
U.S.
- The market in the U.S. is expanding as producers adopt enhanced-efficiency formulations, respond to stricter environmental regulations, and shift toward specialty crops to maximize yields. This evolution is driven by modern precision agriculture technologies and sustainable farming practices.
- Stricter environmental policies, such as the Great Lakes runoff regulations, cap traditional fertilizer application rates. This pushes farmers to switch to controlled-release, polymer-coated, and complex fertilizers, driving up market value.
Canada
- Canadian farmers are increasingly adopting variable-rate technology and smart application methods.
- The development of advanced controlled-release and water-soluble NPK formulations is a major catalyst, as they minimize nutrient runoff and maximize crop uptake.
- Stringent federal and provincial sustainability mandates drive demand for eco-friendly fertilizers.
- Technologies such as polymer-coated NPKs prevent nutrient leaching and reduce environmental pollution, aligning with agricultural sustainability targets.
Latin America NPK Fertilizers Market Growth Factors
The Latin America NPK fertilizers market size was estimated at USD 14.36 billion in 2025 and is projected to reach USD 23.94 billion by 2035, growing at a CAGR of 5.24% from 2026 to 2035. Latin America held the market share of 13% in 2025. Growth is fueled by the region's massive export-oriented agriculture, the surging adoption of precision farming, and the widespread necessity to maximize yields for cash crops like soybeans, corn, and sugarcane. Farmers in the region are increasingly shifting toward complex NPK and specialized straight products to save labor and reduce application errors. By applying tailored multi-nutrient blends, growers save an estimated 30–40% in labor costs.
Brazil
- Programs like Brazil's Plano Safra provide tens of billions of dollars in subsidized rural credit to farmers.
- This lowers financing costs, ensuring growers can consistently purchase essential agricultural inputs even when global fertilizer prices experience volatility.
- Brazil is a global powerhouse for soybeans, corn, sugarcane, and coffee. These crops are highly nutrient-intensive, requiring consistent macronutrient application to maximize yields. This continuous commercial cultivation establishes a strong baseline of demand for NPK complexes.
Argentina
- Argentina's massive production of cash crops like soybeans, maize, and wheat requires heavy nutrient replenishment to maintain soil health and scale up yields.
- The development of nitrogen complexes in strategic hubs like Bahía Blanca is designed to exploit local Vaca Muerta natural gas, reducing reliance on expensive imports.
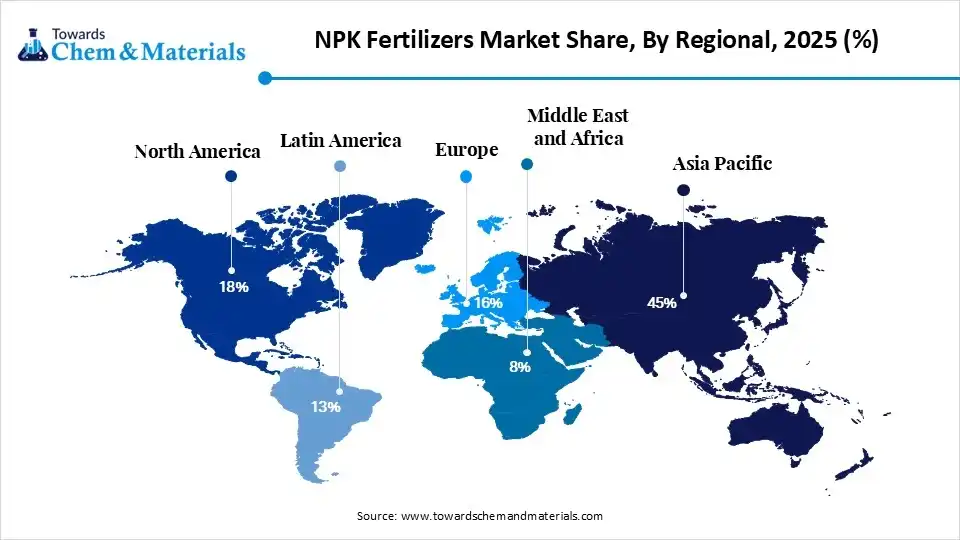
NPK Fertilizers Market Share, By Regional, 2025 (%)
| Regional | Revenue Share, 2025 (%) |
| Asia-Pacific | 45% |
| North America | 18% |
| Europe | 16% |
| Latin America | 13% |
| Middle East & Africa | 8% |
Middle East and Africa NPK Fertilizers Market Growth Factor
The Middle East and Africa NPK fertilizers market size was estimated at USD 8.84 billion in 2025 and is projected to reach USD 15.08 billion by 2035, growing at a CAGR of 5.49% from 2026 to 2035. The Middle East and Africa held the market share of 8% in 2025, driven by regional food security initiatives, investments in arid-land irrigation, and the adoption of precision agriculture. Governments in countries like Saudi Arabia, Morocco, and Egypt are aggressively scaling domestic food production to offset import reliance. Major investments in low-carbon nitrogen and phosphate production (particularly in Morocco and Egypt) are lowering supply-chain costs and ensuring raw material availability across the region.
 Saudi Arabia
- Saudi Arabia has established phosphate and natural-gas resources that support its fertilizer-production base, which serve as essential raw materials for fertilizer production. This grants domestic manufacturers such as SABIC and Ma'aden a distinct production cost advantage.
- Mandatory standards like the Executive Regulations for Fertilizers and Soil Conditioners by the Saudi Food and Drug Authority are fueling demand for eco-friendly, slow-release specialty fertilizers.
UAE
- The UAE NPK fertilizers market is primarily driven by government-led food security initiatives, the expansion of protected agriculture (hydroponics/greenhouses), and rising demands for water-saving fertigation techniques.
- The harsh desert climate also fuels the need for custom-formulated NPK blends to improve soil health and stress resilience.
Competitive Analysis
Competitive advantage is increasingly driven by raw material access, agronomic expertise, precision agriculture solutions, strong dealer networks, and the ability to provide high-performance crop nutrition products
- Major players in the NPK fertilizers market include Nutrien, Yara International, ICL Group, The Mosaic Company, and EuroChem, which compete through extensive production capacity, product portfolios, and global distribution networks.
- To secure long-term fertilizer security, Indian state-owned firms, including Rashtriya Chemicals and Fertilizers Limited (RCF), National Fertilizers Limited (NFL), and India Potash Limited (IPL), partnered with Russian giant Uralchem Group by signing a memorandum. A 50-50 joint venture to construct a massive 2 million tonnes/year urea plant in Russia.(Source: https://www.uralchem.com/)
- Companies are focusing on customized NPK formulations designed for specific crops, soil conditions, and regional agricultural requirements to improve nutrient efficiency and crop yields.
Market Top Players Are
| Company | Company Type/Position | Major Headquarters | Geographic Presence | NPK Fertilizer Offerings |
| Nutrien Ltd. | The world's leading crop input and fertilizer producer. | Saskatoon | North America, South America, Asia Pacific, Europe | Granular NPK fertilizers, customized crop nutrition blends, specialty plant nutrition products |
| Yara International ASA | Global crop nutrition solutions provider | Oslo | Europe, Asia Pacific, Africa, North America, Latin America | Compound NPK fertilizers, specialty fertilizers, precision nutrition products |
| The Mosaic Company | Leading producer of phosphate and potash-based fertilizers | Tampa | North America, South America, Asia Pacific | NPK blends, phosphate-based fertilizers, crop nutrient products |
| ICL Group Ltd. | Global specialty fertilizer and minerals supplier | Tel Aviv | Europe, Asia Pacific, North America, Latin America | Water-soluble NPK fertilizers, controlled-release fertilizers, specialty nutrition products |
| EuroChem Group AG | Vertically integrated fertilizer manufacturer | Zug | Europe, Asia Pacific, Latin America, Africa | Granular NPK fertilizers, customized nutrient blends, premium crop nutrition products |
Recent Developments
- In June 2026, BTU and BINFIELD launched industrial production of Microbial-Coated NPK Fertilizer by using microbial coating technology, where the fertilizer is added in the production stage.(Source: https://www.agribusinessglobal.com/)
- In May 2026, Meghmani Organics Limited, a fully integrated diversified chemical company, announced the launch of Nano DAP, Nano NPK, and Nano Zinc fertilizers production by receiving approval from the Ministry of Agriculture and Farmers Welfare.(Source: https://agrospectrumindia.com/)
- In March 2026, ICL Ltd. opened a new production plant for specialty fertilizers in Maharashtra. This launch aims to reduce reliance on the import of fertilizers by increasing domestic production. (Source:https://www.indexbox.io)
Market Top Players Are
- OCP Group (Morocco)
- CF Industries Holdings, Inc. (USA)
- SQM (Sociedad Química y Minera) (Chile)
- Haifa Group (Israel)
- PhosAgro PJSC (Russia)
- Coromandel International Ltd. (India)
- Indian Farmers Fertiliser Cooperative (IFFCO) (India)
- K+S Aktiengesellschaft (Germany)
- Rashtriya Chemicals and Fertilizers Ltd (RCF) (India)
- Chambal Fertilisers & Chemicals Ltd (India)
- Deepak Fertilisers And Petrochemicals Corporation Limited (India)
- Gujarat State Fertilizers & Chemicals Ltd (GSFC) (India)
- Sinochem Holdings (China)
- Acron Group (Russia)
- UPL Limited (India)
Segments Covered
By Crop Type
- Cereals & Grains
- Wheat
- Rice
- Maize
- Barley
- Oilseeds & Pulses
- Soybean
- Canola
- Groundnut
- Lentils & Peas
- Fruits & Vegetables
- Fruits
- Vegetables
- Plantation Crops
- Other Crop Types
- Turf & Ornamental
- Fiber Crops
- Commercial Crops
By Mode of Application
- Fertigation
- Drip Fertigation
- Sprinkler Fertigation
- Foliar
- Liquid Foliar Sprays
- Water-Soluble Foliar Fertilizers
- Others
- Broadcasting
- Band Placement
- Side Dressing
By Form Type
- Dry
- Granular
- Powder
- Prilled
- Liquid
- Suspension
- Solution
By Regions
- North America
- U.S.
- Canada
- Mexico
- Rest of North America
- Latin America
- Brazil
- Argentina
- Rest of Latin America
- Europe
- Western Europe
- Germany
- Italy
- France
- Netherlands
- Spain
- Portugal
- Belgium
- Ireland
- UK
- Iceland
- Switzerland
- Poland
- Rest of Western Europe
- Eastern Europe
- Austria
- Russia & Belarus
- Türkiye
- Albania
- Rest of Eastern Europe
- Asia Pacific
- China
- Taiwan
- India
- Japan
- Australia and New Zealand,
- ASEAN Countries (Singapore, Malaysia)
- South Korea
- Rest of APAC
- MEA
- GCC Countries
- Saudi Arabia
- United Arab Emirates (UAE)
- Qatar
- Kuwait
- Oman
- Bahrain
- South Africa
- Egypt
- Rest of MEA
A Seven-Phase Framework
Our methodology is designed to be universally applicable across commodity chemicals, specialty chemicals, petrochemicals, construction chemicals, coatings, electronic chemicals, industrial gases, agrochemicals, water treatment chemicals, and performance materials. Each phase builds upon the last, creating a layered validation structure that minimizes estimation error and maximizes analytical confidence.
The framework ensures comprehensive market coverage, robust cross-validation, and reliable long-term forecasting — producing market estimates that withstand scrutiny from investors, regulators, and corporate strategy teams.

Seven-Phase Framework — Analytical Effort Distribution
Relative analytical effort allocated across each phase of the Chemicals & Materials research framework

Phase 1 - Secondary Research: Establishing the Foundation
Secondary research collects and evaluates publicly available information from authoritative sources, establishing the foundational understanding of market structure, value chain dynamics, competitive landscape, and end-use demand patterns. Every source is evaluated for credibility, recency, geographic relevance, and methodological soundness before inclusion.
Industry Associations
Sources include ACC, CEFIC, ICCA, JCIA, CPCIF, and SOCMA providing production volumes, consumption trends, capacity developments, and sustainability initiatives.
Company Disclosures
Annual reports, investor presentations, earnings transcripts, and regulatory filings reveal product portfolios, manufacturing footprints, capacity expansions, and revenue segmentation.
Government Databases
National statistical offices, customs authorities, environmental agencies, and industrial production databases provide verified statistics on output, trade flows, and regulatory compliance.
Trade Databases
UN Comtrade, ITC, Eurostat, and national customs authorities enable assessment of global product movement, import dependency, and export competitiveness across regions.
Our Secondary Research Sources
- Ministry of Chemicals and Fertilizers
- European Chemicals Agency
- United States Department of Energy
- Ministry of Industry and Information Technology
- Ministry of Economy Trade and Industry
- Ministry of Trade Industry and Energy
- National Institute of Standards and Technology
- Council of Scientific and Industrial Research
- Fraunhofer Society
- National Institute for Materials Science
Phase 2 — Supply-Side Assessment: Mapping Production Capabilities
Production Capacity Analysis
All major manufacturers are assessed for existing installed capacity, planned additions, expansions, new plant announcements, and technology adoption — mapped at global, regional, and country levels.
Capacity Utilization Adjustment
Installed capacity is adjusted using utilization rates based on demand conditions, feedstock availability, plant operating rates, maintenance schedules, and regulatory restrictions.
Manufacturer Revenue Analysis
Product-specific revenues, segment-level performance, regional distribution, average selling prices, and margin trends are evaluated to establish market value estimates.
Supply-Side Assessment — Capacity vs. Effective Production by Region
Illustrative comparison of installed capacity vs. effective production volume (after utilization rate adjustment) across major regions

Phase 3 — Demand-Side Assessment: Quantifying Chemical Consumption
Demand-side analysis quantifies chemical consumption across industries, applications, and geographies — identifying where and how chemicals are consumed throughout the value chain with precision.
End-Use Industry Analysis
Chemical demand is evaluated across automotive, construction, packaging, electronics, agriculture, healthcare, consumer goods, industrial manufacturing, energy and utilities, and water treatment. Industry output, production trends, and consumption intensity are analyzed to determine demand patterns.
Consumption Modeling
Demand is estimated using measurable indicators: kilograms per vehicle, kilograms per square meter of construction, dosage per cubic meter of water treated, kilograms per hectare of agricultural land, and kilograms per ton of manufactured products. Consumption factors are validated through industry publications and primary interviews.
Application Analysis
The market is segmented by application area to understand product performance requirements, formulation trends, technology adoption, customer preferences, and regulatory requirements improving demand accuracy and segmentation granularity.
Demand-Side Assessment — End-Use Industry Demand Distribution
Illustrative distribution of chemical & materials demand across key end-use industries

Phase 4 - Trade Flow Analysis: Balancing Regional Supply and Demand
Trade flow analysis reconciles regional supply and demand estimates through import and export data, identifying net supply positions, regional dependencies, and market imbalances. It serves as an independent validation layer that tests the consistency of supply-side and demand-side estimates.
Import Analysis
Import data is evaluated to determine volumes, source countries, product dependency, regional supply gaps, and pricing trends — identifying markets that rely heavily on external supply and where domestic production is insufficient to meet demand.
Export Analysis
Export assessments reveal production surplus, export competitiveness, regional manufacturing strength, and global market participation. Export patterns also help validate domestic production estimates and identify net exporting regions.
Apparent Consumption Model
Regional consumption is assessed using the standard apparent consumption formula:
Results identify net importing regions, net exporting regions, regional deficits, and surpluses — serving as an independent validation of supply and demand estimates.
Trade Flow Analysis — Net Supply Position by Region
Illustrative apparent consumption vs. domestic production across major regions — positive gap indicates net import dependency

Phase 5 — Primary Research: The Critical Validation Layer
Primary research tests and refines findings from secondary research through direct engagement with industry participants across the supply chain, demand side, and expert community. It captures intelligence that no database or published report can provide — the real-world experience of manufacturers, buyers, and specialists operating in the market.

Supply-Side Interviews
Conversations with chemical manufacturers, raw material suppliers, contract manufacturers, technology providers, and plant operators cover production trends, capacity utilization, pricing developments, technology shifts, and competitive dynamics.

Demand-Side Interviews
Engagement with OEMs, industrial consumers, procurement managers, distributors, formulators, and end-use manufacturers focuses on consumption trends, purchasing behavior, product substitution, demand outlook, and emerging applications.

Industry Expert Consultations
Additional interviews with industry consultants, independent experts, regulatory specialists, technical professionals, and research institutions provide deeper market context and validate key analytical assumptions.
Focus Areas of Primary Research:
Market Size & Forecast Validation
Revenue estimates, volume consumption, growth rates, forecast assumptions, regional demand.Supply Chain & Value Chain Assessment
Raw material sourcing, supply chain challenges, distribution networks, procurement practices.Production & Capacity Analysis
Manufacturing capacity, utilization rates, expansion projects, plant investments.Pricing & Cost Structure Analysis
Product pricing trends, feedstock costs, energy costs, margin pressures, pricing outlook.Competitive Landscape Assessment
Volume and value estimates confirmed to be fully consistent with one another before publicationInterview Volume by Market Scope
| Study Scope | Number of Interviews |
|---|---|
| Niche Market | 20 – 30 |
| Mid-Sized Market | 30 – 50 |
| Global Market | 50 – 80 |
| Highly Fragmented Market | 80 – 120 |
Interview Details:
Category : Manufacturers, Suppliers, Distributors, End Users, Experts/Associations
Average Duration : 30–60 Minutes
Interview Mode : Video calls, telephonic interviews, expert consultations
Interview Format : Structured / Semi-Structured questionnaire
Focus Areas of Primary Research:
Market Size & Forecast Validation :
Revenue estimates, volume consumption, growth rates, forecast assumptions, regional demand.
Supply Chain & Value Chain Assessment :
Raw material sourcing, supply chain challenges, distribution networks, procurement practices.
Production & Capacity Analysis :
Manufacturing capacity, utilization rates, expansion projects, plant investments.
Pricing & Cost Structure Analysis :
Product pricing trends, feedstock costs, energy costs, margin pressures, pricing outlook.
Competitive Landscape Assessment :
Market share, competitor positioning, strategic initiatives, partnerships, acquisitions.
Primary Research — Stakeholder Coverage by Category
Distribution of interview respondents across stakeholder categories (% share from PPT data)

Primary Research — Respondent Designation Profile
Seniority breakdown of interview respondents (% share from PPT data)

Primary Research — Geographic Coverage of Interviews
Regional distribution of primary research engagement (% share from PPT data)

Phase 6 — Data Triangulation and Market Validation
No single methodology is relied upon in isolation. Multiple independent estimation approaches are combined and reconciled to ensure consistency, accuracy, and analytical defensibility. Any material deviations between approaches are investigated and adjusted through additional validation cycles.
The final market size is derived through weighted triangulation of all validated methodologies. Any material deviations between approaches are investigated and adjusted through additional validation cycles. The outcome represents the most realistic assessment of the market based on available evidence and expert confirmation ensuring that volume and value estimates are fully consistent with one another.
Triangulation Framework — Input Contribution Weight
Relative weight each sizing input contributes to the final reconciled market estimate

Phase 7 — Forecast Modeling: Projecting Future Market Evolution
Forecasting evaluates the future trajectory of the market using a combination of quantitative indicators and qualitative assessments across economic, industry, and regulatory dimensions. Rather than simple extrapolation, each driver is independently modeled and integrated into a composite forecast.
Macroeconomic Indicators
GDP growth, industrial production, manufacturing output, construction activity, consumer spending, and capital investment form the quantitative foundation of long-term demand projections. These are applied at country, regional, and global levels.
Industry Growth Drivers
Urbanization, infrastructure development, industrialization, technological innovation, sustainability initiatives, and evolving product performance requirements are assessed at regional and industry levels — capturing both structural and cyclical demand drivers.
Capacity Expansion Analysis
Announced plant expansions, new manufacturing facilities, technology upgrades, and strategic investments are evaluated to determine future supply-demand dynamics and potential market tightness or oversupply situations.
Regulatory & Sustainability
Environmental regulations, chemical safety standards, emission reduction targets, circular economy initiatives, and sustainability requirements are incorporated as they often influence product adoption rates and market growth trajectories.
Scenario Forecast Range — Indexed Market Growth (Year 1–10)
Illustrative indexed growth trajectories across Base, Optimistic, and Pessimistic scenarios over a 10-year forecast horizon

Forecast Drivers — Relative Impact Score by Category
Impact score (0–100) of each driver type on chemicals & materials market forecast




Comments
Share your thoughts, ask a question, or provide feedback about this report.