
Piezoelectric Materials Market Size Analysis Report 2035
According to Videsh Swar Research, which specializes in research on smart materials and specialty chemicals, the growing advancements in material and formulation of production with advanced technologies help in greater adoption. The recent developments and launch of new products through organizations like automotive electrification and energy harvesting innovation help in market expansion in the coming decades and help in the growth of the piezoelectric materials market across the globe. The global piezoelectric materials market size was estimated at USD 2.84 billion in 2025 and is predicted to increase from USD 3.06 billion in 2026 to approximately USD 5.91 billion by 2035 and is expected to grow at a CAGR of 7.6% during 2025-2035.
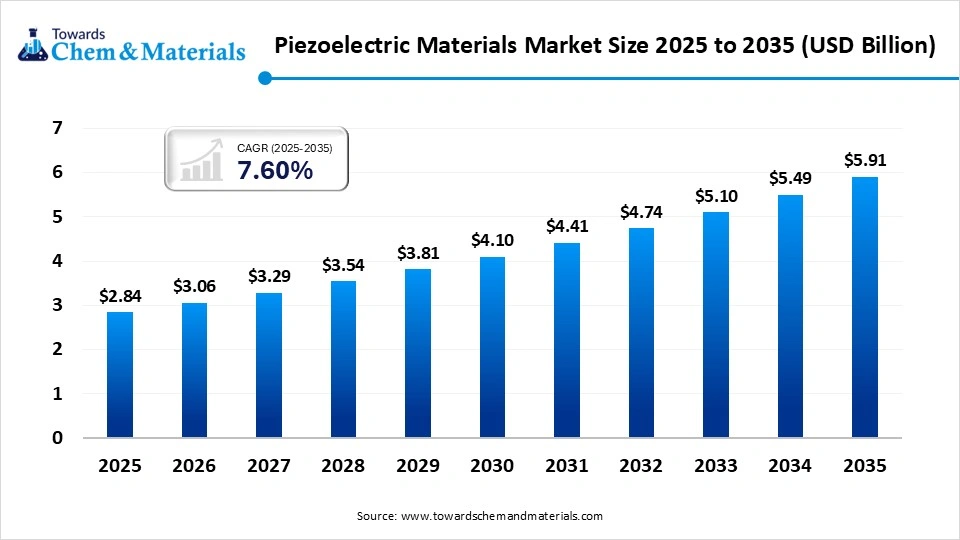
The growing demand for flexible, lightweight, and energy-efficient alternatives, particularly for sensors, wearables, and medical devices. Growing investments by local and governmental bodies for a shift towards advanced and automated systems demand smart and efficient materials, like increased adoption of EVs. The key players, who are major material manufacturing companies, help in the supply of advanced and efficient materials, like Arkema, Solvay, Daikin Industries, and Kureha Corporation, and play a major role in the growth of the market.
Market Highlights
- By region, Asia Pacific dominated the piezoelectric materials market with a share of 46% in 2025 and is expected to grow at a CAGR of 7.30% over the forecast period.
- By region, North America held a 21% market share in the piezoelectric materials market in 2025 and is expected to experience the fastest growth with a CAGR of 8.20% in the forecast period.
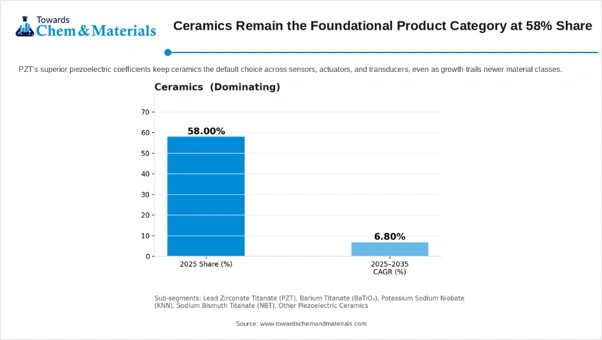
- By product, the ceramics segment dominated the market with a 58% share in 2025 and is expected to grow at a CAGR of 6.80% over the forecast period.
- By product, the composites segment held a 19% market share in 2025 and is expected to have the fastest growth with a CAGR of 9.80% in the forecast period.
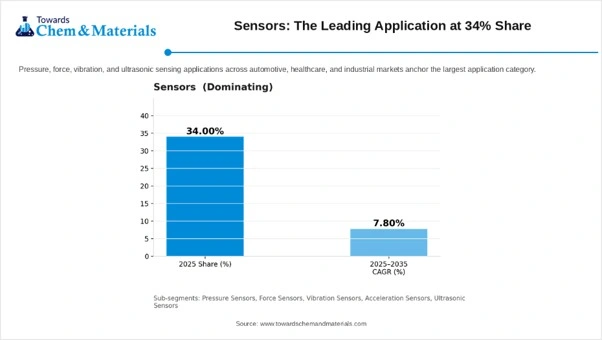
- By application, the sensors segment dominated the market with a 34% share in 2025 and is expected to grow at a CAGR of 7.80% over the forecast period.
- By application, the generators segment held a 7% market share in 2025 and is expected to have the fastest growth with a CAGR of 10.40% in the forecast period.
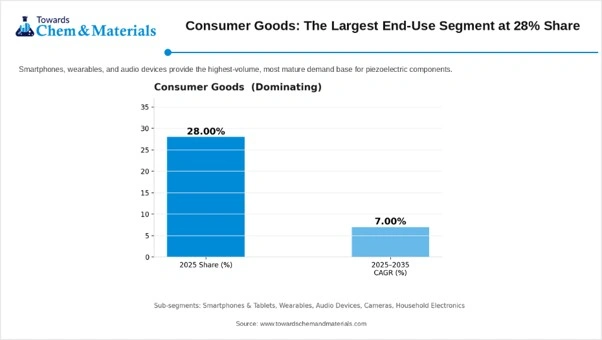
- By end use, the consumer goods segment dominated the market with a 28% share in 2025 and is expected to grow at a CAGR of 7% over the forecast period.
- By end use, the automotive segment held a 22% market share in 2025 and is expected to have the fastest growth with a CAGR of 9% in the forecast period.
Piezoelectric Materials Market Overview
According to my research, the piezoelectric materials market is projected to expand from USD 2.84 billion in 2025 to approximately USD 5.91 billion by 2035. The market is experiencing growth driven by growing demand for lightweight and flexible materials for sensors, actuators, and wearables, especially for medical devices, where there is a need for sensitive screens and materials that demand the market. The materials' superior mechanical flexibility, chemical resistance, and ease of processing are in demand due to rapid urbanization, and the demand for smart infrastructure from consumers drives the growth of the market, including in the forecast period.
- Key Insight: The piezoelectric materials market is a mature and steadily expanding category at USD 2.84 billion in 2025
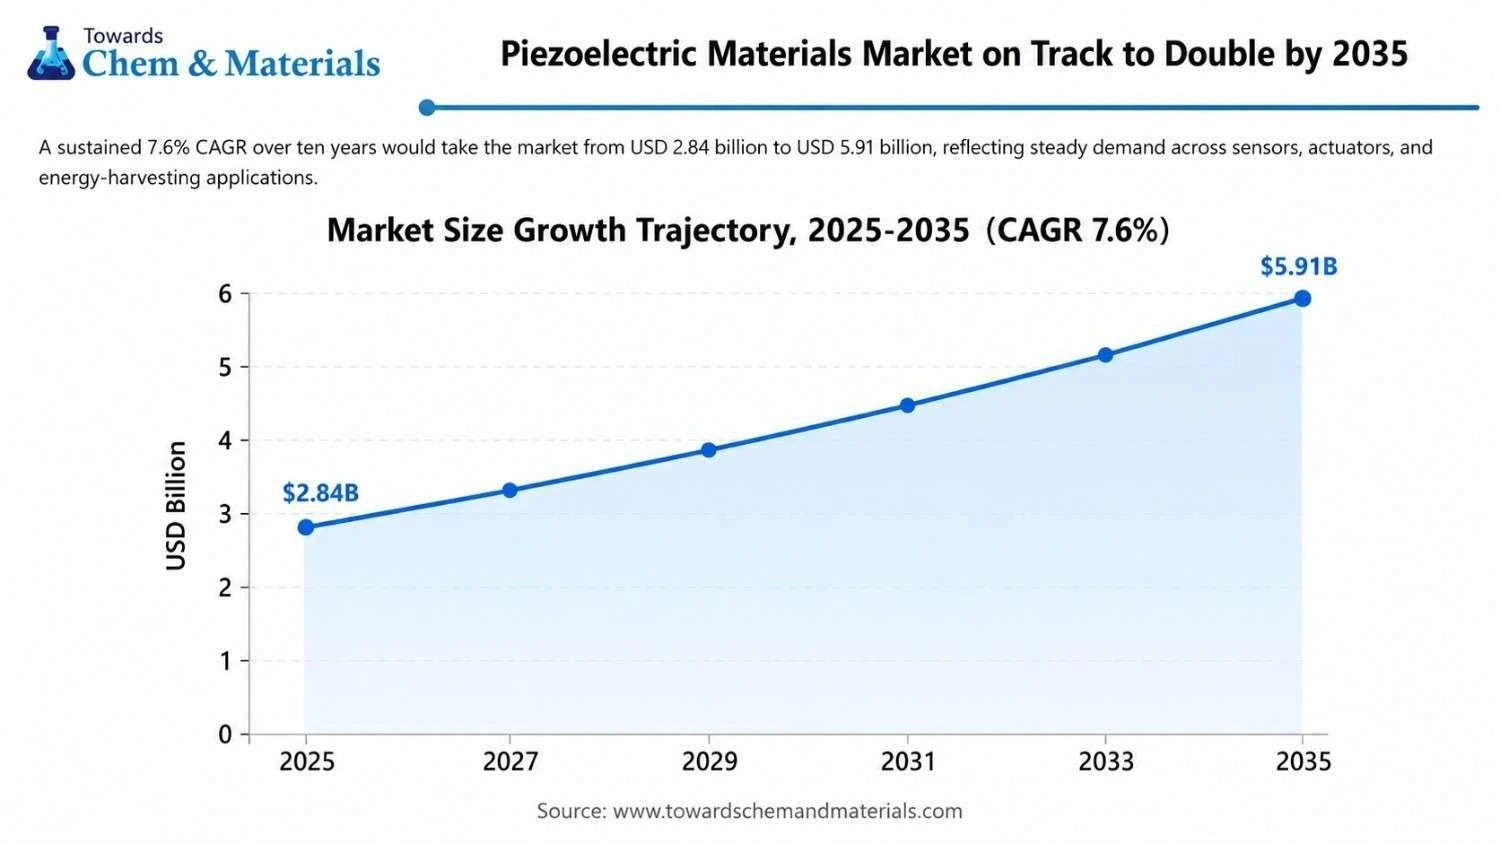
According to my research, the piezoelectric materials market is experiencing growth, compounding at 7.6% CAGR over ten years. This is due to growing demand and consistent supply over the forecast period of time. The rapid expansion of EVs and demand for sensor and monitoring systems for automotive and consumer electronics fuel the growth. The advanced film processing and efficient material demand for various regions increase supply and production, supporting growth continuously through the years.
- Key Insight: The piezoelectric materials market is expected to grow consistently over the forecast period to USD 5.91 billion in 2035.
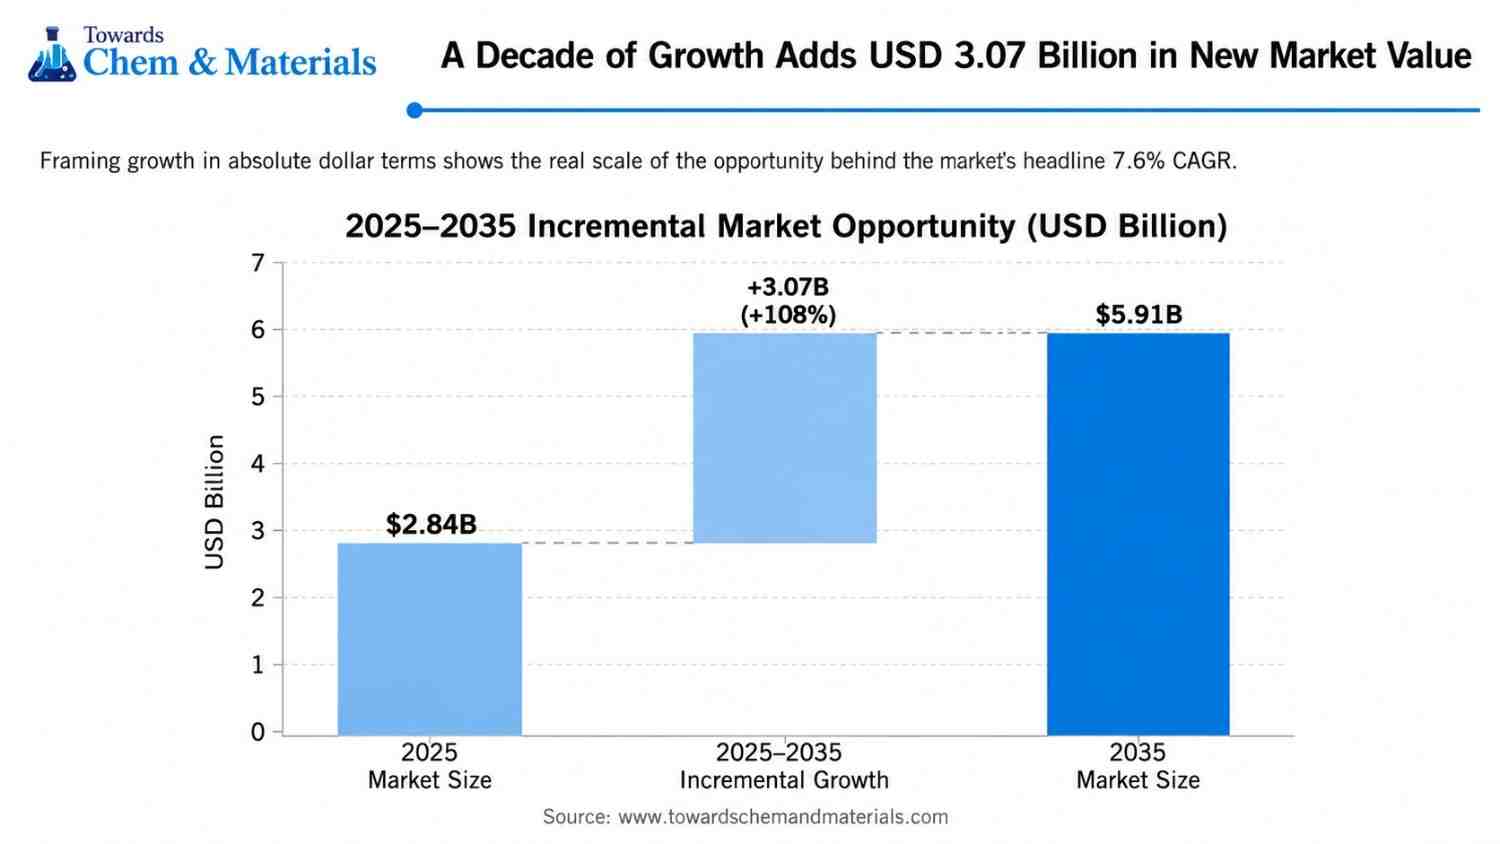 According to my research, the market is valued at USD 2.84 billion in 2025 and is projected to reach USD 5.91 billion by 2035. This represents an additional market opportunity of USD 3.07 billion, meaning the market will more than double over the decade. The growth is supported by increasing use of piezoelectric materials in sensors, actuators, and emerging energy-harvesting applications, where they convert mechanical energy into electrical energy or vice versa. Overall, the chart highlights that the market is expected to add USD 3.07 billion in new value, reflecting strong long-term expansion.
- Key Insight: The market is set to more than double (+108%) over the decade, adding roughly USD 3.07 billion.
According to my research, this image explains the EU regulatory timeline for the use of lead-containing PZT (lead zirconate titanate) ceramics in piezoelectric applications under the RoHS Directive. The key point is that the EU has continued the lead exemption for certain PZT ceramic applications, giving manufacturers additional time before the exemption expires.
- Key Insight: Regulators concluded that no cost-effective lead-free substitute yet matches PZTs performance for the applications covered, giving ceramic producers
Piezoelectric Materials Market Regional Analysis
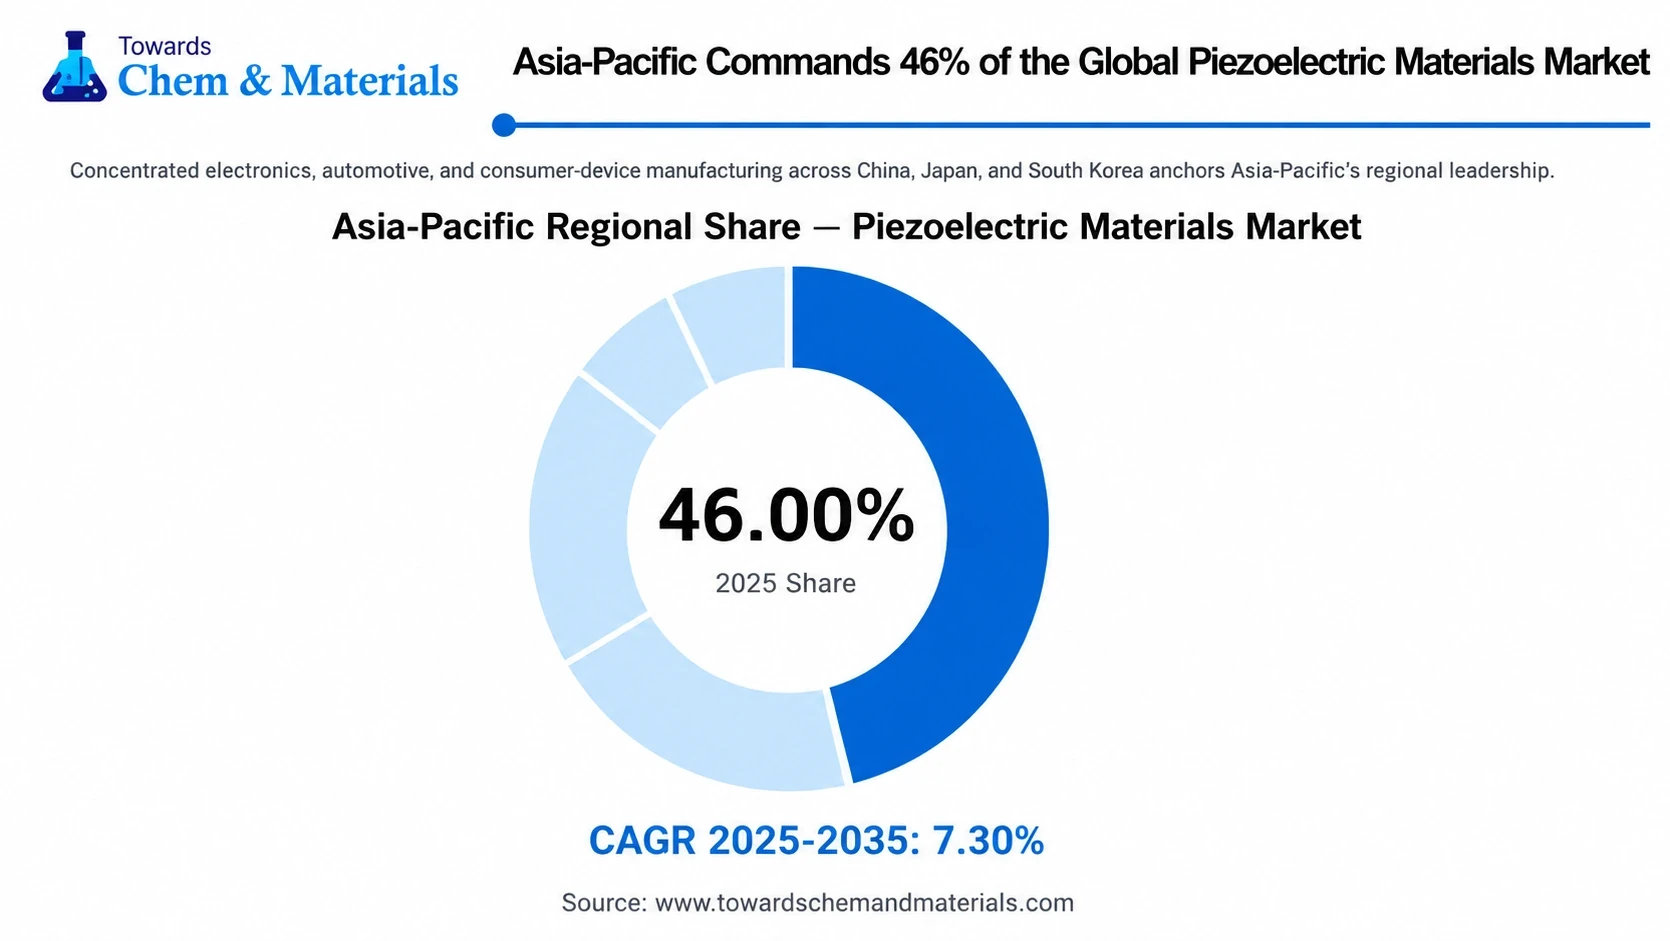
Asia-Pacific Commands 46% of the Global Piezoelectric Materials Market
Asia Pacific dominated the piezoelectric materials market with a share of 46% in 2025 and is expected to grow at a CAGR of 7.30% over the forecast period, driven by rapid urbanization and a leading hub for electronics and automotive components, which fuels market growth of the market. Increased consumer demand and adoption of smart devices, along with high demand for flexible, lightweight, and energy-efficient materials, is fueled by the growing demand for sensors and actuators, which fuels the dominance. The presence of innovators and manufacturers in the region provides a strong localized supply chain for advanced materials, further supporting the growth and expansion of the market. India’s advancements in piezoelectric materials are driven by research institution breakthroughs and domestic manufacturing growth rather than a single commercial product launch. For instance, researchers from the Centre for Nano and Soft Matter Sciences and CSIR-National Chemical Laboratory developed a high-performance piezoelectric polymer nanocomposite using zirconia nanoparticles embedded in PVDF for pressure sensing and energy harvesting.
- Key Insight: Concentrated electronics, automotive, and consumer-device manufacturing across China, Japan, and South Korea anchors Asia-Pacific's regional dominance.
North America Piezoelectric Materials Market Trends Analysis
North America held a 21% market share in the piezoelectric materials market in 2025 and is expected to experience the fastest growth, with a CAGR of 8.20% in the forecast period, driven by growing sectors like healthcare, consumer electronics, and aerospace due to demand for flexible, lightweight, and efficient materials supporting the growth of the market. Rising investment in research and development of smart and advanced sensors in North America. The regions shifting towards eco-friendly and energy-efficient solutions for powering small devices are experiencing growth in the region. In the US, the market is experiencing growth driven by the expansion of industries and recent innovations in formulations that are designed in alignment with evolving environmental standards, which supports the growth of the market in the country. For instance, component manufacturers like CTS Corporation have expanded domestic offerings with specialized lead-free piezoceramic formulations designed to comply with evolving environmental standards without sacrificing performance.
- Key Insight: Expanding ADAS, defense electronics, and medical device manufacturing are driving North America
Europe Piezoelectric Materials Market Trends Analysis
Europe held a 21% market share in the piezoelectric materials market, driven by increased demand for materials from various sectors due to the presence of a manufacturing base, and the adoption of electric vehicles supports further growth of the market. The shift towards environmental regulations and promotion of lead-free materials, along with increased adoption of wearable electronics and energy harvesting sensors, fuels the growth in the region. Innovation through advanced processing and reducing production costs helps further growth in the market in the region. In the UK, the demand for high-efficiency and hybrid material bases, which are used heavily in future wearable technology like smart clothing, fitness tracking, and medical implants, further propels the growth of the market. For instance, companies and institutions like Queen Mary University of London and spin-outs like Ionix Advanced Technologies continuously develop specialized high-temperature and low-lead piezoceramics for extreme industrial environments. Germany is a major hub for advanced research and development of devices and automotive electronics.
- Key Insight: Germany's automotive supply chain and precision-instrument manufacturing base sustain Europe's position as the second-largest regional market.
The Middle East and Africa hold a 7% share of the global piezoelectric materials market.
The Middle East and Africa held a 21% market share in the piezoelectric materials market. Driven by the rising demand for medical imaging devices, flexible wearable health monitors, and IoT infrastructure development, which fuels the growth of the market in the region. Expanding manufacturing facilities and adoption of precision sensors and actuators for rising vehicle electrification and advanced driver assistance systems fuel the growth in the region. In Saudi Arabia, the market growth represents the ongoing expansion and integration of advanced piezoelectric materials and components by the support of major global providers and local industrial automation initiatives supporting growth. For instance, global and regional suppliers such as APC International, Physik Instrumente, and CeramTec have been scaling up specialized actuator production, customized robotics integrations, and medical device optimization tailored to the Saudi market.
- Key Insight: Gradual industrialization and expanding defense and infrastructure-monitoring applications support a small but steadily growing regional market.
Latin America Holds 6% Share of the Global Piezoelectric Materials Market.
Latin America held a 21% market share in the piezoelectric materials market. Driven by industrial automation demand and automotive applications, wich supports the growth of the market. Rising lead adoption and integration of piezoelectric sensors and actuators into fuel injection systems support the growth and expansion of the market in the region. The Brazil market is expanding rapidly due to smart infrastructure expansion and smart road initiatives, which support growth. For instance, Global manufacturers like TDK Corporation and CeramTec have recently introduced eco-friendly, lead-free piezoelectric ceramic lines and MEMS-focused material options tailored for the Brazilian industrial and medical sectors. In Argentina, the market is experiencing growth driven by the presence of technological hubs and industrial transformation initiatives, as well as local adoption in automotive, medical, and industrial automation, supporting growth of the market. For instance, Argentina acts as an emerging technology hub within South America, supported by industrial investments and digital transformation initiatives.
- Key Insight: Limited electronics manufacturing capacity keeps Latin Americas piezoelectric materials market the smallest of the five regions
Piezoelectric Materials Market Segmental Analysis
By Product
The ceramics segment dominated the market with a 58% share in 2025 and is expected to grow at a CAGR of 6.80% over the forecast period. The widespread adoption of lead zirconate titanate in components like sensors, transducers, and actuators, due to growing demand from major sectors, drives growth of the market. Its high sensitivity, superior performance, cost-efficiency, and versatility, facilitated by doping to create tailored, high-output materials, cemented its dominant position in electronics and automotive applications, further fueling the growth of the market.
- Key Insight: PZTs superior piezoelectric coefficients keep ceramics the default choice across sensors, actuators, and transducers
The composites segment held a 19% market share in 2025 and is expected to have the fastest growth with a CAGR of 9.80% in the forecast period, driven by the growing demand for specific applications and as they adapt better to complex mechanical loads and shapes. They offer lower acoustic impedance closer to human tissue and water, making them ideal for high-performance medical ultrasound and underwater acoustics, which supports the growth.
- Key Insight: Ceramic-polymer composites combine high piezoelectric response with mechanical flexibility
By Application
The sensors segment dominated the market with a 34% share in 2025 and is expected to grow at a CAGR of 7.80% over the forecast period, driven by increased demand from sectors like aerospace, fuel preservation, and satellite control, along with increased consumption of sensors from consumer electronics, healthcare, and automotive, which fuels the growth of the market. The growing use and need for advanced sensors and energy harvesting for self-powered devices and IoT system experiences significant growth in the market. The rising adoption and demand for precision sensors underpin the rapid growth of sensors in the piezoelectric materials market.
- Key Insight: Pressure, force, vibration, and ultrasonic sensing applications across automotive, healthcare, and industrial markets anchor the largest application category.
The generators segment held a 7% market share in 2025 and is expected to have the fastest growth with a CAGR of 10.40% in the forecast period, driven by rising demand for energy harvesting systems, wireless electronic devices, and low-power IoT infrastructure. These generators convert ambient vibrational and mechanical stress energy into usable electrical current via direct piezoelectric effects, which further boosts growth and supports expansion.
- Key Insight: Self-powered energy harvesting from ambient vibration is moving from research demonstrations to real infrastructure and IoT deployments.
By End Use
The consumer goods segment dominated the market with a 28% share in 2025 and is expected to grow at a CAGR of 7% over the forecast period, driven by increased demand for smart and lightweight materials, which are extensively used because of their properties in various devices like wearables, IoT devices, and smartphones, which demand flexible materials supporting growth of the market. These materials are used for a smart user experience, providing the highest volume, and increasing the demand base for piezoelectric materials. The growing investment in energy harvesting applications for self-powered and advanced devices, due to rapid urbanization and increased consumer electronics demand, further supports the growth and expansion of the market.
- Key Insight: The demand for consumer electronics and wearables results in the growth of the market.
The automotive segment held a 22% market share in 2025 and is expected to have the fastest growth, with a CAGR of 9% in the forecast period. The growing demand for advanced sensors, fuel injection actuators, and electric vehicle battery management system increasing adoption and helping automotive growth. The shift towards electrification, smart, energy-efficient, and lightweight materials in the automotive industry results in market growth. The increased demand for sensor devices and broader automotive piezoelectric devices further propels the growth of the market, supporting expansion.
- Key Insight: The growing demand for electrification results in automation growth.
Recent Developments
- In January 2026, Toray Industries announced the developed a heat-resistant piezoelectric polymer capable of operating above 200°C, offering high design flexibility and large-area mounting for vibration detection in mobility, robotics, and aerospace.(Source: www.toray.com)
- In May 2025, Northwestern University scientists developed "megalibraries" capable of screening over 1million distinct material samples in under 30 minutes, representing a significant advancement in AI-driven, intentional material engineering. This technique outpaces traditional self-driving labs by enabling the rapid, simultaneous synthesis of nanoparticles to create targeted materials like piezoelectrics within hours.
(Source: phys.org) - In March 2026, BULe Photonics introduced the world’s first submarine hydrophone sensor using third-generation piezoelectric single-crystal technology at Oceanology International 2026 (Oi26). This innovative acoustic sensor marks a significant leap in underwater detection. With the superior qualities of third-generation single-crystal materials, it offers 9 dB higher sensitivity than traditional ceramic PZT hydrophones. This boost in performance allows for increased detection ranges and more precise signal processing, especially in challenging and noisy underwater conditions.(Source: oceannews.com)
- In February 2026, Fujifilm Dimatix, Inc., which is a leading producer of piezoelectric materials, announced the launch of the new Dimatix Material Printer DMP-2850 S (DMP-2850 S).(Source: www.inkworldmagazine.com)
- In May 2025, SIMicroelectronics announced a new phase expansion of its lab and fab projects in collaboration with Singapore’s A*STAR Institute of Materials Research and Engineering (A*STAR IMRE) and the National University of Singapore (NUS). The aim is to advance Piezoelectric MEMS technology.(Source: newsroom.st.com)
Top players in the Piezoelectric Materials Market & Their Offerings
Murata Manufacturing Co., Ltd. : Its headquarters is located in Nagaokakyo, Kyoto Prefecture, Japan. The company is a Global leader in electronic components, including piezoelectric ceramics, sensors, buzzers, and filters, serving automotive, consumer electronics, industrial, and communications markets. It is a global leader in miniaturized piezoelectric ceramics for consumer electronics, automotive, and IoT applications, rolling out multilayer PZT micro actuators for smartphone camera auto-focus and surgical micro robotics applications.
TDK Corporation : Its headquarters is located in Tokyo, Japan; its core business revolves around Diversified electronic components manufacturer producing piezoelectric ceramics, multilayer devices, sensors, and energy solutions for automotive, medical, and industrial markets. It leverages material-science expertise to improve electromechanical performance and miniaturization of piezoelectric products, rolling out sub-millimeter multilayer PZT actuators alongside Murata and PI Ceramic for healthcare, optics, and consumer electronics applications.
CeramTec GmbH : Its headquarters is located in Plochingen, Germany; they are a developer and manufacturer of technical and advanced ceramics, including piezoelectric ceramic components, serving industrial, medical, and defense sonar applications. Owned by BC Partners. Expanding manufacturing hubs in the UK and Germany to support large-scale sonar-grade ceramics production, citing precision control and long-term reliability requirements for extreme-depth sonar applications.
Physik Instrumente (PI) GmbH & Co. KG : Its headquarters are located in Karlsruhe, Germany; it is a specialist manufacturer of precision piezoelectric actuators, motion-control systems, and nano-positioning equipment for semiconductor, life-science, and photonics applications. Named among the leading global players in the piezoelectric ceramics and actuator market by multiple independent research firms, developing multilayer PZT actuators for sub-millimetre precision applications alongside Murata and TDK.
Kyocera Corporation : Its headquarters is located in Kyoto, Japan. Its core business Diversified manufacturer of fine ceramics and electronic components, including piezoelectric ceramic materials for sensors, actuators, and industrial applications. A leading manufacturer of fine ceramics with deep expertise in ceramic materials and advanced manufacturing processes, enabling reliable and precise piezoelectric ceramic components for demanding industrial requirements.
APC International, Ltd. : Its headquarters is located in Mackeyville, Pennsylvania, USA. Manufacturer of piezoelectric ceramic materials and components, including custom piezoelectric ceramic formulations for sensors, actuators, and transducers. Named among the leading global piezoelectric ceramics manufacturers in independent industry research; specializes in custom ceramic formulations for specialized sensor and transducer applications.
- CTS Corporation (U.S.)
- Kistler Group (Switzerland)
- Morgan Advanced Materials (UK)
- Meggitt PLC / Parker Hannifin (UK / U.S.)
- APC International, Ltd. (U.S.)
- L3Harris Technologies, Inc. (U.S.)
- Arkema / Piezotech S.A.S. (France)
- Piezo Systems, Inc. (U.S.)
- Piezosystem Jena GmbH (Germany)
- Piezomechanik Dr. Lutz Pickelmann GmbH (Germany)
- Sparkler Ceramics Pvt. Ltd. (India)
- Piezo Kinetics, Inc. (U.S.)
- TE Connectivity (Switzerland)
- KEMET Corporation (Yageo Group) (U.S.)
- NGK Insulators Ltd. (Japan)
Expert insight
According to my research and assessment, the market is shifting towards automation, electrification, and advanced systems for management, which demand high-performance materials, driving growth of the market. Increased production of sensor systems and advanced EV adoption has increased competitiveness among consumers and suppliers and is a major factor in forecast growth.
Our Experts
Videsh Swar led the research based on primary market research, analysis, and optimization of market trends, segmental and regional trends, methodology, growth opportunities, competitive analysis, volume and market growth, pricing and manufacturing analysis, and optimizing product performance for the forecast period.
Aman is responsible for providing and analysing company insights, regulations, statistical analysis and optimization, partnership and collaboration between companies, and the quantitative data that helps in strengthening market expansion.
Aditi reviewed the entire research document, performed quality checks, validated findings, refined content, corrected inconsistencies, and finalized the report to ensure accuracy, clarity, credibility, and readiness for publication.
Piezoelectric Materials Market Segmentation Listing
By Product
- Ceramics
- Lead Zirconate Titanate (PZT)
- Barium Titanate (BaTiO₃)
- Potassium Sodium Niobate (KNN)
- Sodium Bismuth Titanate (NBT)
- Other Piezoelectric Ceramics
- Polymers
- Polyvinylidene Fluoride (PVDF)
- PVDF-TrFE Copolymers
- Other Piezoelectric Polymers
- Composites
- Ceramic-Polymer Composites
- Ceramic-Ceramic Composites
- Other Piezoelectric Composites
- Others
- Quartz
- Piezoelectric Single Crystals
- Lead-Free Single-Crystal Materials
- Other Piezoelectric Materials
By Application
- Actuators
- Precision Motion Actuators
- Micro-Positioning Actuators
- Vibration-Control Actuators
- Haptic Actuators
- Sensors
- Pressure Sensors
- Force Sensors
- Vibration Sensors
- Acceleration Sensors
- Ultrasonic Sensors
- Motors
- Ultrasonic Motors
- Piezoelectric Micromotors
- Precision Motion Motors
- Acoustic Devices
- Buzzers
- Speakers
- Acoustic Transmitters
- Acoustic Receivers
- Generators
- Energy-Harvesting Generators
- Vibration Energy Generators
- Micro-Power Generators
- SONAR
- Underwater Detection
- Navigation SONAR
- Subsea Imaging
- Transducers
- Ultrasonic Transducers
- Medical Imaging Transducers
- Industrial NDT Transducers
- Electroacoustic Transducers
- Others
- Igniters
- Resonators
- Filters
- Piezoelectric Transformers
By End-use
- Automotive
- Engine Management
- Fuel Injection
- Parking & Proximity Sensing
- Tire & Vehicle Monitoring
- ADAS Components
- Healthcare
- Ultrasound Imaging
- Surgical Instruments
- Therapeutic Devices
- Diagnostic Sensors
- Wearable Medical Devices
- Information & Telecom
- RF Filters
- Timing Components
- Communication Sensors
- Acoustic Components
- IoT Devices
- Consumer Goods
- Smartphones & Tablets
- Wearables
- Audio Devices
- Cameras
- Household Electronics
- Aerospace & Defense
- Aircraft Structural Monitoring
- Sonar Systems
- Guidance & Navigation
- Vibration Monitoring
- Defense Sensors
- Others
- Industrial Automation
- Energy & Power
- Manufacturing Equipment
- Robotics
- Infrastructure Monitoring
By Regions
- North America
- Europe
- Asia Pacific
- Middle East & Africa
- Latin America
References used:
Source: Towards Chemical and Materials
Piezoelectric Materials Market dataset as provided: 2025 market size, 2025–2035 CAGR, 2035 market size, and segmentation shares/CAGRs by Product, Application, End-use, and Region. No volume, manufacturing price, or selling price data was supplied.
A Seven-Phase Framework
Our methodology is designed to be universally applicable across commodity chemicals, specialty chemicals, petrochemicals, construction chemicals, coatings, electronic chemicals, industrial gases, agrochemicals, water treatment chemicals, and performance materials. Each phase builds upon the last, creating a layered validation structure that minimizes estimation error and maximizes analytical confidence.
The framework ensures comprehensive market coverage, robust cross-validation, and reliable long-term forecasting — producing market estimates that withstand scrutiny from investors, regulators, and corporate strategy teams.

Seven-Phase Framework — Analytical Effort Distribution
Relative analytical effort allocated across each phase of the Chemicals & Materials research framework

Phase 1 - Secondary Research: Establishing the Foundation
Secondary research collects and evaluates publicly available information from authoritative sources, establishing the foundational understanding of market structure, value chain dynamics, competitive landscape, and end-use demand patterns. Every source is evaluated for credibility, recency, geographic relevance, and methodological soundness before inclusion.
Industry Associations
Sources include ACC, CEFIC, ICCA, JCIA, CPCIF, and SOCMA providing production volumes, consumption trends, capacity developments, and sustainability initiatives.
Company Disclosures
Annual reports, investor presentations, earnings transcripts, and regulatory filings reveal product portfolios, manufacturing footprints, capacity expansions, and revenue segmentation.
Government Databases
National statistical offices, customs authorities, environmental agencies, and industrial production databases provide verified statistics on output, trade flows, and regulatory compliance.
Trade Databases
UN Comtrade, ITC, Eurostat, and national customs authorities enable assessment of global product movement, import dependency, and export competitiveness across regions.
Our Secondary Research Sources
- Ministry of Chemicals and Fertilizers
- European Chemicals Agency
- United States Department of Energy
- Ministry of Industry and Information Technology
- Ministry of Economy Trade and Industry
- Ministry of Trade Industry and Energy
- National Institute of Standards and Technology
- Council of Scientific and Industrial Research
- Fraunhofer Society
- National Institute for Materials Science
Phase 2 — Supply-Side Assessment: Mapping Production Capabilities
Production Capacity Analysis
All major manufacturers are assessed for existing installed capacity, planned additions, expansions, new plant announcements, and technology adoption — mapped at global, regional, and country levels.
Capacity Utilization Adjustment
Installed capacity is adjusted using utilization rates based on demand conditions, feedstock availability, plant operating rates, maintenance schedules, and regulatory restrictions.
Manufacturer Revenue Analysis
Product-specific revenues, segment-level performance, regional distribution, average selling prices, and margin trends are evaluated to establish market value estimates.
Supply-Side Assessment — Capacity vs. Effective Production by Region
Illustrative comparison of installed capacity vs. effective production volume (after utilization rate adjustment) across major regions

Phase 3 — Demand-Side Assessment: Quantifying Chemical Consumption
Demand-side analysis quantifies chemical consumption across industries, applications, and geographies — identifying where and how chemicals are consumed throughout the value chain with precision.
End-Use Industry Analysis
Chemical demand is evaluated across automotive, construction, packaging, electronics, agriculture, healthcare, consumer goods, industrial manufacturing, energy and utilities, and water treatment. Industry output, production trends, and consumption intensity are analyzed to determine demand patterns.
Consumption Modeling
Demand is estimated using measurable indicators: kilograms per vehicle, kilograms per square meter of construction, dosage per cubic meter of water treated, kilograms per hectare of agricultural land, and kilograms per ton of manufactured products. Consumption factors are validated through industry publications and primary interviews.
Application Analysis
The market is segmented by application area to understand product performance requirements, formulation trends, technology adoption, customer preferences, and regulatory requirements improving demand accuracy and segmentation granularity.
Demand-Side Assessment — End-Use Industry Demand Distribution
Illustrative distribution of chemical & materials demand across key end-use industries

Phase 4 - Trade Flow Analysis: Balancing Regional Supply and Demand
Trade flow analysis reconciles regional supply and demand estimates through import and export data, identifying net supply positions, regional dependencies, and market imbalances. It serves as an independent validation layer that tests the consistency of supply-side and demand-side estimates.
Import Analysis
Import data is evaluated to determine volumes, source countries, product dependency, regional supply gaps, and pricing trends — identifying markets that rely heavily on external supply and where domestic production is insufficient to meet demand.
Export Analysis
Export assessments reveal production surplus, export competitiveness, regional manufacturing strength, and global market participation. Export patterns also help validate domestic production estimates and identify net exporting regions.
Apparent Consumption Model
Regional consumption is assessed using the standard apparent consumption formula:
Results identify net importing regions, net exporting regions, regional deficits, and surpluses — serving as an independent validation of supply and demand estimates.
Trade Flow Analysis — Net Supply Position by Region
Illustrative apparent consumption vs. domestic production across major regions — positive gap indicates net import dependency

Phase 5 — Primary Research: The Critical Validation Layer
Primary research tests and refines findings from secondary research through direct engagement with industry participants across the supply chain, demand side, and expert community. It captures intelligence that no database or published report can provide — the real-world experience of manufacturers, buyers, and specialists operating in the market.

Supply-Side Interviews
Conversations with chemical manufacturers, raw material suppliers, contract manufacturers, technology providers, and plant operators cover production trends, capacity utilization, pricing developments, technology shifts, and competitive dynamics.

Demand-Side Interviews
Engagement with OEMs, industrial consumers, procurement managers, distributors, formulators, and end-use manufacturers focuses on consumption trends, purchasing behavior, product substitution, demand outlook, and emerging applications.

Industry Expert Consultations
Additional interviews with industry consultants, independent experts, regulatory specialists, technical professionals, and research institutions provide deeper market context and validate key analytical assumptions.
Focus Areas of Primary Research:
Market Size & Forecast Validation
Revenue estimates, volume consumption, growth rates, forecast assumptions, regional demand.Supply Chain & Value Chain Assessment
Raw material sourcing, supply chain challenges, distribution networks, procurement practices.Production & Capacity Analysis
Manufacturing capacity, utilization rates, expansion projects, plant investments.Pricing & Cost Structure Analysis
Product pricing trends, feedstock costs, energy costs, margin pressures, pricing outlook.Competitive Landscape Assessment
Volume and value estimates confirmed to be fully consistent with one another before publicationInterview Volume by Market Scope
| Study Scope | Number of Interviews |
|---|---|
| Niche Market | 20 – 30 |
| Mid-Sized Market | 30 – 50 |
| Global Market | 50 – 80 |
| Highly Fragmented Market | 80 – 120 |
Interview Details:
Category : Manufacturers, Suppliers, Distributors, End Users, Experts/Associations
Average Duration : 30–60 Minutes
Interview Mode : Video calls, telephonic interviews, expert consultations
Interview Format : Structured / Semi-Structured questionnaire
Focus Areas of Primary Research:
Market Size & Forecast Validation :
Revenue estimates, volume consumption, growth rates, forecast assumptions, regional demand.
Supply Chain & Value Chain Assessment :
Raw material sourcing, supply chain challenges, distribution networks, procurement practices.
Production & Capacity Analysis :
Manufacturing capacity, utilization rates, expansion projects, plant investments.
Pricing & Cost Structure Analysis :
Product pricing trends, feedstock costs, energy costs, margin pressures, pricing outlook.
Competitive Landscape Assessment :
Market share, competitor positioning, strategic initiatives, partnerships, acquisitions.
Primary Research — Stakeholder Coverage by Category
Distribution of interview respondents across stakeholder categories (% share from PPT data)

Primary Research — Respondent Designation Profile
Seniority breakdown of interview respondents (% share from PPT data)

Primary Research — Geographic Coverage of Interviews
Regional distribution of primary research engagement (% share from PPT data)

Phase 6 — Data Triangulation and Market Validation
No single methodology is relied upon in isolation. Multiple independent estimation approaches are combined and reconciled to ensure consistency, accuracy, and analytical defensibility. Any material deviations between approaches are investigated and adjusted through additional validation cycles.
The final market size is derived through weighted triangulation of all validated methodologies. Any material deviations between approaches are investigated and adjusted through additional validation cycles. The outcome represents the most realistic assessment of the market based on available evidence and expert confirmation ensuring that volume and value estimates are fully consistent with one another.
Triangulation Framework — Input Contribution Weight
Relative weight each sizing input contributes to the final reconciled market estimate

Phase 7 — Forecast Modeling: Projecting Future Market Evolution
Forecasting evaluates the future trajectory of the market using a combination of quantitative indicators and qualitative assessments across economic, industry, and regulatory dimensions. Rather than simple extrapolation, each driver is independently modeled and integrated into a composite forecast.
Macroeconomic Indicators
GDP growth, industrial production, manufacturing output, construction activity, consumer spending, and capital investment form the quantitative foundation of long-term demand projections. These are applied at country, regional, and global levels.
Industry Growth Drivers
Urbanization, infrastructure development, industrialization, technological innovation, sustainability initiatives, and evolving product performance requirements are assessed at regional and industry levels — capturing both structural and cyclical demand drivers.
Capacity Expansion Analysis
Announced plant expansions, new manufacturing facilities, technology upgrades, and strategic investments are evaluated to determine future supply-demand dynamics and potential market tightness or oversupply situations.
Regulatory & Sustainability
Environmental regulations, chemical safety standards, emission reduction targets, circular economy initiatives, and sustainability requirements are incorporated as they often influence product adoption rates and market growth trajectories.
Scenario Forecast Range — Indexed Market Growth (Year 1–10)
Illustrative indexed growth trajectories across Base, Optimistic, and Pessimistic scenarios over a 10-year forecast horizon

Forecast Drivers — Relative Impact Score by Category
Impact score (0–100) of each driver type on chemicals & materials market forecast




Comments
Share your thoughts, ask a question, or provide feedback about this report.