
What is the Europe Post-consumer Recycled Plastics Market Size and Share?
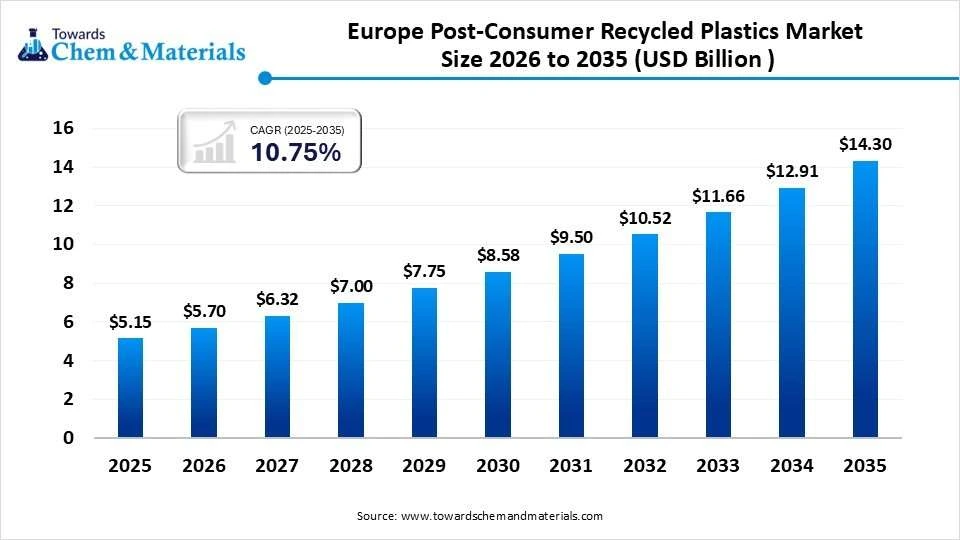
The Europe post-consumer recycled plastics market size was valued at USD 5.15 billion in 2025 and is projected to grow from USD 5.70 billion in 2026 to USD 14.30 billion by 2035, exhibiting a CAGR of 10.75% during the forecast period. Recycled-content mandates, extended producer responsibility, and brand-owner sourcing commitments are driving demand, while qualified food-grade feedstock remains the key supply constraint. The report covers market size, segmentation, pricing, demand-supply balance, value chain, technology, regulation, competitive benchmarking, M&A, and profiles of 21 leading companies.
Key Takeaways
- Packaging is the largest application segment at about a 44% share, followed by building and construction at about 21%.
- Western Europe holds about 71% of regional value. Eastern and Southern Europe are growing faster at an estimated 9-10% CAGR.
- Chemical recycling operates at about 0.3-0.5 million tons, with announced projects above 2 million tons by 2030.
- The market is highly fragmented: more than 500 recyclers operate, and the top ten hold only about 18-22% of volume.
- Regulation is the core demand engine, driven by recycled-content mandates, packaging regulation, and extended producer responsibility fee modulation.
- The market is bifurcated: food-grade and bottle-grade streams face structural deficits, while mixed and flexible-film streams are in oversupply.
- Value is shifting toward sorting intelligence and food-grade decontamination, which are the main margin pools.
- Chemical recycling is a promising but unproven supply pool, with commissioning and cost risks, and mass-balance rules remain contested.
- Key white spaces include food-grade rPP and rHDPE, recycled flexible films, automotive-grade compounds, and sorting investment in Southern and Eastern Europe.
Overview: A Compliance-Led Market Where Feedstock, Not Demand, is the Binding Constraint
Packaging is the largest application, at roughly 44% of the market share. Recycled PET (rPET) is the largest polymer type pool by value, at roughly 39%. The market is highly fragmented: more than 500 recyclers operate, and the ten largest participants hold only about 18–22% of volume. Maturity varies sharply by polymer. Bottle-grade PET is a mature, closed-loop system, while polypropylene and flexible-film recycling are still scaling.
Key Coverage
- 2020–2025 historical and 2026–2035 forecast, value, and volume
- Regional split across 20+ countries
- Recycled-content penetration by application
- Concentration and maturity assessment by polymer stream
- Base, upside, and downside scenarios.
Segmentation Analysis: Recycled PET Leads Value, While Recycled Polypropylene (rPP) Offers the Fastest Growth
- By polymer type, the recycled PET (rPET) segment dominated the market with the largest share of 39% in 2025 and is expected to grow at a CAGR of 6% during the forecast period.
- By polymer type, the recycled polypropylene (rPP) segment held an 18% market share in 2025 and is expected to grow at the fastest CAGR of 9.5% over the forecast period.
- By application, the packaging segment dominated the market with the largest share of 44% in 2025 and is expected to grow at a CAGR of 7% during the forecast period.
- By grade, the non-food grade segment dominated the market with the largest share of 41% in 2025 and is expected to grow at a CAGR of 5.5% during the forecast period.
- By grade, the food-contact grade segment held a 38% market share in 2025 and is expected to grow at the fastest CAGR of 9.2% over the forecast period.
Market Dynamics: Regulatory Pull is Outpacing Supply-Side Economics
- Drivers: Recycled-content mandates for plastic beverage bottles, the new packaging regulation’s recycled-content obligations (about 30% for non-contact-sensitive packaging and up to 65% for certain contact-sensitive bottles by 2040), plastics levies, and extended producer responsibility fee modulation. Brand-owner commitments add demand, with many large consumer-goods companies targeting 25–50% recycled content by 2030.
- Restraints: Sorting yields, contamination, and food-contact approval bottlenecks. Industry estimates suggest more than one million tons of European recycling capacity has closed or been mothballed since 2022, reflecting energy costs and low-cost virgin and imported material.
- Opportunities: Deposit-return systems, which lift bottle collection above 90% where implemented. Also advanced sorting, which can raise polyolefin output by 15–25% from existing waste streams.
- Challenges: Imports of low-cost recycled material, weak virgin prices, and enforcement gaps.
How Do Recycled Polymer Price Premiums, Virgin-Material Benchmarks, and Energy Costs Shape Profitability?
In 2025, indicative prices for pelletized recycled plastics ranged from EUR 600–900/ton for mixed-polymer recyclate to EUR 1,500–2,000/ton for food-grade rPET, highlighting the significant value difference between commodity recycling and high-quality, application-specific materials. Recycled natural HDPE was priced at EUR 1,200–1,600/ton, while recycled PP ranged from EUR 1,000–1,400/ton. Food-contact premiums over virgin plastics varied from 0% to 40%, depending on the polymer, market conditions, and regulatory requirements. Conversion costs of EUR 250–450/ton and feedstock bale costs representing 45–60% of total costs further demonstrate the industry's sensitivity to input prices and processing efficiency.
Our analysis indicates that profitability depends more on product quality, feedstock economics, and the ability to meet application-specific requirements than on recycled-material prices alone. The wide price gap between food-grade rPET and mixed-polymer recyclate reflects the commercial value of consistent quality, advanced sorting, traceability, and food-contact compliance. However, premiums are not guaranteed: when virgin polymer prices decline or recycled-material supply exceeds demand, the price advantage of recycled grades can narrow. The reported margin difference reinforces this distinction, with commodity recyclers typically operating at low single-digit EBITDA margins, compared with 12–18% for integrated food-grade producers.
In our view, the strongest competitive advantage lies in combining reliable feedstock sourcing with efficient processing and access to premium end markets. Since feedstock accounts for 45–60% of total costs, even modest changes in bale prices can materially affect margins, particularly for operators with limited pricing power. Energy-intensive processing and sorting costs create additional exposure, while the ability to pass cost increases through to customers depends on contract structures and the relationship between virgin and recycled polymer prices. Producers with integrated operations, consistent output quality, and established food-grade capabilities are therefore better positioned to protect margins, although their performance remains sensitive to utilization, input costs, and realized selling prices.
The full report provides monthly price trends, regional price differentials, cost-curve comparisons, price pass-through analysis, and forecasts of virgin-to-recycled polymer spreads. It examines how feedstock availability, energy costs, regulatory requirements, and end-market demand influence pricing across polymer grades, helping businesses assess margin resilience, identify attractive product segments, and evaluate sourcing, capacity, and investment decisions.
The accompanying structured pricing dataset can track monthly prices by polymer grade, product quality, region and year, alongside feedstock costs, conversion costs, food-contact premiums, virgin-polymer benchmarks and indicative EBITDA margins. Users can filter and benchmark price movements across regions and grades to identify premium opportunities, monitor cost pass-through, and assess changes in relative competitiveness. This dataset complements the strategic report by enabling more granular pricing analysis and ongoing commercial decision-making.
Key Coverage
- Price by polymer and grade
- Regional price differentials
- Feedstock Bale Pricing
- Conversion and energy cost structure
- Margin pools by business model
- Five-year pricing outlook
Why Does Europe Face a Shortage of Food-Grade Recycled Plastics Despite Having Significant Recycling Capacity?
Europe has an estimated 9–10 million tons of installed recycling capacity, but plants operate at only around 65–75% utilization, with even lower rates in some polyolefin segments. This shows that having enough processing capacity does not automatically translate into an adequate supply of high-quality recycled materials. Bottle-grade rPET and food-grade HDPE are expected to face supply shortages as recycled-content requirements increase, with the potential rPET supply gap reaching 1.0–1.5 million tons by 2030 if collection rates do not improve.
Where is Value Concentrating in the Recycled Plastics Supply Chain, and Which Capabilities Offer the Strongest Margin Potential?
The recycled plastics value chain extends from waste collection and municipal systems to sorting, baling, washing, extrusion, compounding, converters, brand owners, and retailers. Collection and sorting account for approximately 40–50% of recyclate costs, making feedstock quality and sorting efficiency major determinants of overall economics. At the higher-value end, food-grade decontamination allows processors to earn premium returns estimated at 2–3 times commodity recycling margins. Long-term offtake agreements already cover an estimated 50–60% of food-grade output, reflecting the growing importance of supply reliability and quality consistency.
In our view, the strongest opportunities lie in improving upstream feedstock efficiency while expanding downstream food-grade processing capabilities. Recyclers that secure reliable waste supplies, improve sorting performance, and develop approved decontamination processes may be better positioned to capture higher margins and build more stable customer relationships. However, investment decisions must account for the cost of advanced processing, approval timelines, and the risk of underutilized capacity if suitable feedstock is unavailable.
The full report provides a deeper assessment of cost distribution and margin pools across the value chain, including collection and sorting economics, processing costs, food-grade premium potential, supply bottlenecks and offtake contracting trends. It also examines how regulatory requirements and integration between recycling stages influence profitability, helping businesses identify where investment, partnerships and operational improvements can generate the greatest commercial value.
Trade & Import–Export: Is Europe Becoming a More Competitive Market for Recycled Plastics?
Europe has reduced its plastic waste exports significantly since 2018, encouraging more waste to be processed within the region. However, imported recycled materials, particularly low-cost PET flakes and polyolefin pellets, continue to put pressure on local recyclers. As trade restrictions tighten and recycled-content verification becomes more important, the ability to demonstrate material origin, quality and compliance is likely to influence which suppliers can access European markets.
Technology & Innovation: Can Advanced Sorting and Recycling Technologies Turn More Plastic Waste into Valuable Recycled Materials?
Near-infrared and AI-enabled optical sorting technologies can achieve output purity above 95% in key waste streams, helping recyclers produce more consistent materials and reduce contamination. Solid-state polycondensation and other super-clean technologies are supporting the production of food-grade recycled PET and polyolefins. Meanwhile, chemical recycling technologies, including pyrolysis, depolymerization and solvolysis, have an estimated 0.3–0.5 million tons of capacity in operation, while announced projects exceed 2 million tons by 2030. However, not all announced capacity is expected to become commercially operational.
Regulatory & Sustainability: How Are Recycled-Content Mandates Changing Demand and Competition in Europe?
Regulations are becoming a major driver of recycled plastics demand. Key requirements include a minimum of 25% recycled plastic in PET beverage bottles from 2025 and a 30% target for all plastic beverage bottles by 2030. The EU Packaging and Packaging Waste Regulation introduces further recycled-content and design-for-recycling requirements, while extended producer responsibility schemes can link fees to packaging recyclability. In addition, recycled resins typically have a 50–80% lower carbon intensity than virgin plastics, making them attractive to companies working to reduce their environmental footprint. However, the treatment of chemically recycled materials under mass-balance accounting rules remains an important area of uncertainty.
Customer & Application Analysis: Brand Owners Lock in Supply, While Converters Face Qualification Barriers
Beverage and food brand owners are the highest-value customers, with multi-year offtakes and prepayment or co-investment structures increasingly common. Construction customers are price-sensitive but volume-stable. Automotive qualification cycles run 12–24 months, creating switching barriers. Key unmet needs include consistent color, odor-free polyolefins, and certified food-grade supply.
Competitive Intelligence
Who is Best Positioned to Win in Europe’s Post-Consumer Recycled Plastics Market as Feedstock Control and Food-Grade Capability Become the Main Sources of Advantage?
The European post-consumer recycled plastics market is highly fragmented, with more than 500 recyclers operating and the ten largest players holding only about 18–22% of volume. Participants fall into four archetypes: waste-management groups that integrate collection through recycling, polymer producers building circular portfolios through acquisitions and joint ventures, packaging and bottle manufacturers securing captive recycled supply, and independent specialist recyclers focused on food-grade or technical compounds. Competitive intensity is high in commodity grades and moderate in food-grade, where regulatory approval and long-term offtake contracts create meaningful barriers. Resin producers are expanding through both acquisitions and in-house capacity, while pure-play recyclers face margin pressure unless they are backed by long-term brand-owner contracts.
Our analysis indicates that the low concentration reflects the structure of the feedstock base rather than a lack of scale ambitions. Collection and sorting account for roughly 40–50% of recyclate cost, and feedstock is scarce, which means advantage accrues to players who control bale supply rather than to those who simply operate more washing and extrusion lines. This is consistent with the margin spread in the market: EBITDA margins sit in the low single digits for commodity recyclers but reach 12–18% for integrated food-grade producers. Our assessment is that the four archetypes are converging on the same end state, which is feedstock access combined with food-contact approval and contracted offtake, and that each is approaching it from a different starting position with a different gap to close. Waste majors hold feedstock but are less advanced in decontamination, resin producers hold technology and customer access but depend on acquisitions for feedstock, packaging integrators secure captive demand but at limited scale, and specialists hold process expertise but lack balance-sheet capacity.
The full report benchmarks the leading company universe on estimated volume share, capacity, utilization, feedstock integration, grade mix, EBITDA margin, technology, and offtake security, and quantifies share gains and losses by archetype. It also maps competitive intensity by polymer, grade, and country, and identifies capability gaps and likely strategic moves for each player group.
The same intelligence is available as a structured competitive database tracking companies, facilities, capacities, utilization, polymer and grade mix, food-contact approvals, offtake agreements, announced expansions and transactions by year and country. Users can filter and benchmark participants by archetype, region, polymer or technology, which complements the strategic analysis with granular, comparable company-level data.
Tentative Leading Company Universe
| Sr.no | Company | HQ | Market Position | Core Strength | Major Segments |
| 1 | Veolia | France | Global leader | Collection-to-resin integration | PET, PE, PP |
| 2 | Indorama Ventures | Thailand | Scale leader | PET recycling scale | rPET, packaging |
| 3 | ALPLA | Austria | Integrator | Captive recycling | Bottles, rPET/rHDPE |
| 4 | Borealis | Austria | Polyolefin leader | Circular polyolefin platforms | rPP, rPE |
| 5 | LyondellBasell | Netherlands | Global producer | Mechanical + chemical recycling | PE, PP |
| 6 | SABIC | Saudi Arabia | Global producer | Certified circular polymers | PE, PP |
| 7 | TotalEnergies | France | Producer | Circular polymer portfolio | PE, PP, PS |
| 8 | Dow | U.S. | Producer | Recycled-content resins | PE |
| 9 | Plastipak | U.S. | Packaging integrator | rPET bottle supply | PET |
| 10 | Amcor | Switzerland | Packaging leader | Flexible and rigid packaging | Packaging |
| 11 | REMONDIS | Germany | Waste major | Collection, sorting scale | Mixed, PET |
| 12 | PreZero | Germany | Waste major | Sorting, recycling | PE, PP, PET |
| 13 | Paprec | France | Regional leader | Sorting, recycling | PET, PE |
| 14 | Biffa | UK | Regional leader | UK recycling | HDPE, PET |
| 15 | Viridor | UK | Regional leader | Recovery infrastructure | PE, PP |
| 16 | Morssinkhof | Netherlands | Specialist | Polyolefin recyclate | PE, PP |
| 17 | Greiner | Austria | Converter | Recycled-content packaging | PP, PS |
| 18 | Wavin (Orbia) | Netherlands | Application specialist | Pipes from recyclate | PVC, PE |
| 19 | INEOS Styrolution | Germany | Producer | Recycled styrenics | PS, ABS |
| 20 | Plastic Energy | UK | Technology challenger | Chemical recycling | Mixed plastics |
| 21 | Mura Technology | UK | Technology challenger | Hydrothermal recycling | Flexible films |
Market Share & Competitive Ranking: Fragmentation Persists, but Integrated Groups Are Gaining Share
The top five participants are estimated at 10–13% combined volume share, and the top ten at 18–22%. Waste majors and PET specialists lead in volume, while resin producers lead in value-added food-grade polyolefins. Share gains are concentrated on players with captive brand-owner offtakes and integrated sorting. Share losses are concentrated among small independents exposed to energy costs and import competition. The report provides estimated shares, ranking, and share-shift analysis for the full universe.
Competitive Benchmarking: Feedstock Access, Food-Grade Approval, and Offtake Security Drive Advantage
Companies are benchmarked on capacity, feedstock integration, grade mix, EBITDA margin, technology, geographic reach, and customer contracts. Leaders combine feedstock control with food-grade capability. Moderate players are strong in commodity grades but exposed to price cycles. Emerging challengers are technology-led but carry commissioning risk.
- Product Portfolio Benchmarking
- Broad-portfolio leaders (Veolia, Borealis, LyondellBasell, SABIC) cover PET, PE and PP across grades. Specialty leaders focus on food-contact or technical compounds. Gaps remain in recycled flexible-film resins and high-quality rPP for demanding applications.
- Competitive Application Benchmarking
- Packaging is led by integrators and producers, construction by regional recyclers and pipe makers, and automotive by compounders and resin producers with qualification credentials. White spaces include recycled flexible packaging, food-grade rPP, and automotive-grade recycled compounds.
- Geographic Competitive Landscape
- Global players lead in Western Europe. Regional waste groups hold strong positions in the UK, France, and Germany. Local specialists dominate Southern and Eastern Europe, where infrastructure investment is accelerating. The report profiles footprint, sales reach, and expansion by country.
- Manufacturing & Capacity Benchmarking
- Leading players operate plants with annual capacity from tens of thousands to several hundred thousand tons, with announced expansions concentrated in food-grade PET, polyolefin sorting and chemical recycling. Utilization differs sharply between integrated leaders (about 80–90%) and independents (about 60–70%).
Strategic Developments
Recent activity includes recycling capacity additions by resin producers, packaging companies and waste majors, brand-owner co-investments, new food-grade lines, and chemical recycling partnerships. Announcements highlight a shift from tolling and spot sales toward integrated, contract-backed models. The report tracks plant announcements, capacity, investment values, and commissioning timelines.
M&A Landscape: Consolidation is Reshaping the Competitive Structure
Transaction themes include resin producers acquiring mechanical recyclers, packaging majors combining to secure scale and circular capability, and private capital acquiring waste groups. Recent examples include the Amcor–Berry combination and polyolefin recycler acquisitions by leading resin producers. The report analyzes acquirer, target, year, geography, rationale, and disclosed values, along with likely future themes: feedstock integration, food-grade capability, and technology access.
Opportunity & White-Space Analysis
Highest-value opportunities include food-grade rPP and rHDPE (estimated USD 1.5–2 billion incremental by 2035), flexible-film recycling, automotive-grade compounds, sorting investments in Southern and Eastern Europe, and import substitution of low-cost recyclate. A 10–15 percentage-point penetration gap in recycled content versus mandate trajectories underpins capacity needs.
Industry Structure (Porter’s Five Forces)
- Supplier power: High. Feedstock is scarce, and bale prices are volatile.
- Buyer power: Medium–High. Large brand owners dominate, though mandates reduce their leverage.
- New entrants: Medium. Capex and food-grade approvals are barriers, but subsidies attract entrants.
- Substitutes: Medium. Virgin resin, bio-based plastics, and chemically recycled content compete.
- Rivalry: High in commodity grades, Medium in food-grade.
PESTLE Analysis
- Political: Government mandates, waste-trade restrictions, and recycling policies influence market demand and investment decisions.
- Economic: Energy costs, feedstock prices, and fluctuations in virgin plastic prices affect recycling costs and profit margins.
- Social: Growing consumer awareness and brand-owner commitments are increasing demand for sustainable packaging and recycled plastics.
- Technological: Advances in AI-based sorting, decontamination, and recycling technologies improve material quality and processing efficiency.
- Legal: Recycled-content requirements, regulatory enforcement, and material-traceability rules determine market access and compliance costs.
- Environmental: Carbon-reduction targets, waste minimization, and circular-economy goals encourage greater use of recycled materials.
Europe Post-Consumer Recycled Plastics Market Segments
By Polymer Type
- Recycled PET (rPET)
- Recycled Polyethylene (rHDPE, rLDPE/rLLDPE)
- Recycled Polypropylene (rPP)
- Recycled PVC
- Recycled Polystyrene (rPS)
- Other and Mixed Polymers
By Application
- Packaging (bottles, rigid, flexible films)
- Building and Construction
- Automotive
- Agriculture
- Electrical and Electronics
- Consumer Goods
- Textiles and Fibers
- Others
By Grade
- Food-Contact Grade
- Non-Food Grade
- Technical/Engineering Grade
By Recycling Process
- Mechanical Recycling
- Chemical/Advanced Recycling
By Country
- Germany
- France
- United Kingdom
- Italy
- Spain
- Benelux
- Nordics
- Eastern Europe
- Rest of Europe
A Seven-Phase Framework
Our methodology is designed to be universally applicable across commodity chemicals, specialty chemicals, petrochemicals, construction chemicals, coatings, electronic chemicals, industrial gases, agrochemicals, water treatment chemicals, and performance materials. Each phase builds upon the last, creating a layered validation structure that minimizes estimation error and maximizes analytical confidence.
The framework ensures comprehensive market coverage, robust cross-validation, and reliable long-term forecasting — producing market estimates that withstand scrutiny from investors, regulators, and corporate strategy teams.

Seven-Phase Framework — Analytical Effort Distribution
Relative analytical effort allocated across each phase of the Chemicals & Materials research framework

Phase 1 - Secondary Research: Establishing the Foundation
Secondary research collects and evaluates publicly available information from authoritative sources, establishing the foundational understanding of market structure, value chain dynamics, competitive landscape, and end-use demand patterns. Every source is evaluated for credibility, recency, geographic relevance, and methodological soundness before inclusion.
Industry Associations
Sources include ACC, CEFIC, ICCA, JCIA, CPCIF, and SOCMA providing production volumes, consumption trends, capacity developments, and sustainability initiatives.
Company Disclosures
Annual reports, investor presentations, earnings transcripts, and regulatory filings reveal product portfolios, manufacturing footprints, capacity expansions, and revenue segmentation.
Government Databases
National statistical offices, customs authorities, environmental agencies, and industrial production databases provide verified statistics on output, trade flows, and regulatory compliance.
Trade Databases
UN Comtrade, ITC, Eurostat, and national customs authorities enable assessment of global product movement, import dependency, and export competitiveness across regions.
Our Secondary Research Sources
- Ministry of Chemicals and Fertilizers
- European Chemicals Agency
- United States Department of Energy
- Ministry of Industry and Information Technology
- Ministry of Economy Trade and Industry
- Ministry of Trade Industry and Energy
- National Institute of Standards and Technology
- Council of Scientific and Industrial Research
- Fraunhofer Society
- National Institute for Materials Science
Phase 2 — Supply-Side Assessment: Mapping Production Capabilities
Production Capacity Analysis
All major manufacturers are assessed for existing installed capacity, planned additions, expansions, new plant announcements, and technology adoption — mapped at global, regional, and country levels.
Capacity Utilization Adjustment
Installed capacity is adjusted using utilization rates based on demand conditions, feedstock availability, plant operating rates, maintenance schedules, and regulatory restrictions.
Manufacturer Revenue Analysis
Product-specific revenues, segment-level performance, regional distribution, average selling prices, and margin trends are evaluated to establish market value estimates.
Supply-Side Assessment — Capacity vs. Effective Production by Region
Illustrative comparison of installed capacity vs. effective production volume (after utilization rate adjustment) across major regions

Phase 3 — Demand-Side Assessment: Quantifying Chemical Consumption
Demand-side analysis quantifies chemical consumption across industries, applications, and geographies — identifying where and how chemicals are consumed throughout the value chain with precision.
End-Use Industry Analysis
Chemical demand is evaluated across automotive, construction, packaging, electronics, agriculture, healthcare, consumer goods, industrial manufacturing, energy and utilities, and water treatment. Industry output, production trends, and consumption intensity are analyzed to determine demand patterns.
Consumption Modeling
Demand is estimated using measurable indicators: kilograms per vehicle, kilograms per square meter of construction, dosage per cubic meter of water treated, kilograms per hectare of agricultural land, and kilograms per ton of manufactured products. Consumption factors are validated through industry publications and primary interviews.
Application Analysis
The market is segmented by application area to understand product performance requirements, formulation trends, technology adoption, customer preferences, and regulatory requirements improving demand accuracy and segmentation granularity.
Demand-Side Assessment — End-Use Industry Demand Distribution
Illustrative distribution of chemical & materials demand across key end-use industries

Phase 4 - Trade Flow Analysis: Balancing Regional Supply and Demand
Trade flow analysis reconciles regional supply and demand estimates through import and export data, identifying net supply positions, regional dependencies, and market imbalances. It serves as an independent validation layer that tests the consistency of supply-side and demand-side estimates.
Import Analysis
Import data is evaluated to determine volumes, source countries, product dependency, regional supply gaps, and pricing trends — identifying markets that rely heavily on external supply and where domestic production is insufficient to meet demand.
Export Analysis
Export assessments reveal production surplus, export competitiveness, regional manufacturing strength, and global market participation. Export patterns also help validate domestic production estimates and identify net exporting regions.
Apparent Consumption Model
Regional consumption is assessed using the standard apparent consumption formula:
Results identify net importing regions, net exporting regions, regional deficits, and surpluses — serving as an independent validation of supply and demand estimates.
Trade Flow Analysis — Net Supply Position by Region
Illustrative apparent consumption vs. domestic production across major regions — positive gap indicates net import dependency

Phase 5 — Primary Research: The Critical Validation Layer
Primary research tests and refines findings from secondary research through direct engagement with industry participants across the supply chain, demand side, and expert community. It captures intelligence that no database or published report can provide — the real-world experience of manufacturers, buyers, and specialists operating in the market.

Supply-Side Interviews
Conversations with chemical manufacturers, raw material suppliers, contract manufacturers, technology providers, and plant operators cover production trends, capacity utilization, pricing developments, technology shifts, and competitive dynamics.

Demand-Side Interviews
Engagement with OEMs, industrial consumers, procurement managers, distributors, formulators, and end-use manufacturers focuses on consumption trends, purchasing behavior, product substitution, demand outlook, and emerging applications.

Industry Expert Consultations
Additional interviews with industry consultants, independent experts, regulatory specialists, technical professionals, and research institutions provide deeper market context and validate key analytical assumptions.
Focus Areas of Primary Research:
Market Size & Forecast Validation
Revenue estimates, volume consumption, growth rates, forecast assumptions, regional demand.Supply Chain & Value Chain Assessment
Raw material sourcing, supply chain challenges, distribution networks, procurement practices.Production & Capacity Analysis
Manufacturing capacity, utilization rates, expansion projects, plant investments.Pricing & Cost Structure Analysis
Product pricing trends, feedstock costs, energy costs, margin pressures, pricing outlook.Competitive Landscape Assessment
Volume and value estimates confirmed to be fully consistent with one another before publicationInterview Volume by Market Scope
| Study Scope | Number of Interviews |
|---|---|
| Niche Market | 20 – 30 |
| Mid-Sized Market | 30 – 50 |
| Global Market | 50 – 80 |
| Highly Fragmented Market | 80 – 120 |
Interview Details:
Category : Manufacturers, Suppliers, Distributors, End Users, Experts/Associations
Average Duration : 30–60 Minutes
Interview Mode : Video calls, telephonic interviews, expert consultations
Interview Format : Structured / Semi-Structured questionnaire
Focus Areas of Primary Research:
Market Size & Forecast Validation :
Revenue estimates, volume consumption, growth rates, forecast assumptions, regional demand.
Supply Chain & Value Chain Assessment :
Raw material sourcing, supply chain challenges, distribution networks, procurement practices.
Production & Capacity Analysis :
Manufacturing capacity, utilization rates, expansion projects, plant investments.
Pricing & Cost Structure Analysis :
Product pricing trends, feedstock costs, energy costs, margin pressures, pricing outlook.
Competitive Landscape Assessment :
Market share, competitor positioning, strategic initiatives, partnerships, acquisitions.
Primary Research — Stakeholder Coverage by Category
Distribution of interview respondents across stakeholder categories (% share from PPT data)

Primary Research — Respondent Designation Profile
Seniority breakdown of interview respondents (% share from PPT data)

Primary Research — Geographic Coverage of Interviews
Regional distribution of primary research engagement (% share from PPT data)

Phase 6 — Data Triangulation and Market Validation
No single methodology is relied upon in isolation. Multiple independent estimation approaches are combined and reconciled to ensure consistency, accuracy, and analytical defensibility. Any material deviations between approaches are investigated and adjusted through additional validation cycles.
The final market size is derived through weighted triangulation of all validated methodologies. Any material deviations between approaches are investigated and adjusted through additional validation cycles. The outcome represents the most realistic assessment of the market based on available evidence and expert confirmation ensuring that volume and value estimates are fully consistent with one another.
Triangulation Framework — Input Contribution Weight
Relative weight each sizing input contributes to the final reconciled market estimate

Phase 7 — Forecast Modeling: Projecting Future Market Evolution
Forecasting evaluates the future trajectory of the market using a combination of quantitative indicators and qualitative assessments across economic, industry, and regulatory dimensions. Rather than simple extrapolation, each driver is independently modeled and integrated into a composite forecast.
Macroeconomic Indicators
GDP growth, industrial production, manufacturing output, construction activity, consumer spending, and capital investment form the quantitative foundation of long-term demand projections. These are applied at country, regional, and global levels.
Industry Growth Drivers
Urbanization, infrastructure development, industrialization, technological innovation, sustainability initiatives, and evolving product performance requirements are assessed at regional and industry levels — capturing both structural and cyclical demand drivers.
Capacity Expansion Analysis
Announced plant expansions, new manufacturing facilities, technology upgrades, and strategic investments are evaluated to determine future supply-demand dynamics and potential market tightness or oversupply situations.
Regulatory & Sustainability
Environmental regulations, chemical safety standards, emission reduction targets, circular economy initiatives, and sustainability requirements are incorporated as they often influence product adoption rates and market growth trajectories.
Scenario Forecast Range — Indexed Market Growth (Year 1–10)
Illustrative indexed growth trajectories across Base, Optimistic, and Pessimistic scenarios over a 10-year forecast horizon

Forecast Drivers — Relative Impact Score by Category
Impact score (0–100) of each driver type on chemicals & materials market forecast




Comments
Share your thoughts, ask a question, or provide feedback about this report.