
Europe Fertilizers Market Size Analysis Report 2035
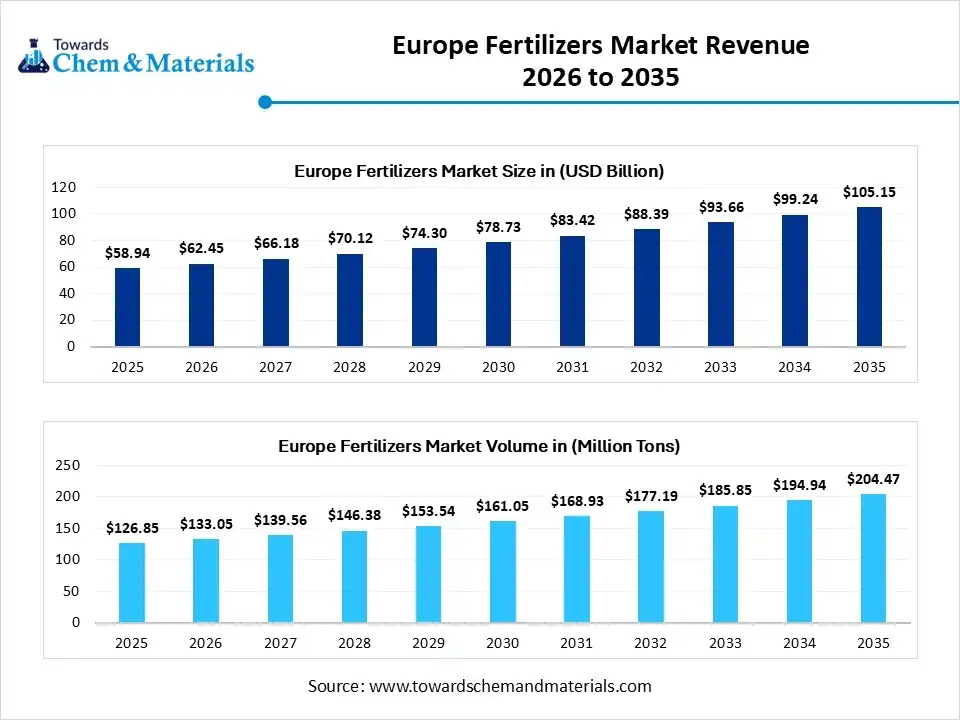
The Europe fertilizers market size was valued at USD 58.94 billion in 2025, is estimated to reach USD 62.45 billion in 2026, and is projected to reach USD 105.15 billion by 2035, exhibiting a compound annual growth rate (CAGR) of 5.96% over the forecast period from 2026 to 2035. In terms of volume, the Europe fertilizers market is projected to grow from 126.85 million tons in 2025 to 204.47 million tons by 2035. growing at a CAGR of 4.89% from 2026 to 2035.The global shift towards modern farming practices is taking center stage in industry discussions.
Key Takeaways
- By product type, the nitrogenous fertilizers segment dominated the market with 38% in 2025.
- By product type, the phosphatic fertilizers segment is expected to grow at the fastest rate in the market during the forecast period.
- By formulation, the straight fertilizers segment dominated the market with 34% industry share in 2025.
- By formulation, the specialty formulations segment is expected to grow at the fastest rate in the market during the forecast period.
- By source, the synthetic / mineral fertilizers segment dominated the market with 63% industry share in 2025.
- By source, the biofertilizers / microbial fertilizers segment is expected to grow at the fastest rate in the market during the forecast period.
- By application, the cereals and grains treatment segment dominated the market with 43% industry share in 2025.
- By application, the fruit and vegetables segment is expected to grow at the fastest rate in the market during the forecast period.
At a Glance
- Market Estimated Size (2025): USD 58.94 Billion | CAGR (2026–2035): 5.96%
- Market Projected Size (2035): USD 105.15 Billion
- Market Volume (2025): 126.85 Million Tons| Volume CAGR (2026–2035): 4.89%
- Market Projected Volume (2035): 204.47
- Pricing Data (2025):
- Average Manufacturing Price (2025): USD 313/Ton
- Average Selling Price (2025): USD 429/Ton
- Pricing CAGR (2026–2035): 3.88%
Feeding the Future: Europe Advances in Smart and Sustainable Fertilization
- The Europe fertilizers market represents a structured industry for manufacturing, distribution, and utilization of mineral, organic, and bio-based fertilizers designed to enhance soil fertility and crop productivity across European agriculture. It covers primary nutrients (nitrogen, phosphorus, potassium), compound NPK blends, micronutrients, and specialty formulations across granular, liquid, and slow-release forms.
- The market serves diverse crop groups, cereals, fruits & vegetables, oilseeds, and ornamentals through soil, foliar, and fertigation applications.
- Driven by the EU Farm-to-Fork strategy, sustainable farming initiatives, and technological innovations such as precision agriculture and biofertilizers, Europe’s fertilizer industry is transitioning from volume-based to efficiency-oriented growth.
- Western Europe leads in consumption and innovation, while Eastern Europe records the highest growth potential through modernization and digital agritech adoption.
Europe Fertilizers Market Outlook:
- Industry Growth Overview: Between 2025 and 2034, the heavy replacement of the high-dosing habits with the smarter crop-specific plants by major farmers in Europe is actively providing the sophisticated consumer bae to the industry in recent years. Moreover, the precision blends, services that mix nutrients on the farm, and local blending sites have become a trending subject nowadays.
- Sustainability Trends: The major manufacturers are seen in shifting raw material sourcing to the recycled nutrients and microbes in recent years. Moreover, the food waste digestate, bio stimulant blends, and urine recovery fertilizers are being recognized as high-potential opportunities in the sector nowadays.
- Global Expansion: The European manufacturers are observed under the sophisticated export of the fertilizers with small batches and smart blends to Eastern Europe and the nearby African region in recnt years. Moreover, the biopsoke micronutrient mix and supplier bundles, which included recipe and test kits, have created a huge demand for European fertilizers across the globe in the past few years.
Report Scope
| Report Attributes | Details |
| Market Size in 2026 | USD 62.45 Billion / 133.05 Million Tons |
| Expected Size by 2035 | USD 105.15 Billion / 204.47 Million Tons |
| Growth Rate from 2025 to 2035 | CAGR 5.96% |
| Base Year of Estimation | 2024 |
| Forecast Period | 2025 - 2035 |
| Segment Covered | By Product Type, By Formulation, By Source, By Application |
| Key Companies Profiled | ICL Group, CF Industries Holdings, Inc, Grupa Azoty S.A, K+S Aktiengesellschaft, OCI Global N.V. , EuroChem Group , Haifa Group , Nutrien Ltd. , The Mosaic Company , OCP Group S.A. |
Investment Surge in AgriTech: Drone Dosing and Smart Soil Solutions
The technology is heavily gaining traction with investment firms and analysts in the region. The precision granules subscription dosing via drones, and seed-coated nutrients has sparked considerable attention from financial analysts across the globe in recent years. Moreover, the development of innovative products like soil data packages and other services is likely to create lucrative opportunities for manufacturers in the coming years.
Trade Analysis of the Europe Fertilizers Market:
Import, Export, Consumption, and Production Statistics
- The United Kingdom has exported a notable number of fertilizers in the year of 2024 and exports worth around 302 million euros.
- Germany has seen under a heavy fertilizers export which is worth around $2.38 billion in 2024.
Value Chain Analysis of the Europe Fertilizers Market:
- Distribution to Industrial Users :Distribution of fertilizers to industrial users in the European market primarily involves direct sales and supply agreements with large manufacturers.
- Key Players: Yara International ASA, OCI Global (OCI NV), and BASF SE
- Chemical Synthesis and Processing :The chemical synthesis and processing of fertilizers in the European market are dominated by the production of three primary nutrients such as nitrogen (N), phosphorus (P), and potassium (K).
- Key Players: OCI Global (OCI NV), CF Industries Holdings, Inc., and ICL Group Ltd.
- Regulatory Compliance and Safety Monitoring :Regulatory compliance and safety monitoring in the European fertilizers market are primarily governed by a robust framework centered around the EU Fertilising Products Regulation.
- Key Players: OCI Global (OCI NV), CF Industries Holdings, Inc., and ICL Group Ltd.
Europe Fertilizers Market Regulatory Landscape: Global Regulations
| Country / Region | Regulatory Body | Key Regulations | Focus Areas | Notable Notes |
| European Union | European Chemicals Agency (ECHA) | Fertilising Products Regulation (FPR) (EU) 2019/1009 | Sustainability and circular economy | The executive body of the EU that initiates and enforces legislation, including that governing fertilizing products and agriculture. |
Segmental Insights
Product Type Insights
How did the Nitrogenous Fertilizers Segment Dominate the Europe Fertilizers Market in 2025?
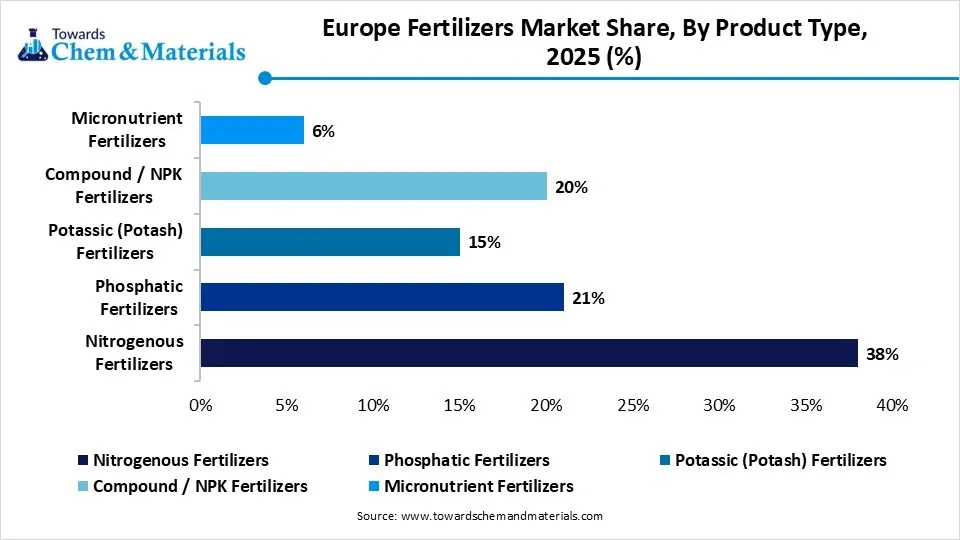
- The nitrogenous fertilizers segment dominated the market with 38% industry share in 2025 due to its consideration as the most usable fertilizer for faster plant growth. Moreover, the farmers of wheat, maize, and barley have seen under the heavy usage of nitrogenous fertilizers due to these crops needing a heavy amount of nitrogen for the yield.
- The phosphatic fertilizers segment is expected to grow at a significant rate owing to the European soil being observed to be low in phosphorus due to heavy farming practices. Moreover, by focusing on early plant growth and root strength, the phosphatic fertilizer is likely to emerge as an ideal option for future farming practices.
- The micronutrient fertilizers segment is also notably growing, akin to farmers are actively preferring micronutrient content fertilizers in recent years due to modern farming practice awareness. Moreover, several farm areas in Europe have seen low in boron, zinc, and iron, where the micronutrient fertilizers have gained major industry attention in recent years.
Europe Fertilizers Market Share, By Product Type, 2025 (%)
| By Product Type | Revenue Share, 2025 (%) |
| Nitrogenous Fertilizers | 38% |
| Phosphatic Fertilizers | 21% |
| Potassic (Potash) Fertilizers | 15% |
| Compound / NPK Fertilizers | 20% |
| Micronutrient Fertilizers | 6% |
Formulation Insights
Why does the Straight Fertilizers Segment Dominate the Europe Fertilizers Market by Formulations?
- The straight fertilizers segment dominated the market with a 34% industry share in 2025 because they are simple, affordable, and widely available. Farmers prefer using single-nutrient products like urea or ammonium nitrate for quick response and easy control. These fertilizers are ideal for large farms that manage nutrient needs separately by crop or season.
- The specialty formulations segment is expected to grow at a rapid rate because they save nutrients and reduce pollution. Controlled-release, water-soluble, and coated products feed plants slowly and efficiently, cutting nutrient losses. Europe's new "green farming" rules encourage the use of these products to protect soil and water.
- The granule fertilizers segment is also notably growing because they are easy to handle, store, and spread evenly on fields. European farmers prefer them for large-scale operations since granules can be used with modern spreaders.
- They also reduce dust and nutrient loss compared to powder types. Many companies now produce coated granules that release nutrients slowly, improving soil health and crop performance.
Europe Fertilizers Market Share, By Formulation, 2025 (%)
| By Formulation | Revenue Share, 2025 (%) |
| Straight Fertilizers | 34% |
| Complex / Compound Fertilizers | 27% |
| Specialty Formulations | 18% |
| Liquid Fertilizers | 11% |
| Granular Fertilizers | 10% |
Source Insights
How did the Synthetic/ Mineral Fertilizers Segment Dominate the Europe Fertilizers Market in 2025?
- The synthetic/mineral fertilizers segment dominated the market with 63% industry share in 2025 because they give fast and predictable results. Farmers trust them for consistent nutrient content and quick crop response.
- Europe's climate and high-yield crops depend on these products for stability and growth. Although they're not eco-friendly, improved formulas with lower emissions and precision application are making them cleaner to use.
- The biofertilizers/microbial fertilizers segment is expected to grow at a significant rate as Europe pushes for organic and low-carbon farming. These fertilizers use live microbes to improve soil health and help plants absorb nutrients naturally. They reduce chemical use, protect biodiversity, and boost soil life.
- The organic fertilizers segment is also notably growing, because farmers and consumers both want healthier soil and cleaner food. These fertilizers come from compost, manure, or plant waste, and improve soil texture over time. Organic products release nutrients slowly, reducing runoff and pollution.
Europe Fertilizers Market Share, By Source, 2025 (%)
| By Source | Revenue Share, 2025 (%) |
| Synthetic / Mineral Fertilizers | 63% |
| Organic Fertilizers | 17% |
| Biofertilizers / Microbial Fertilizers | 11% |
| Manure-Based Fertilizers | 9% |
Application Insights
How did the Cereals & Grains Segment Dominate the Europe Fertilizers Market in 2025?
- The cereals & grains segment dominated the market with 43% industry share in the 2024 market, because they cover most of Europe's farmland. Crops like wheat, barley, and corn require high nutrient input to achieve good yields.
- These crops are grown in all seasons, ensuring constant fertilizer use. Farmers depend heavily on nitrogen and phosphate-based fertilizers for strong stalks and grain development.
- The fruit & vegetables segment is expected to grow at a significant rate as consumers demand fresher, healthier, and chemical-free food. These crops need specific nutrients in small but precise amounts, driving demand for specialty and organic fertilisers. The expansion of greenhouse farming in countries like Spain, Italy, and France supports this growth.
- The oilseeds and pulses segment is also notably growing, because they help restore soil fertility and need balanced nutrition for good yields. Crops like soybeans, sunflowers, and peas are expanding due to Europe's focus on plant-based protein. Farmers are applying micronutrient-rich fertilisers to improve seed quality and oil content. The shift toward sustainable crop rotation also supports more pulse cultivation.
Europe Fertilizers Market Share, By Application, 2025 (%)
| By Application | Revenue Share, 2025 (%) |
| Cereals & Grains | 43% |
| Fruits & Vegetables | 22% |
| Oilseeds & Pulses | 18% |
| Turf, Ornamental & Landscaping | 9% |
| Others (Industrial Crops, Fodder) | 8% |
Country Insights
Germany Fertilizer Market Trends
Germany dominated the Europe fertilizers market, owing to the country's known for its heavy and technologically advanced farming sector. Moreover, the German farmers have seen under the heavy usage of the advanced equipment while following the stricter nutrient management rules in recent years. Furthermore, the presence of the major fertilizer producers is attracting greater industry buzz and investment attention in the region.
United Kingdom Fertilizer Market Analysis
United Kingdom is expected to capture a major share of the Europe fertilizers market because it's rapidly adopting smart and sustainable farming practices. Farmers of the region are investing in soil sensors, drones, and data tools to apply fertilisers more efficiently. Government incentives encourage low-carbon and organic fertilizer use, making the market shift toward greener products.
Europe Fertilizers Market Share, By Country, 2025 (%)
| By Country | Revenue Share, 2025 (%) |
| Germany | 24% |
| Russia | 22% |
| UK | 16% |
| France | 21% |
| Italy | 17% |
Recent Development
- In February 2025, Haifa North West Europe unveiled its latest water-soluble fertilizer ‘Haifa Soluble DUO’. This fertilizer doesn’t need to add extra nitrogen to increase calcium input, as per the report published by the company recently.(Source: www.haifa-group.com)
Top Vendors in the Europe Fertilizers Market & Their Offerings:
Yara International ASA
Corporate Information
- Name: Yara International ASA.
- Headquarters: Oslo, Norway.
- Founded (as its origin): 1905 (as part of Norsk Hydro).
- Listed: On the Oslo Stock Exchange as an independent company starting 25 March 2004.
- Industry: Fertilizers and crop-nutrition solutions, ammonia and nitrogenâ€based chemicals, industrial and environmental solutions.
History and Background
- Origins: Yara’s root goes back to Norsk Hydro, which in 1905 established nitrogen fertilizer production in Norway using hydroelectric power.
- Spin off: In March 2004, Yara International ASA was spun off from Norsk Hydro’s fertilizer business and listed separately.
Key Developments and Strategic Initiatives
- In 2018 2019, Yara refocused its corporate strategy around feeding the world responsibly and protecting the planet.
- Yara founded the business unit “Yara Clean Ammonia” to accelerate low emission ammonia and hydrogen economy solutions.
- Yara has initiated cost and capitalâ€expenditure reduction programmes to improve profitability and operational efficiency. For example, in July 2024 they announced plans to reduce fixed costs by USD 150 million and capex by USD 150 million by end of 2025.
Mergers & Acquisitions
- While specific large recent deals are less publicly prominent, Yara has a history of acquisitions, e.g., earlier acquisitions of fertilizer businesses in various countries (from its history).
- Divestment: As noted, in August 2024 Yara announced the divestment of its fertilizer import & distribution subsidiary in Ivory Coast as part of strategic repositioning.
Partnerships & Collaborations
- Yara engages in partnerships to advance its low emissions/ammonia initiatives (for instance, partnerships in green ammonia production and maritime shipping) though specific names aren’t detailed in the sources I located.
- They also collaborate with farmers and local actors via digital platforms and crop nutrition service models (e.g., in India, Yara India collaborates with farmer producer organizations, FPOs).
Product Launches / Innovations
- Yara provides digital farming tools (precision farming) and crop nutrition solutions designed to improve yields while reducing environmental impact.
- Yara Clean Ammonia: Yara has positioned itself to produce ammonia with significantly lower emissions, aligning to new energy/transport/maritime fuel markets.
- In India, Yara India has specialty product offerings and a network of crop nutrition centres (YCNC) to deliver next generation solutions to farmers.
Key Technology Focus Areas
- Low emission ammonia production: Yara is focusing on producing ammonia with significantly lower COâ‚‚ emissions, enabling it to serve both fertilizer and emerging clean fuel markets.
- Digital agronomy / precision farming: Using digital tools for better crop nutrition management, to optimise yield/performance and reduce environmental footprint.
R&D Organisation & Investment
- Yara operates a research centre (e.g., “Research Centre Hanninghof” in Germany) focused on plant nutrition and improved strategies for crop nutrition management.
- Investment in digital and agronomy technologies (as seen in Yara India’s Technology Centre) shows a global push into technology and services beyond commodity fertilizers.
SWOT Analysis
Strengths
- Global presence and scale: operations in 60+ countries, large fertilizer deliveries (22.9 million tonnes in recent data) gives market reach.
- Integrated business model: from production of nitrogen/ ammonia to crop nutrition and digital services. This vertical integration can create competitive advantages.
- Strong positioning in sustainability and low emission solutions: aligning with global trends (green transition) may drive future growth.
- Strong brand reputation and long history: legacy since 1905, well known in industry.
Weaknesses
- Exposure to commodity cycle volatility: Fertilizer margins depend on energy, feedstock (e.g., natural gas) prices, and global commodity/farming dynamics. As reported, e.g., strong dollar or natural gas costs can hit profitability.
- High capex and production cost sensitivity: Transition to low emission ammonia is cost intensive and requires investment.
- Complexity of global operations: Managing many countries, regulatory regimes, commodity markets could create operational risk.
Opportunities
- Growth in underserved markets: e.g., Sub Saharan Africa, Asia; improving smallholder farmer productivity, offering specialty and digital solutions.
- Transition to low carbon fertilizers and ammonia: With global push for decarbonisation, Yara’s clean ammonia ambitions can open new markets (marine fuel, hydrogen carrier).
- Precision agronomy and digital farming: Growing demand for data driven crop nutrition solutions enables premium services rather than just commodity fertilizers.
- Circular economy and specialty fertilizers: Opportunities to move up the value chain with controlled release, specialty nutrients, and soil health services.
Threats
- Regulatory and environmental risks: Fertilizer production is energy and emissions intensive; regulatory changes (carbon pricing, environmental legislation) could increase costs.
- Feedstock/energy cost volatility: For example, high natural gas prices (especially in Europe) hurt margins.
- Agricultural market risk: Farming incomes, crop prices, and weather/climate conditions impact demand for fertilizers.
- Geopolitical / supply chain disruptions: Fertilizer supply chains are global and susceptible to trade barriers, sanctions, or disruptions (e.g., Russia Ukraine conflict impacts)
- Competition: From other large fertilizer players and from emerging alternatives (biologicals, precision nutrient solutions) may erode margins.
Recent News & Strategic Updates
- On 25 April 2025, Yara reported Q1 2025 results: EBITDA excluding special items of USD 638 million (+47% vs Q1 2024), net income USD 295 million (vs USD 16 million a year earlier). Strong deliveries and margins, cost reduction program continuing.
- On 19 July 2024, Yara announced second quarter 2024 results: EBITDA excluding special items USD 513 million (vs USD 252m in Q2 2023); net income USD 3 million (vs loss of USD 298m). Program initiated to reduce fixed costs by USD 150m and capex by USD 150m by end 2025.
Other Key Players
- ICL Group: Specializes in specialty fertilizers and is a significant supplier of potash and phosphate-based products, with operations across Europe, including the Netherlands.
- CF Industries Holdings, Inc.: A global manufacturer of hydrogen and nitrogen products for fertilizer and industrial use, with a strong presence in the UK through CF Fertilisers UK Ltd.
- Grupa Azoty S.A.: A prominent Polish chemical company that offers a broad portfolio of fertilizers and operates in the controlled-release fertilizer segment (via Compo Expert).
- K+S Aktiengesellschaft: A German company with a focus on potash and salt products, essential components in some fertilizers.
- OCI Global N.V.
- EuroChem Group
- Haifa Group
- Nutrien Ltd.
- The Mosaic Company
- OCP Group S.A.
Segments Covered in the Report
By Product Type
- Nitrogenous Fertilizers
- Urea
- Ammonium Nitrate (AN)
- Ammonium Sulphate (AS)
- Calcium Ammonium Nitrate (CAN)
- Anhydrous Ammonia
- Phosphatic Fertilizers
- Diammonium Phosphate (DAP)
- Monoammonium Phosphate (MAP)
- Single Super Phosphate (SSP)
- Triple Super Phosphate (TSP)
- Potassic (Potash) Fertilizers
- Muriate of Potash (MOP)
- Sulphate of Potash (SOP)
- Compound / NPK Fertilizers
- NPK 15:15:15
- High-N Blends (20:10:10)
- High-P Blends (12:32:16)
- Micronutrient Fertilizers
- Zinc Sulphate
- Iron (Fe) Chelates
- Manganese, Copper, Boron, Molybdenum
By Formulation
- Straight Fertilizers
- Nitrogen-only
- Phosphorus-only
- Potash-only
- Complex / Compound Fertilizers
- NP Blends
- PK Blends
- NPK Compounds
- Specialty Formulations
- Controlled-Release Fertilizers (CRF)
- Slow-Release Fertilizers (SRF)
- Water-Soluble Fertilizers (WSF)
- Polymer-Coated Urea
- Liquid Fertilizers
- Liquid NPK Blends
- UAN (Urea Ammonium Nitrate) Solutions
- Granular Fertilizers
- Granular Urea
- Ammonium Nitrate Prills
By Source
- Synthetic / Mineral Fertilizers
- Chemically Synthesized Urea
- Phosphate Rock-Based Compounds
- Organic Fertilizers
-
- Compost / Vermicompost
- Organic Liquid Concentrates
- Plant-Based Organic Blends
-
- Biofertilizers / Microbial Fertilizers
- Nitrogen-Fixing (Rhizobium, Azotobacter, Azospirillum)
- Phosphate-Solubilizing (PSB)
- Potassium Mobilizing (KMB)
- Mycorrhizal Biofertilizers
- Manure-Based Fertilizers
- Poultry Manure
- Cattle Manure
- Bone Meal / Fish Emulsion
By Application
- Cereals & Grains
- Wheat
- Barley
- Maize / Corn
- Rice
- Fruits & Vegetables
- Citrus, Grapes, Apples
- Tomatoes, Potatoes, Leafy Greens
- Oilseeds & Pulses
- Soybean, Sunflower, Rapeseed
- Lentils, Peas
- Turf, Ornamental & Landscaping
- Golf Courses
- Parks & Gardens
- Ornamental Lawns
- Others (Industrial Crops, Fodder)
A Seven-Phase Framework
Our methodology is designed to be universally applicable across commodity chemicals, specialty chemicals, petrochemicals, construction chemicals, coatings, electronic chemicals, industrial gases, agrochemicals, water treatment chemicals, and performance materials. Each phase builds upon the last, creating a layered validation structure that minimizes estimation error and maximizes analytical confidence.
The framework ensures comprehensive market coverage, robust cross-validation, and reliable long-term forecasting — producing market estimates that withstand scrutiny from investors, regulators, and corporate strategy teams.

Seven-Phase Framework — Analytical Effort Distribution
Relative analytical effort allocated across each phase of the Chemicals & Materials research framework

Phase 1 - Secondary Research: Establishing the Foundation
Secondary research collects and evaluates publicly available information from authoritative sources, establishing the foundational understanding of market structure, value chain dynamics, competitive landscape, and end-use demand patterns. Every source is evaluated for credibility, recency, geographic relevance, and methodological soundness before inclusion.
Industry Associations
Sources include ACC, CEFIC, ICCA, JCIA, CPCIF, and SOCMA providing production volumes, consumption trends, capacity developments, and sustainability initiatives.
Company Disclosures
Annual reports, investor presentations, earnings transcripts, and regulatory filings reveal product portfolios, manufacturing footprints, capacity expansions, and revenue segmentation.
Government Databases
National statistical offices, customs authorities, environmental agencies, and industrial production databases provide verified statistics on output, trade flows, and regulatory compliance.
Trade Databases
UN Comtrade, ITC, Eurostat, and national customs authorities enable assessment of global product movement, import dependency, and export competitiveness across regions.
Our Secondary Research Sources
- Ministry of Chemicals and Fertilizers
- European Chemicals Agency
- United States Department of Energy
- Ministry of Industry and Information Technology
- Ministry of Economy Trade and Industry
- Ministry of Trade Industry and Energy
- National Institute of Standards and Technology
- Council of Scientific and Industrial Research
- Fraunhofer Society
- National Institute for Materials Science
Phase 2 — Supply-Side Assessment: Mapping Production Capabilities
Production Capacity Analysis
All major manufacturers are assessed for existing installed capacity, planned additions, expansions, new plant announcements, and technology adoption — mapped at global, regional, and country levels.
Capacity Utilization Adjustment
Installed capacity is adjusted using utilization rates based on demand conditions, feedstock availability, plant operating rates, maintenance schedules, and regulatory restrictions.
Manufacturer Revenue Analysis
Product-specific revenues, segment-level performance, regional distribution, average selling prices, and margin trends are evaluated to establish market value estimates.
Supply-Side Assessment — Capacity vs. Effective Production by Region
Illustrative comparison of installed capacity vs. effective production volume (after utilization rate adjustment) across major regions

Phase 3 — Demand-Side Assessment: Quantifying Chemical Consumption
Demand-side analysis quantifies chemical consumption across industries, applications, and geographies — identifying where and how chemicals are consumed throughout the value chain with precision.
End-Use Industry Analysis
Chemical demand is evaluated across automotive, construction, packaging, electronics, agriculture, healthcare, consumer goods, industrial manufacturing, energy and utilities, and water treatment. Industry output, production trends, and consumption intensity are analyzed to determine demand patterns.
Consumption Modeling
Demand is estimated using measurable indicators: kilograms per vehicle, kilograms per square meter of construction, dosage per cubic meter of water treated, kilograms per hectare of agricultural land, and kilograms per ton of manufactured products. Consumption factors are validated through industry publications and primary interviews.
Application Analysis
The market is segmented by application area to understand product performance requirements, formulation trends, technology adoption, customer preferences, and regulatory requirements improving demand accuracy and segmentation granularity.
Demand-Side Assessment — End-Use Industry Demand Distribution
Illustrative distribution of chemical & materials demand across key end-use industries

Phase 4 - Trade Flow Analysis: Balancing Regional Supply and Demand
Trade flow analysis reconciles regional supply and demand estimates through import and export data, identifying net supply positions, regional dependencies, and market imbalances. It serves as an independent validation layer that tests the consistency of supply-side and demand-side estimates.
Import Analysis
Import data is evaluated to determine volumes, source countries, product dependency, regional supply gaps, and pricing trends — identifying markets that rely heavily on external supply and where domestic production is insufficient to meet demand.
Export Analysis
Export assessments reveal production surplus, export competitiveness, regional manufacturing strength, and global market participation. Export patterns also help validate domestic production estimates and identify net exporting regions.
Apparent Consumption Model
Regional consumption is assessed using the standard apparent consumption formula:
Results identify net importing regions, net exporting regions, regional deficits, and surpluses — serving as an independent validation of supply and demand estimates.
Trade Flow Analysis — Net Supply Position by Region
Illustrative apparent consumption vs. domestic production across major regions — positive gap indicates net import dependency

Phase 5 — Primary Research: The Critical Validation Layer
Primary research tests and refines findings from secondary research through direct engagement with industry participants across the supply chain, demand side, and expert community. It captures intelligence that no database or published report can provide — the real-world experience of manufacturers, buyers, and specialists operating in the market.

Supply-Side Interviews
Conversations with chemical manufacturers, raw material suppliers, contract manufacturers, technology providers, and plant operators cover production trends, capacity utilization, pricing developments, technology shifts, and competitive dynamics.

Demand-Side Interviews
Engagement with OEMs, industrial consumers, procurement managers, distributors, formulators, and end-use manufacturers focuses on consumption trends, purchasing behavior, product substitution, demand outlook, and emerging applications.

Industry Expert Consultations
Additional interviews with industry consultants, independent experts, regulatory specialists, technical professionals, and research institutions provide deeper market context and validate key analytical assumptions.
Focus Areas of Primary Research:
Market Size & Forecast Validation
Revenue estimates, volume consumption, growth rates, forecast assumptions, regional demand.Supply Chain & Value Chain Assessment
Raw material sourcing, supply chain challenges, distribution networks, procurement practices.Production & Capacity Analysis
Manufacturing capacity, utilization rates, expansion projects, plant investments.Pricing & Cost Structure Analysis
Product pricing trends, feedstock costs, energy costs, margin pressures, pricing outlook.Competitive Landscape Assessment
Volume and value estimates confirmed to be fully consistent with one another before publicationInterview Volume by Market Scope
| Study Scope | Number of Interviews |
|---|---|
| Niche Market | 20 – 30 |
| Mid-Sized Market | 30 – 50 |
| Global Market | 50 – 80 |
| Highly Fragmented Market | 80 – 120 |
Interview Details:
Category : Manufacturers, Suppliers, Distributors, End Users, Experts/Associations
Average Duration : 30–60 Minutes
Interview Mode : Video calls, telephonic interviews, expert consultations
Interview Format : Structured / Semi-Structured questionnaire
Focus Areas of Primary Research:
Market Size & Forecast Validation :
Revenue estimates, volume consumption, growth rates, forecast assumptions, regional demand.
Supply Chain & Value Chain Assessment :
Raw material sourcing, supply chain challenges, distribution networks, procurement practices.
Production & Capacity Analysis :
Manufacturing capacity, utilization rates, expansion projects, plant investments.
Pricing & Cost Structure Analysis :
Product pricing trends, feedstock costs, energy costs, margin pressures, pricing outlook.
Competitive Landscape Assessment :
Market share, competitor positioning, strategic initiatives, partnerships, acquisitions.
Primary Research — Stakeholder Coverage by Category
Distribution of interview respondents across stakeholder categories (% share from PPT data)

Primary Research — Respondent Designation Profile
Seniority breakdown of interview respondents (% share from PPT data)

Primary Research — Geographic Coverage of Interviews
Regional distribution of primary research engagement (% share from PPT data)

Phase 6 — Data Triangulation and Market Validation
No single methodology is relied upon in isolation. Multiple independent estimation approaches are combined and reconciled to ensure consistency, accuracy, and analytical defensibility. Any material deviations between approaches are investigated and adjusted through additional validation cycles.
The final market size is derived through weighted triangulation of all validated methodologies. Any material deviations between approaches are investigated and adjusted through additional validation cycles. The outcome represents the most realistic assessment of the market based on available evidence and expert confirmation ensuring that volume and value estimates are fully consistent with one another.
Triangulation Framework — Input Contribution Weight
Relative weight each sizing input contributes to the final reconciled market estimate

Phase 7 — Forecast Modeling: Projecting Future Market Evolution
Forecasting evaluates the future trajectory of the market using a combination of quantitative indicators and qualitative assessments across economic, industry, and regulatory dimensions. Rather than simple extrapolation, each driver is independently modeled and integrated into a composite forecast.
Macroeconomic Indicators
GDP growth, industrial production, manufacturing output, construction activity, consumer spending, and capital investment form the quantitative foundation of long-term demand projections. These are applied at country, regional, and global levels.
Industry Growth Drivers
Urbanization, infrastructure development, industrialization, technological innovation, sustainability initiatives, and evolving product performance requirements are assessed at regional and industry levels — capturing both structural and cyclical demand drivers.
Capacity Expansion Analysis
Announced plant expansions, new manufacturing facilities, technology upgrades, and strategic investments are evaluated to determine future supply-demand dynamics and potential market tightness or oversupply situations.
Regulatory & Sustainability
Environmental regulations, chemical safety standards, emission reduction targets, circular economy initiatives, and sustainability requirements are incorporated as they often influence product adoption rates and market growth trajectories.
Scenario Forecast Range — Indexed Market Growth (Year 1–10)
Illustrative indexed growth trajectories across Base, Optimistic, and Pessimistic scenarios over a 10-year forecast horizon

Forecast Drivers — Relative Impact Score by Category
Impact score (0–100) of each driver type on chemicals & materials market forecast




Comments
Share your thoughts, ask a question, or provide feedback about this report.