
Composites Market Size Analysis Report 2035
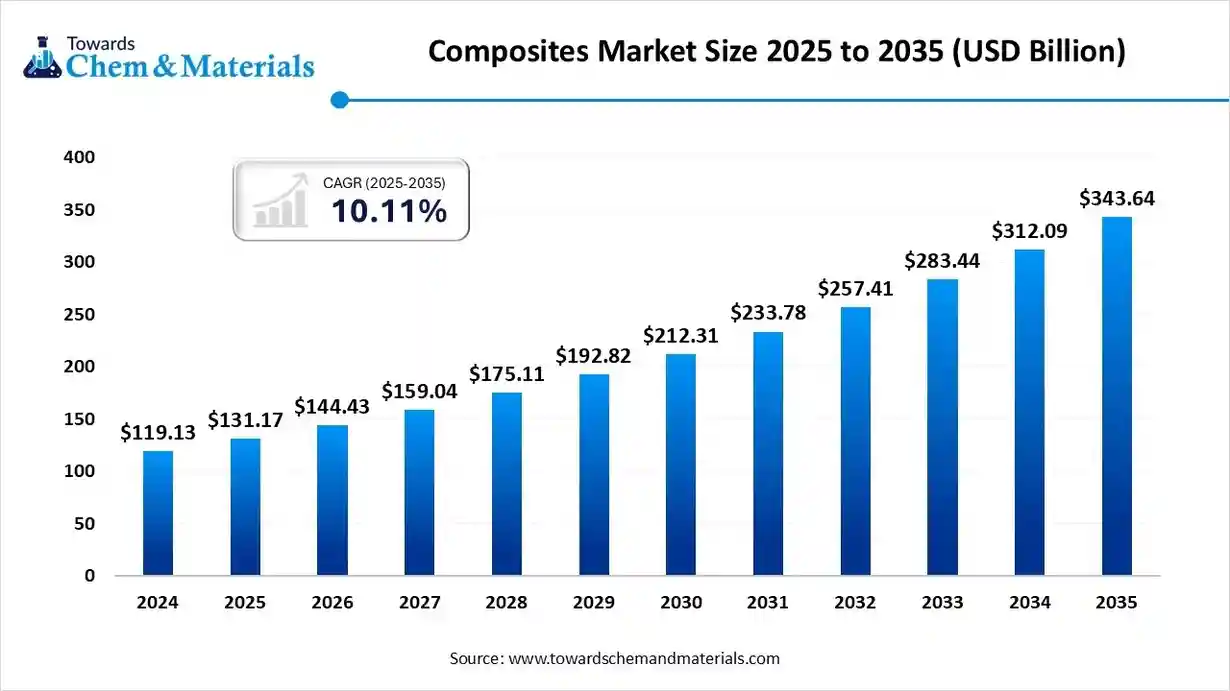
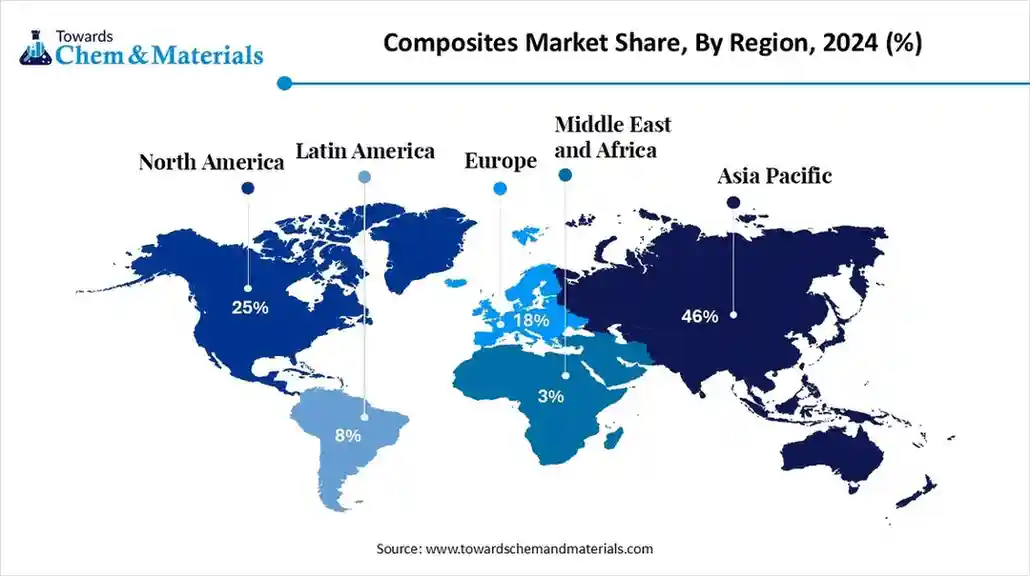
The global composites market size accounted for USD 131.17 billion in 2025 and is predicted to increase from USD 144.43 billion in 2026 to approximately USD 343.64 billion by 2035, growing at a CAGR of 10.11% from 2025 to 2035. Asia Pacific dominated the composites market with a market share of 46% the global market in 2024. The growing demand for high-performance and lightweight materials is the key factor driving market growth. Also, growing use of composites in electric vehicles (EVs), coupled with the innovations in manufacturing and automation, can fuel market growth further.
Key Takeaways
- By region, Asia Pacific dominated the market with a 46% share in 2024 and is expected to grow at the fastest CAGR of nearly 7.4% over the forecast period.
- By region, North America is expected to grow at a notable CAGR over the forecast period.
- By fiber type, the glass fiber segment dominated the market with a 61% share in 2024.
- By fiber type, the carbon fiber segment is expected to grow at the fastest CAGR of nearly 8.5% over the forecast period.
- By resin type, the thermoset resins segment held an approximately 60% market share in 2024.
- By resin type, the thermoplastic resins segment is expected to grow at the fastest CAGR of approximate 7.9% over the forecast period.
- By product, the prepreg materials segment held a 46.9% market share in 2024.
- By product, the molded composites segment is expected to grow at the fastest CAGR of nearly 6.7 % over the forecast period.
- By end-use industry, the automotive & transportation segment dominated the market with a 25.4% share in 2024.
- By end-use industry, the wind energy segment is expected to grow at the fastest CAGR of nearly 8.9% during the projected period.
- By performance class, the commodity composites segment held approximately 58% market share in 2024.
- By performance class, the advanced composites segment is expected to grow at the fastest CAGR of approximately 9.2% during the study period.
What are Composites?
The market continues to expand through automation, additive manufacturing, and recycling technologies, with Asia-Pacific leading in production and global demand growth. The global composites market encompasses engineered materials composed of two or more constituent phases, typically fibers and a polymer matrix, designed to provide a superior strength-to-weight ratio, stiffness, corrosion resistance, and durability compared to conventional materials. It includes glass, carbon, aramid, and other fibers combined with thermoset and thermoplastic resin systems, offered in various forms such as prepregs, molded parts, laminates, and pultruded profiles.
Global Composites Market Outlook:
- Industry Growth Overview: Composites are used widely across automotive, aerospace, wind energy, construction, marine, and electrical industries, driven by lightweighting initiatives, renewable energy investments, and demand for high-performance materials.
- Sustainability Trends: The key sustainability trend in the market includes increasing utilisation of bio-based and recycled materials and innovations in recycling technologies for composites.
- Major Investors: Major market players in the market include a large established company, such as Teijin Ltd., Hexcel Corporation, and Owens Corning. These companies operate across the globe, supplying materials for various sectors such as automotive and aerospace.
Report Scope
| Report Attributes | Details |
| Market Size in 2026 | USD 144.43 Billion |
| Expected Size by 2035 | USD 343.64 Billion |
| Growth Rate from 2025 to 2035 | CAGR 10.11% |
| Base Year of Estimation | 2024 |
| Forecast Period | 2025 - 2035 |
| Leading Region | Asia Pacific |
| Fastest Growing Region | North America |
| Segment Covered | By Fiber Type, By Resin Type, By Product , By End-Use Industry, By Performance Class, By Region |
| Key Companies Profiled | Teijin Ltd., Owens Corning, PPG Industries, Inc., Huntsman Corporation LLC, SGL Group, Hexcel Corporation, DuPont, Compagnie de Saint-Gobain S.A., Weyerhaeuser Company, Momentive Performance Materials, Inc., Cytec Industries (Solvay, S.A.), China Jushi Co., Ltd., Kineco Limited, Veplas Group |
How Cutting Edge Technologies are revolutionizing the Global Composites Market?
Advanced technologies are transforming the market through cutting-edge manufacturing methods, digitalization, and automation. Advancements such as automated fiber placement and 3D printing minimize waste and increase efficiency, while Artificial intelligence -driven digital twins and quality control can enhance consistency and lower overall product costs.
Trade Analysis of Global Composites Market: Import & Export Statistics:
- From June 2024 to May 2025, the US imported 269 shipments of carbon fiber, a 28% increase from the previous year, with 82 exporters and 129 buyers.
- In May 2025 alone, world imports were 35 shipments, which showed no year-on-year growth and no sequential increase from April 2025.
- In March 2025, China's carbon fiber product exports reached 1,545.76 tons, up 64.47% year-on-year and 118.86% month-on-month, driven by significant exports of carbon fiber (426.74 tons), carbon fiber fabric (268.11 tons), carbon fiber prepreg (126.34 tons), and other products (724.57 tons).
Global Composites Market Value Chain Analysis
- Feedstock Procurement : It is the process of sourcing and acquiring the necessary raw and intermediate materials required to manufacture composite products.
- Chemical Synthesis and Processing: It refers to the technologies and methods used to create the constituent materials of composites.
- Packaging and Labelling: It generally covers the crucial aspects of how composite products are contained, protected, and identified over the supply chain.
- Regulatory Compliance and Safety Monitoring :It involves adhering to market-specific regulations using innovative technologies to ensure the reliability, quality, and safety of composite materials.
Global Composites Market 's Regulatory Landscape: Global Regulations
| Country/Region | Key Regulations |
| North America (Primarily USA) | The Federal Aviation Administration (FAA) oversees rigorous certification processes. The use of composites requires extensive quality testing and compliance with specific standards (e.g., ASTM, ISO, and other industry-specific accreditations) to ensure safety and performance. |
| Europe (European Union, UK, etc.) | Strict carbon emission regulations (e.g., a target of 95g/km of CO2 for new cars, with further reductions mandated) drive the adoption of lightweight composites in the transport sector. |
| Asia-Pacific (Primarily China, India, Japan) | The region benefits from strong government support and initiatives, such as India's "Smart Cities Mission" and China's focus on renewable energy and infrastructure upgrades. |
Segmental Insights
Fiber Type Insights
How Much Share Did the Glass Fiber Segment Held in 2024?
- The glass fiber segment dominated the market with a 61% share in 2024. The dominance of the segment can be attributed to the growing investment in infrastructure and the increasing need for durable and sustainable materials. Glass fiber composites provide exceptional durability and resistance to corrosion, which makes them a key choice in the market.
- The carbon fiber segment is expected to grow at the fastest CAGR of nearly 8.5% over the forecast period. The growth of the segment can be credited to the increasing product demand from the automotive and aerospace industries for high-strength and lightweight materials, coupled with the rising demand for high-pressure storage solutions for applications like CNG and hydrogen.
- The aramid fiber segment held a significant market share in 2024. The growth of the segment is driven by the strong preference for materials that minimize weight without compromising strength. These fibers are known for their high tensile strength, toughness, and resistance to corrosion and high temperatures.
- The natural & basalt fibers are one of the major segments in the market, expanding due to the rapid development of natural fiber composites to fulfill green standards, innovations in technology like enhanced manufacturing and R&D for low-cost composite grades.
Resin Type Insights
Which Resin Type Segment Dominated the Global Composites Market in 2024?
- The thermoset resins segment held an approximately 60% market share in 2024. The dominance of the segment can be linked to the rapid growth of the wind energy sector, particularly in the Asia-Pacific region, and the growing use of thermoset resins in military aircraft, where the strength-to-weight ratio is crucial.
- The thermoplastic resins segment is expected to grow at the fastest CAGR of 7.9% over the forecast period. The growth of the segment can be driven by ongoing innovations in material science, increasing environmental concerns, faster processing times, and enhanced recyclability of these resins.
- The growth of hybrid resin systems is fuelled by their ability to combine high-performance fibers with more cost-efficient fibers, which enables manufacturers to achieve the required performance at a lower price. This type of resin offers the combined benefits of different fiber and resin types.
Product Insights
Which Product Type Segment Dominated the Global Composites Market in 2024?
- The prepreg materials segment held a 46.9% market share in 2024. The dominance of the segment is owed to the increasing demand for durable and strong materials for manufacturing long wind turbine blades. Prepregs enable weight reduction, which can improve overall vehicle performance.
- The molded composites segment is expected to grow at the fastest CAGR of nearly 6.7 % over the forecast period. The growth of the segment is due to rapid infrastructure development and industrialization, especially in regions such as the Asia-Pacific. Advancements in production processes can impact positive segment growth soon.
- The pultruded profiles segment is one of the major segments in the market. The growth of the segment is boosted by growing investment in infrastructure projects and civil engineering across the globe. Pultruded profiles give exceptional durability and resistance to corrosion.
- The growth of the laminates & sheets segment is propelled by a growing emphasis on environmental responsibility, and stricter regulations are supporting the use of recyclable and sustainable composite materials.
- These laminates and sheets are preferred over conventional materials such as metals and concrete.
End-Use Industry Insights
Which End-Use Industry Type Segment Dominated the Global Composites Market in 2024?
- The automotive & transportation segment dominated the market with a 25.4% share in 2024. The dominance of the segment can be attributed to the growing demand for fuel-efficient, lightweight vehicles due to strict environmental regulations. Growth in the middle-class population is also positively impacting segment expansion.
- The wind energy segment is expected to grow at the fastest CAGR of nearly 8.9% during the projected period. The growth of the segment can be credited to the rapid development of offshore wind farms, which necessitate materials that can withstand harsh environmental conditions, leading to segment growth.
- The aerospace & defense segment held a significant market share in 2024. The growth of the segment can be driven by the growing demand for lightweight materials to reduce emissions and enhance fuel efficiency. Also, the expanding space exploration industry creates new avenues for composite materials in spacecraft.
- The growth of the marine segment is fuelled by the growing popularity of recreational boating, innovations in composite manufacturing technologies like 3D printing, and the growth of offshore wind energy projects. The expanding offshore wind sectors need durable, large, and corrosion-resistant composite materials.
Performance Class Insights
How Much Share Did the Commodity Composites Segment Held in 2024?
- The commodity composites segment held approximately 58% market share in 2024. The dominance of the segment can be linked to the surge in environmental regulations and the ongoing push towards energy efficiency. Advancements in production processes are enhancing overall efficiency by reducing production costs.
- The advanced composites segment is expected to grow at the fastest CAGR of approximately 9.2% during the study period. The growth of the segment can be driven by increasing investment in R&D, rapid urbanization and industrialization, and advancements in manufacturing processes, such as automated fiber placement (AFP).
- The engineering composites segment held a substantial market share in 2024. The growth of the segment is driven by rising demand for enhanced fuel efficiency and reduced emissions, coupled with the desire for enhanced durability and strength.
Regional Insights
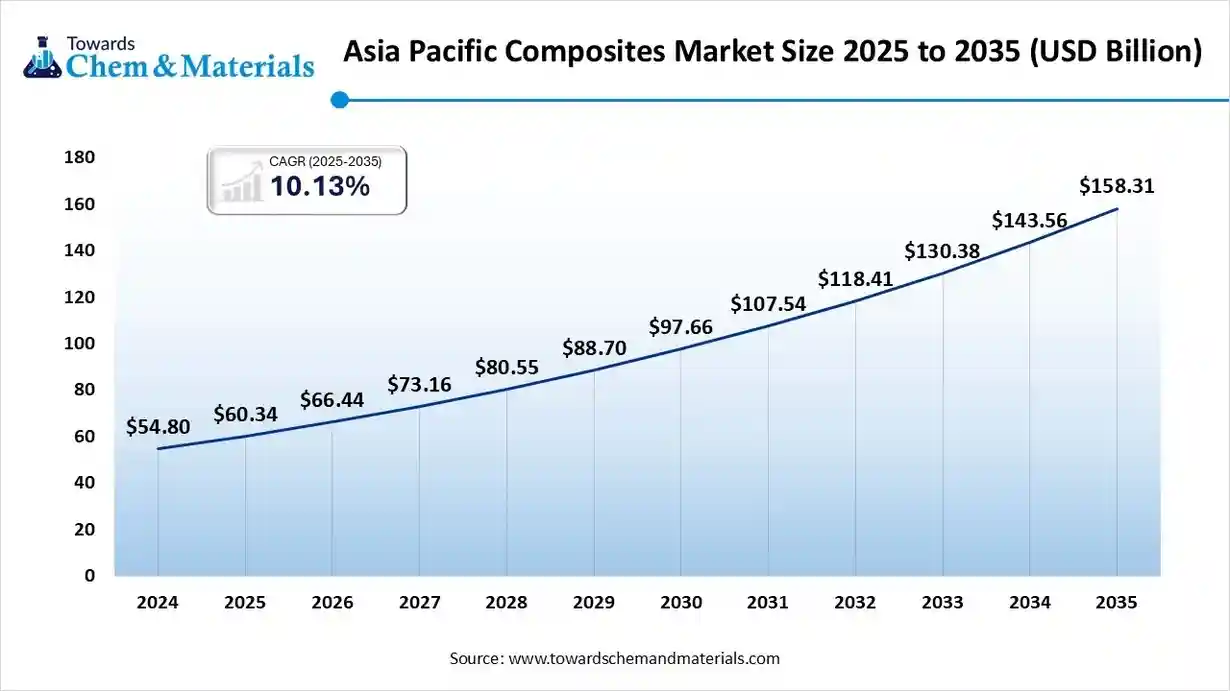
The Asia Pacific composites market size was valued at USD 60.34 billion in 2025 and is expected to surpass around USD 158.31 billion by 2035, expanding at a compound annual growth rate (CAGR) of 10.13% over the forecast period from 2025 to 2035. Asia Pacific dominated the market with a 46% share in 2024 and is expected to grow at the fastest CAGR of nearly 7.4% over the forecast period.
The dominance and growth of the region can be attributed to the ongoing infrastructure development, industrialization, and expanding automotive sector. In addition, significant private and government investment in infrastructure increases the demand for lightweight and durable composites.
India Global Composites Market Trends
In the Asia Pacific, India held a significant market share in 2024, owing to the growing product demand from major sectors such as renewable energy, automotive, and infrastructure. Also, the initiatives such as Smart Cities Mission and the PM Awas Yojana are fuelling market expansion in the country further.
North America is expected to grow at a notable CAGR over the forecast period. The growth of the region can be credited to the strong composites demand from the automotive and aerospace industries, supported by robust R&D capabilities. Composites are crucial for manufacturing wind turbine blades, which makes them a major market driver.
U.S. Global Composites Market Trends
In North America, the U.S. led the market due to innovations in production technologies, along with the increasing consumer push for fuel-efficient and more sustainable products. The growth of the wind energy industry will impact positive market expansion soon.
Europe held a significant market share in 2024. The growth of the region is driven by the growing demand for lightweight materials to enhance performance and fuel efficiency. Government initiatives are pushing industries towards more bio-based composites and materials with a smaller carbon footprint.
Germany Global Composites Market Trends
In Europe, Germany dominated the market due to increasing emphasis on developing and manufacturing electric vehicles for more innovative polymer composites to save energy. The country's robust automotive sector uses composites to minimize vehicle weight, which enhances fuel efficiency.
The growth of the Latin American market is driven by the growth of the construction and automotive sectors, coupled with the rising demand for advanced materials with properties such as high strength-to-weight ratios and corrosion resistance. Global investments in renewable energy are fuelling demand for composites in wind turbine blades.
Brazil Global Composites Market Trends
Brazil is one of the major countries in Latin America. The growth of the county can be fuelled by increasing demand for lightweight, high-performance, and durable materials across major key industries, supported by increasing emphasis on sustainability and technological innovations.
The composites market in the Middle East & Africa (MEA) region is witnessing solid growth, fueled by rising infrastructure development, automotive and aerospace expansion, and a push towards lightweight, high-performance materials.
Governments across the Gulf Cooperation Council (GCC) are promoting lightweight, durable materials to enhance sustainability and efficiency in large-scale infrastructure and energy projects, including wind and solar power. Countries like the UAE and Saudi Arabia are leading with growing demand for carbon and glass fiber composites in construction and transport.
Saudi Arabia Composites Market Trends
In Saudi Arabia, the composites materials market is gaining strong traction as the Kingdom pursues large-scale infrastructure, renewable energy, aerospace and automotive goals under its Vision 2030 agenda. Key drivers include mega-projects such as NEOM and the Red Sea Project, demand for lightweight, corrosion-resistant materials in harsh climates, and government support for localisation and advanced manufacturing.
Recent Developments
- In May 2025, Tata AutoComp and Katcon Global announced the launch of their latest joint venture in Mexico to produce innovative composite materials, emphasizing the North American market. The venture will manufacture lightweight components for commercial and passenger vehicles.(Source: www.autocarpro.in)
- In July 2025, Materi'act unveils NAFILean Vision, a recyclable bio composite made from recycled plastics fortified with 20% hemp fibers. It also offers a ready-to-use solution that combines aesthetic excellence with mechanical strength.(Source: www.compositesworld.com )
Top Composites Market Companies
Toray Industries, Inc.
Corporate Information
- Name: Toray Industries, Inc.
- Established: January 1926
- Headquarters: Nihonbashi Mitsui Tower, 1 1 Nihonbashi Muromachi 2 chome, ChūŠku, Tokyo 103 8666, Japan
Paid in Capital (as of March 31 2025): ¥147,873 million
History and Background
- Toray began in 1926 primarily as a synthetic textile (rayon yarn) company.
- Over time it expanded into many other fields: fibers & textiles, plastic films/resins, carbon fiber composites, electronics & information materials, water treatment/environmental technology, and life science.
Key Developments and Strategic Initiatives
Toray’s medium term management programme is titled Project AP G 2025: a strategy to drive “innovation and resilience management” and to shift the business toward higher value, growth domains.
The company emphasises two growth engines: Sustainability Innovation (SI) and Digital Innovation (DI).
Mergers & Acquisitions
- The acquisition of Zoltek (US carbon fiber maker) allowed Toray to expand its large volume, cost competitive carbon fiber offering.
- In 2024 (November) Toray Advanced Composites acquired assets of Gordon Plastics (Englewood, Colorado) to strengthen continuous fiber reinforced thermoplastic composites.
Partnerships & Collaborations
- In July 2024: Toray entered an MOU with Elevated Materials to repurpose scrap prepregs and move toward circular economy in carbon fiber composites.
- September 2025: Toray entered a joint venture with MAS Holdings (South Asia’s large apparel manufacturer) to establish a manufacturing facility in Odisha, India, targeting high quality textiles and innovative solutions.
Product Launches / Innovations
- Toray developed a recycling technology for composite materials: able to decompose various CFRP materials (thermosetting resins) while preserving fiber strength and surface quality.
- The adoption of a mass balance approach for its TORAYLON™ acrylic staple fiber (from April 2025) to include biomass and plastic waste derived feedstocks, with ISCC PLUS certification.
Key Technology Focus Areas
- Core technology domains: organic synthetic chemistry, polymer chemistry, biotechnology, nanotechnology.
- Mobility and lightweighting (automotive, aerospace), high performance resins/films, water treatment membranes, bio based fibers.
R&D Organisation & Investment
- Toray has centralized its R&D functions into a single Technology Centre to drive cross business innovation.
- R&D investment target: ¥220 billion over three years (FY2023–2025), with >80% of that allocated to growth business fields (SI and DI).
- The “R&D Innovation Center for the Future” established in 2019 to push material technologies, medical/regenerative medicine, digital technologies.
SWOT Analysis
Strengths:
- World leading carbon fiber and composite materials business; full value chain capability.
- Strong technology base across materials, chemistry, fibres, nanotech.
- Global reach: large scale manufacturing, broad product portfolio, many subsidiaries worldwide.
- Spending heavily on R&D and innovation pushing into future growth areas (mobility, sustainability, digital).
Weaknesses:
- Diversified portfolio means exposure to many sectors (textiles, fibres) which may have slower growth or commoditization risk.
- High capex and R&D spending may pressure margins if innovations don’t convert quickly.
- In 2017, Toray admitted data falsification issues in tire cord tests (which is older but still a reputational note).
Opportunities:
- Growth of lightweight composites especially in automotive (EVs), aerospace, wind energy.
- Sustainability and circular economy: recycled carbon fiber, bio based fibers, mass balance approaches.
- Digital innovations in materials design and manufacturing processes (AI, sensor, analytics).
- Emerging markets expansion (e.g., joint venture in India) and new geographies.
Threats:
- Commodity pressure on raw materials/resins, cyclicality of automotive and aerospace markets.
- Intense competition from other composites/materials players (e.g., Hexcel, SGL, Teijin) and substitutes (glass fiber, aluminium).
- Supply chain disruptions (e.g., from pandemics, energy shortages) given the global footprint.
- Regulatory risks: sustainability regulations, carbon emissions, waste management – while also opportunity.
Technological change risk: if competitors leap frog in composite technologies or process cost reduction.
Recent News & Strategic Updates
- March 12 2025: Toray announced adoption of mass balance approach for TORAYLON™ acrylic staple fiber manufacturing, moving to bio based/waste derived feedstock.
- September 2025: Joint venture between Toray Industries and MAS Holdings in India (Toray MAS Apparel India) announced to build new manufacturing facility in Odisha for textiles and innovative material solutions.
Other Top Companies in the Market

- Teijin Ltd.: Teijin Ltd. is a significant player in the global composites market, primarily known for its high-performance materials like carbon fiber and innovative composite solutions for the automotive sector.
- Owens Corning: Owens Corning supplies glass fiber reinforcements and composite materials, driving innovations in automotive, construction, and industrial applications globally.
- PPG Industries, Inc.
- Huntsman Corporation LLC
- SGL Group
- Hexcel Corporation
- DuPont
- Compagnie de Saint-Gobain S.A.
- Weyerhaeuser Company
- Momentive Performance Materials, Inc.
- Cytec Industries (Solvay, S.A.)
- China Jushi Co., Ltd.
- Kineco Limited
- Veplas Group
Segments Covered in the Report
By Fiber Type
- Glass Fiber
- E-glass
- S-glass
- Woven Roving
- Carbon Fiber
- PAN-based Carbon
- Recycled Carbon
- Aramid Fiber
- Kevlar
- Twaron
- Natural & Basalt Fibers
- Basalt Fiber
- Flax Fiber
By Resin Type
- Thermoset Resins
- Epoxy
- Polyester
- Vinyl Ester
- Thermoplastic Resins
- Polyamide (PA)
- PEEK
- PPS
- Hybrid Resin Systems
- Thermoset–Thermoplastic Hybrids
- Modified Epoxy Blends
By Product
- Prepreg Materials
- Fiber-Resin Pre-impregnated Sheets
- Autoclave-Ready Rolls
- Molded Composites
- SMC/BMC Molds
- Injection Molded Long-Fiber Parts
- Pultruded Profiles
- Rods
- Beams
- Laminates & Sheets
- Multi-layer Panels
- Sandwich Structures
By End-Use Industry
- Automotive & Transportation
- Body Panels
- Structural Parts
- Aerospace & Defense
- Airframe Structures
- Interior Components
- Wind Energy
- Turbine Blades
- Nacelle Covers
- Construction & Infrastructure
- Rebars
- Panels & Facades
- Marine
- Boat Hulls
- Decks
- Electrical & Electronics
- Enclosures
- Insulators
By Performance Class
- Commodity Composites
- Glass Fiber / Polyester
- Basic Reinforced Plastics
- Engineering Composites
- Enhanced Glass / Epoxy Systems
- Mid-Grade Thermoplastic Compounds
- Advanced Composites
- Carbon / Aramid with High-Performance Resins
- PEEK and PPS-Based Systems
By Region
- North America
- U.S.
- Canada
- Mexico
- Europe
- Germany
- UK
- France
- Italy
- Spain
- Asia Pacific
- China
- India
- Japan
- South Korea
- Latin America
- Brazil
- Argentina
- Middle East & Africa
- Saudi Arabia
- South Africa
A Seven-Phase Framework
Our methodology is designed to be universally applicable across commodity chemicals, specialty chemicals, petrochemicals, construction chemicals, coatings, electronic chemicals, industrial gases, agrochemicals, water treatment chemicals, and performance materials. Each phase builds upon the last, creating a layered validation structure that minimizes estimation error and maximizes analytical confidence.
The framework ensures comprehensive market coverage, robust cross-validation, and reliable long-term forecasting — producing market estimates that withstand scrutiny from investors, regulators, and corporate strategy teams.

Seven-Phase Framework — Analytical Effort Distribution
Relative analytical effort allocated across each phase of the Chemicals & Materials research framework

Phase 1 - Secondary Research: Establishing the Foundation
Secondary research collects and evaluates publicly available information from authoritative sources, establishing the foundational understanding of market structure, value chain dynamics, competitive landscape, and end-use demand patterns. Every source is evaluated for credibility, recency, geographic relevance, and methodological soundness before inclusion.
Industry Associations
Sources include ACC, CEFIC, ICCA, JCIA, CPCIF, and SOCMA providing production volumes, consumption trends, capacity developments, and sustainability initiatives.
Company Disclosures
Annual reports, investor presentations, earnings transcripts, and regulatory filings reveal product portfolios, manufacturing footprints, capacity expansions, and revenue segmentation.
Government Databases
National statistical offices, customs authorities, environmental agencies, and industrial production databases provide verified statistics on output, trade flows, and regulatory compliance.
Trade Databases
UN Comtrade, ITC, Eurostat, and national customs authorities enable assessment of global product movement, import dependency, and export competitiveness across regions.
Our Secondary Research Sources
- Ministry of Chemicals and Fertilizers
- European Chemicals Agency
- United States Department of Energy
- Ministry of Industry and Information Technology
- Ministry of Economy Trade and Industry
- Ministry of Trade Industry and Energy
- National Institute of Standards and Technology
- Council of Scientific and Industrial Research
- Fraunhofer Society
- National Institute for Materials Science
Phase 2 — Supply-Side Assessment: Mapping Production Capabilities
Production Capacity Analysis
All major manufacturers are assessed for existing installed capacity, planned additions, expansions, new plant announcements, and technology adoption — mapped at global, regional, and country levels.
Capacity Utilization Adjustment
Installed capacity is adjusted using utilization rates based on demand conditions, feedstock availability, plant operating rates, maintenance schedules, and regulatory restrictions.
Manufacturer Revenue Analysis
Product-specific revenues, segment-level performance, regional distribution, average selling prices, and margin trends are evaluated to establish market value estimates.
Supply-Side Assessment — Capacity vs. Effective Production by Region
Illustrative comparison of installed capacity vs. effective production volume (after utilization rate adjustment) across major regions

Phase 3 — Demand-Side Assessment: Quantifying Chemical Consumption
Demand-side analysis quantifies chemical consumption across industries, applications, and geographies — identifying where and how chemicals are consumed throughout the value chain with precision.
End-Use Industry Analysis
Chemical demand is evaluated across automotive, construction, packaging, electronics, agriculture, healthcare, consumer goods, industrial manufacturing, energy and utilities, and water treatment. Industry output, production trends, and consumption intensity are analyzed to determine demand patterns.
Consumption Modeling
Demand is estimated using measurable indicators: kilograms per vehicle, kilograms per square meter of construction, dosage per cubic meter of water treated, kilograms per hectare of agricultural land, and kilograms per ton of manufactured products. Consumption factors are validated through industry publications and primary interviews.
Application Analysis
The market is segmented by application area to understand product performance requirements, formulation trends, technology adoption, customer preferences, and regulatory requirements improving demand accuracy and segmentation granularity.
Demand-Side Assessment — End-Use Industry Demand Distribution
Illustrative distribution of chemical & materials demand across key end-use industries

Phase 4 - Trade Flow Analysis: Balancing Regional Supply and Demand
Trade flow analysis reconciles regional supply and demand estimates through import and export data, identifying net supply positions, regional dependencies, and market imbalances. It serves as an independent validation layer that tests the consistency of supply-side and demand-side estimates.
Import Analysis
Import data is evaluated to determine volumes, source countries, product dependency, regional supply gaps, and pricing trends — identifying markets that rely heavily on external supply and where domestic production is insufficient to meet demand.
Export Analysis
Export assessments reveal production surplus, export competitiveness, regional manufacturing strength, and global market participation. Export patterns also help validate domestic production estimates and identify net exporting regions.
Apparent Consumption Model
Regional consumption is assessed using the standard apparent consumption formula:
Results identify net importing regions, net exporting regions, regional deficits, and surpluses — serving as an independent validation of supply and demand estimates.
Trade Flow Analysis — Net Supply Position by Region
Illustrative apparent consumption vs. domestic production across major regions — positive gap indicates net import dependency

Phase 5 — Primary Research: The Critical Validation Layer
Primary research tests and refines findings from secondary research through direct engagement with industry participants across the supply chain, demand side, and expert community. It captures intelligence that no database or published report can provide — the real-world experience of manufacturers, buyers, and specialists operating in the market.

Supply-Side Interviews
Conversations with chemical manufacturers, raw material suppliers, contract manufacturers, technology providers, and plant operators cover production trends, capacity utilization, pricing developments, technology shifts, and competitive dynamics.

Demand-Side Interviews
Engagement with OEMs, industrial consumers, procurement managers, distributors, formulators, and end-use manufacturers focuses on consumption trends, purchasing behavior, product substitution, demand outlook, and emerging applications.

Industry Expert Consultations
Additional interviews with industry consultants, independent experts, regulatory specialists, technical professionals, and research institutions provide deeper market context and validate key analytical assumptions.
Focus Areas of Primary Research:
Market Size & Forecast Validation
Revenue estimates, volume consumption, growth rates, forecast assumptions, regional demand.Supply Chain & Value Chain Assessment
Raw material sourcing, supply chain challenges, distribution networks, procurement practices.Production & Capacity Analysis
Manufacturing capacity, utilization rates, expansion projects, plant investments.Pricing & Cost Structure Analysis
Product pricing trends, feedstock costs, energy costs, margin pressures, pricing outlook.Competitive Landscape Assessment
Volume and value estimates confirmed to be fully consistent with one another before publicationInterview Volume by Market Scope
| Study Scope | Number of Interviews |
|---|---|
| Niche Market | 20 – 30 |
| Mid-Sized Market | 30 – 50 |
| Global Market | 50 – 80 |
| Highly Fragmented Market | 80 – 120 |
Interview Details:
Category : Manufacturers, Suppliers, Distributors, End Users, Experts/Associations
Average Duration : 30–60 Minutes
Interview Mode : Video calls, telephonic interviews, expert consultations
Interview Format : Structured / Semi-Structured questionnaire
Focus Areas of Primary Research:
Market Size & Forecast Validation :
Revenue estimates, volume consumption, growth rates, forecast assumptions, regional demand.
Supply Chain & Value Chain Assessment :
Raw material sourcing, supply chain challenges, distribution networks, procurement practices.
Production & Capacity Analysis :
Manufacturing capacity, utilization rates, expansion projects, plant investments.
Pricing & Cost Structure Analysis :
Product pricing trends, feedstock costs, energy costs, margin pressures, pricing outlook.
Competitive Landscape Assessment :
Market share, competitor positioning, strategic initiatives, partnerships, acquisitions.
Primary Research — Stakeholder Coverage by Category
Distribution of interview respondents across stakeholder categories (% share from PPT data)

Primary Research — Respondent Designation Profile
Seniority breakdown of interview respondents (% share from PPT data)

Primary Research — Geographic Coverage of Interviews
Regional distribution of primary research engagement (% share from PPT data)

Phase 6 — Data Triangulation and Market Validation
No single methodology is relied upon in isolation. Multiple independent estimation approaches are combined and reconciled to ensure consistency, accuracy, and analytical defensibility. Any material deviations between approaches are investigated and adjusted through additional validation cycles.
The final market size is derived through weighted triangulation of all validated methodologies. Any material deviations between approaches are investigated and adjusted through additional validation cycles. The outcome represents the most realistic assessment of the market based on available evidence and expert confirmation ensuring that volume and value estimates are fully consistent with one another.
Triangulation Framework — Input Contribution Weight
Relative weight each sizing input contributes to the final reconciled market estimate

Phase 7 — Forecast Modeling: Projecting Future Market Evolution
Forecasting evaluates the future trajectory of the market using a combination of quantitative indicators and qualitative assessments across economic, industry, and regulatory dimensions. Rather than simple extrapolation, each driver is independently modeled and integrated into a composite forecast.
Macroeconomic Indicators
GDP growth, industrial production, manufacturing output, construction activity, consumer spending, and capital investment form the quantitative foundation of long-term demand projections. These are applied at country, regional, and global levels.
Industry Growth Drivers
Urbanization, infrastructure development, industrialization, technological innovation, sustainability initiatives, and evolving product performance requirements are assessed at regional and industry levels — capturing both structural and cyclical demand drivers.
Capacity Expansion Analysis
Announced plant expansions, new manufacturing facilities, technology upgrades, and strategic investments are evaluated to determine future supply-demand dynamics and potential market tightness or oversupply situations.
Regulatory & Sustainability
Environmental regulations, chemical safety standards, emission reduction targets, circular economy initiatives, and sustainability requirements are incorporated as they often influence product adoption rates and market growth trajectories.
Scenario Forecast Range — Indexed Market Growth (Year 1–10)
Illustrative indexed growth trajectories across Base, Optimistic, and Pessimistic scenarios over a 10-year forecast horizon

Forecast Drivers — Relative Impact Score by Category
Impact score (0–100) of each driver type on chemicals & materials market forecast




Comments
Share your thoughts, ask a question, or provide feedback about this report.