
Biopharma Plastic Market Size, Competitive Landscape Analysis Report 2035
The global biopharma plastic market size was valued at USD 11.54 billion in 2025, is estimated to reach USD 13.02 billion in 2026, and is projected to reach USD 38.66 billion by 2035, exhibiting a compound annual growth rate (CAGR) of 12.85% over the forecast period from 2026 to 2035.North America dominated the biopharma plastic market with the largest revenue share of 39% in 2025 and is expected to grow at the fastest CAGR of 13.00% during the forecast period. In terms of volume, the biopharma plastic market is projected to grow from 2.88 million tons in 2025 to 8.90 million tons by 2035. growing at a CAGR of 11.95% from 2026 to 2035.The growth of the market is driven by the rising demand for biologics, cell therapies, and vaccines. Companies also need eco-friendly plastics and better cold-chain logistics to move sensitive drugs. The key collaborations between companies like BioPhorum Waste Initiative, Lop Industries, and Bormioli Pharma, Green Pharma Horizon Projects further drive the growth of the market, according to the latest report.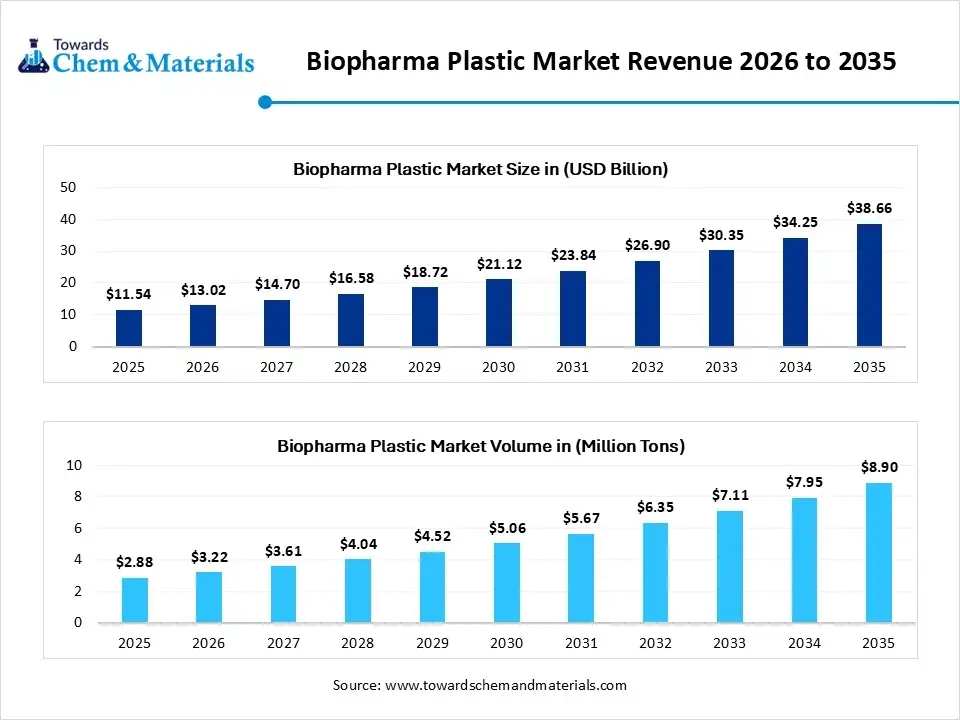
Key Takeaways
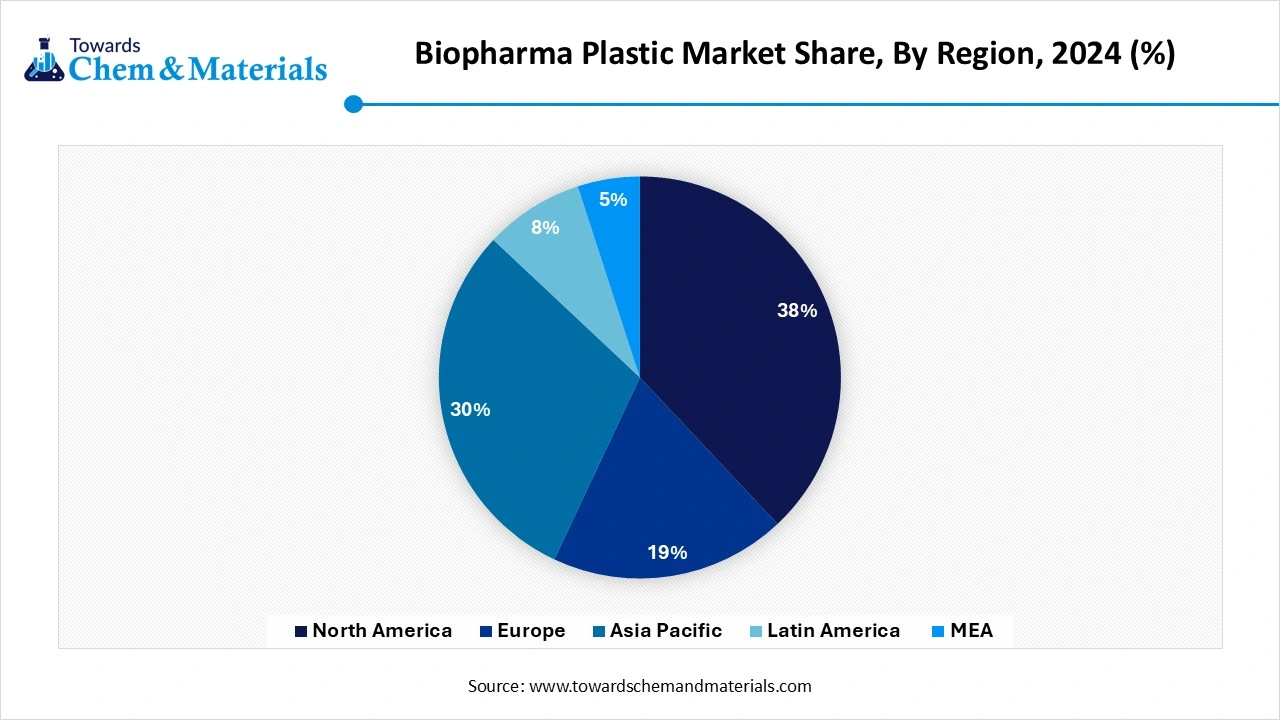
- By region, North America dominated the market with a share of 39% in 2025. Large biologics manufacturing capacity supports demand.
- By region, Asia Pacific held 25% market share in 2025 and is expected to experience the fastest growth with a CAGR of 15.1% in the forecast period. Rapid pharmaceutical manufacturing expansion accelerates demand.
- By product type, the polyvinyl chloride (PVC) segment dominated the market with a 26% share in 2025. Flexible medical tubing remains widely used.
- By product type, the polypropylene (PP) segment held 22% market share in 2025 and is expected to have the fastest growth with a CAGR of 13.8% in the forecast period. Excellent sterilization compatibility increases demand for disposable products.
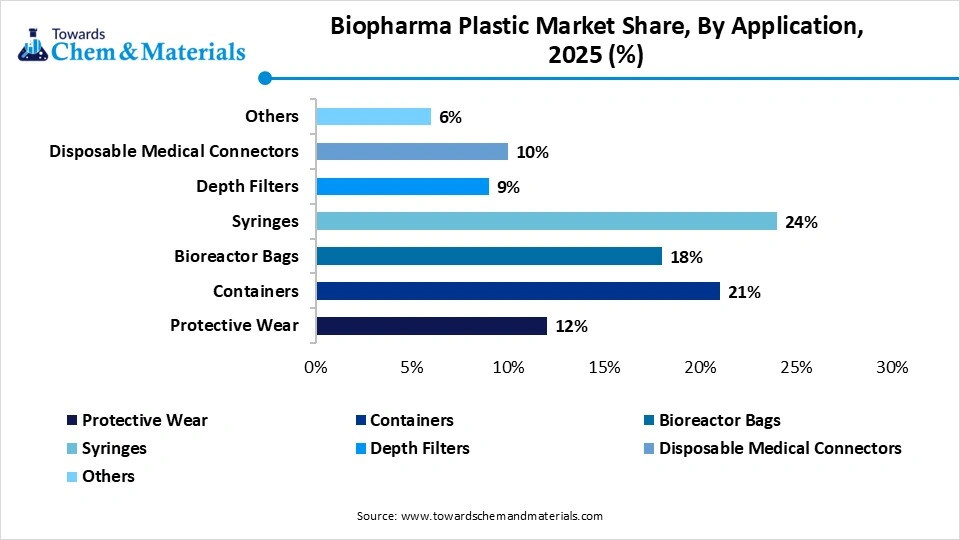
- By application, the syringes segment dominated the market with a 24% share in 2025. Rapid adoption of single-use bioprocessing accelerates demand.
- By application, the bioreactor bags segment held 18% market share in 2025 and is expected to have the fastest growth with a CAGR of 15.4% in the forecast period. Vaccination programs increase production volumes.
Market Overview+ Market Drivers+ Growth Factors
Why does the Biopharma Plastic Market Matter?
The biopharma plastic market is vital because it provides sterile, lightweight, and safe materials for making and delivering modern drugs. These plastics are essential for single-use systems that prevent germs from ruining sensitive medicines. They also ensure life-saving devices work perfectly. Advanced plastics are "clean" and do not leak harmful chemicals into medicines. They are crucial for creating precise drug delivery tools like prefilled syringes and auto-injectors. The boom in complex drugs requires special plastics. These plastics must keep medicines safe from extreme temperatures during shipping.
Traditionally, these plastics came from fossil fuels and created a lot of waste. To solve this, the industry is creating bio-based plastics made from plants instead of oil and better recycling methods. This lowers carbon pollution while keeping patients safe. Instead of relying on fossil fuels, manufacturers are using renewable resources like corn starch and sugarcane to make plastics. These new biodegradable and recyclable plastics can reduce carbon emissions by up to 50% compared to traditional plastics.
- For instance, Rockwell Automation and Cytiva announced the launch of the Figurate Supervisory Control and Data Acquisition SCADA system, which is developed to remove digital bottlenecks in biopharmaceutical manufacturing.(Source:manufacturingchemist.com)
Market Trends
- The Growing Adoption of Single-Use Systems:- The growing adoption of single-use systems in biopharmaceutical applications like laboratory equipment and drug delivery increases demand for biopharma plastic.
- The Rise in Personalised Medicine:- The growing popularity of personalised medicine increases demand for biopharma plastics for maintaining the integrity and safety of advanced therapeutics.
- Expansion of Biopharma Industry:- The growing expansion of the biopharma industry fuels demand for biopharma plastic for safe transportation and storage of pharmaceutical products.
Report Scope
| Report Attributes | Details |
| Market Size in 2026 | USD 13.02 Billion/ 3.22 Million Tons |
| Market Size by 2035 | USD 38.66 Billion/ 8.90 Million Tons |
| Growth rate from 2024 to 2025 | CAGR 12.85% |
| Base Year of Estimation | 2025 |
| Forecast Period | 2025 - 2035 |
| Dominant Region | North America |
| Segment Covered | By Product Type, By Application, By Usage Mode, By End User, By Distribution Channel, By Region |
| Key Profiled Companies | BASF SE, SABIC, Dow Inc., DuPont de Nemours, Inc., Celanese Corporation, Solvay SA, Evonik Industries AG, Röchling Group, Ensinger GmbH, Saint-Gobain Performance Plastics, 3M Company, Covestro AG, W. L. Gore & Associates, Inc., Daikyo Seiko Ltd., West Pharmaceutical Services, Inc., Thermo Fisher Scientific Inc., Freudenberg Group, Entegris, Inc., Nordson Corporation, Moldex3D (CoreTech System Co., Ltd.) |
Market Opportunity
Growing Demand for Biologics Unlocks Opportunity for Biopharma Plastic
The growing demand for biologics increases the demand for biopharma plastics for delivery, production, and storage. The increasing production of biologics increases demand for single-use systems like bioreactors, bags, and tubing. Biologics require high-purity requirements to maintain integrity during drug production. The increasing demand for biologics like complex therapies, vaccines, and monoclonal antibodies leads to higher demand for biopharma plastic for delivery, production, and storage. The growing prevalence of chronic diseases like autoimmune disorders, heart disease, and cancer increases demand for biologic therapies is fueling the adoption of biopharma plastic. The growing use of auto-injectors, personalised medicines, and pre-filled syringes increases the utilization of biologics, fueling demand for biopharma plastic. The growing demand for biologics creates an opportunity for the biopharma plastic market.
Market Challenge
High Production Cost Limits the Expansion of Biopharma Plastic
Despite several benefits of the biopharma plastic, the high production cost restricts the market growth. Factors like stringent regulatory environments, the need for premium materials, the need for high purity, and specialized manufacturing processes increase the production cost. The need for high-purity raw materials for single-use systems and packaging increases the cost.
The requirement of extensive documentation, testing, and validation requires stringent regulations increases the overall cost. The need for specialized processes like controlled environment production, aseptic manufacturing, and sterilization leads to higher costs. The increasing complexity of manufacturing is leading to higher costs. The high production cost hampers the growth of the biopharma plastic market.
Supply Chain Analysis of Biopharma Plastic Market
Chemical Synthesis and Processing
- Biopharma plastic chemical synthesis and processing involve creating high-purity, chemically resistant polymers used to manufacture single-use bioreactor bags, tubing, and filters. Because biological drugs are sensitive, these plastics must not leach chemicals into the medicine.
- Sartorius manufactures single-use biopharma plastic products, including bags, bioreactors, filters, and fluid management systems, helping pharmaceutical manufacturers improve process efficiency and reduce contamination risks.
- Key players: Thermo Fisher Scientific, Saint-Gobain, Sartorius, Merck KGaA
Quality Testing and Certification
- Biopharma plastic testing ensures materials are safe, consistent, and free of harmful chemicals that could leak into medicines. It relies on Good Manufacturing Practices (GMP). Key standards like USP <88> and USP Class VI are widely used to verify biocompatibility before a plastic comes into contact with a drug.
- Merk KGaA develops biopharma process materials and single-use plastic technologies that meet global regulatory requirements for biologics manufacturing, vaccine production, and pharmaceutical processing.
- Key players: International Organization for Standardization, U.S. Food and Drug Administration, United States Pharmacopeia, European Medicines Agency.
Distribution to Industrial Users
- The biopharma plastics distribution network supplies medical-grade polymers to industrial users like vaccine manufacturers and laboratories. Companies use these materials to make items like syringes, fluid tubes, and bioreactor bags. This network relies heavily on temperature-controlled cold-chain logistics to prevent damage during transport.
- Thermo Fisher Scientific supplies a broad portfolio of biopharma plastic products, including laboratory consumables, single-use bioprocess systems, and sterile containers that support drug development, biologics manufacturing, and quality control operations.
- Key players: Architectural Plastics Inc. and Arkay Plastics Inc.
Regional Insights
How North America Dominated the Biopharma Plastic Market?
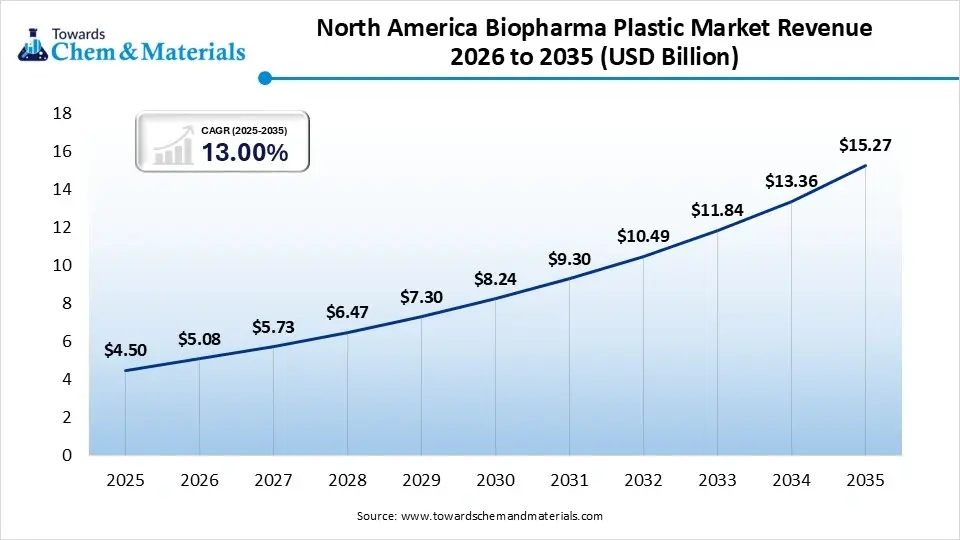
The North America biopharma plastic market size was estimated at USD 4.50 billion in 2025 and is projected to reach USD 15.27 billion by 2035, growing at a CAGR of 13.00% from 2026 to 2035.North America dominated the market with the largest share of 39% in 2025, driven by the rapid rise of single-use systems (SUS) like disposable bags and tubing. Key growth factors include the booming production of complex biologics and mRNA therapies, strict FDA safety guidelines, and wide pharmaceutical outsourcing trends across the region. The U.S. FDA requires pharmaceutical companies to follow "Current Good Manufacturing Practice" (cGMP) guidelines. These rules ensure drugs do not get contaminated. High-performance, medical-grade plastics (such as polypropylene and PVC) meet these strict safety standards.
United States
- The U.S. is the world leader in developing new gene therapies, vaccines, and personalized medicines.
- The U.S. Food and Drug Administration (FDA) and the Affordable Care Act (ACA) have expanded healthcare access while enforcing strict safety rules.
- Major U.S. polymer makers are engineering new plastics that can withstand freezing temperatures or intense radiation for sterilization.
Canada
- The Canadian government gives grants to boost local pharmaceutical manufacturing. This makes it easier for biotech companies in hubs like Ontario and Quebec to expand their facilities using plastic-based modular production.
- Canada strictly enforces plastic waste management. Therefore, plastic manufacturers are shifting to biodegradable and bio-based plastics to meet sustainability goals while keeping drugs safe.
Asia Pacific Biopharma Plastic Market Growth Factor
Asia Pacific held a market share of 25% in 2025 and is expected to grow at the fastest CAGR of 15.1% over the forecast period. The region's leadership was driven by booming generic drug manufacturing, investments in cold-chain logistics, and a massive rise in local pharmaceutical production. The region's heavy adoption of disposable plastic bioprocess equipment is because they are cheaper and faster to use than traditional stainless steel. Emerging economies like India and China experienced high demand for durable, cost-effective plastic packaging used to transport generic medicines.
China
- The Chinese government is pushing hard to reduce plastic waste. This means companies are researching and using new, eco-friendly bioplastics for their products.
- Analysts expect the Chinese biopharma plastics sector to maintain a strong double-digit growth rate over the next several years.
India
- India has become a major hub for global drug production. Local factories use biopharma plastics to keep costs down. Plastics are lightweight, which makes shipping much cheaper than using heavy glass or metal.
- The Indian government is investing heavily in healthcare infrastructure. Initiatives to improve local drug manufacturing and make healthcare affordable are driving demand for disposable plastic items like syringes, vials, and IV bags.
Europe Biopharma Plastic Market Growth Factor
Europe held a market share of 27% in 2025, driven by strict safety rules, a booming biotech sector, and eco-friendly laws. The European Medicines Agency (EMA) demands strict packaging purity to keep drugs safe. Meanwhile, green laws force makers to cut waste. The EU pushes hard to reduce plastic waste. Laws demand more recycled content and better collection rates. This encourages companies to adopt bio-based plastics. Europe has an older population. This means more demand for biologics and medicines. More medicine requires more medical-grade plastic packaging.
Germany
- Agencies like the European Medicines Agency (EMA) require rigorous testing of plastics. Materials must not leach chemicals into the drug. This drives demand for high-quality, compliant polymer resins.
- Germany strongly values environmental protection. Biopharma companies and plastic makers are constantly working together to create bioplastics derived from renewable resources. This helps reduce the industry's carbon footprint while keeping drug performance high.
France
France's national AGEC Law bans oxodegradable plastics and mandates reductions in single-use packaging. This forces French medical and pharmaceutical brands to innovate using bio-based and highly recyclable monomaterials.
France's biopharmaceutical market is expanding. Local companies are moving away from imported supplies, focusing instead on domestic manufacturing and robust cold-chain packaging solutions.
Latin America Biopharma Plastic Market Growth Factor
Latin America held a market share of 5% in 2025. The growth of the market is driven by the rising demand for biologic drugs, the shift toward disposable manufacturing tools, local production advantages, and the adoption of eco-friendly materials. Biopharma factories are using disposable plastic bags and tubes instead of metal tanks. These "single-use systems" prevent cross-contamination and save money. Brazil and other countries use sugarcane to make plant-based bioplastics. These carbon-negative materials help brands meet green goals.
Brazil
- Companies are building small, flexible cleanrooms. These factories use lightweight biopharma plastics instead of traditional glass and metal.
- Brazil is pushing for green, biodegradable plastics. The shift toward a circular economy forces drug makers to use eco-friendly polymers.
- Government and private investments in local healthcare infrastructure boost domestic drug manufacturing, driving growth of local production.
Argentina
- Argentina has abundant natural resources like corn and sugarcane. This provides a strong local supply of raw materials for making eco-friendly bioplastics.
- The modernization of medical facilities and a growing focus on preventative care push the demand for reliable, sterile medical plastic supplies.
Middle East & Africa Biopharma Plastic Market Growth Factor
The Middle East & Africa held a market share of 4% in 2025. The major growth factors include rising regional investments in healthcare infrastructure, expanding local drug production, and the cost-effective, lightweight nature of plastic. Local governments are building better hospitals and clinics. Countries like Saudi Arabia and the UAE are expanding their medical sectors. This increases the need for secure drug storage and delivery. Plastic is lighter than glass. This makes it cheaper and easier to ship across large countries in Africa and the Middle East. It also prevents spills and keeps medicine fresh.
Saudi Arabia
- The government's plan boosts domestic drug and biotechnology manufacturing. Building more local factories directly raises the need for specialized plastic packaging like IV bags, vials, and syringes.
- Saudi Arabia is a global powerhouse in basic petrochemicals. Local industry giants like SABIC produce advanced plastics directly in the country. This cuts costs and lowers shipping delays for local plastic manufacturers.
UAE
- The UAE's nationwide bans on single-use plastics penalize suppliers who do not pivot toward sustainable, biodegradable, and recyclable designs.
- The UAE Ministry of Industry and Advanced Technology (MoIAT) has invested tens of millions in domestic medical and pharmaceutical manufacturing.
- The UAE biopharma plastic market is growing due to the country's strict single-use plastic bans, local biotech investments, and a surge in sensitive biologic drugs that need sterile packaging.
Segmental Insights
Polymer Type Insights
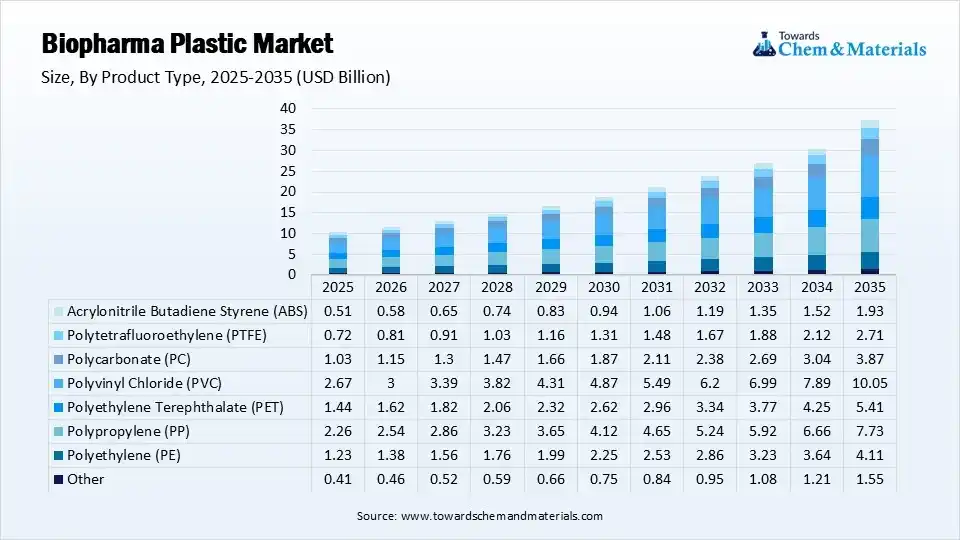
Polyvinyl chloride (PVC) emerged as the leading polymer segment, accounting for more than 21.50% of the global market revenue in 2024. Its widespread use is driven by its excellent processing capabilities, allowing it to be molded into a variety of shapes without cracking or losing its structural integrity. PVC also offers high flexibility, durability, and resistance to heat, making it an ideal material for manufacturing medical products such as syringes, disposable connectors, depth filters, and other biopharmaceutical components.
 Biopharma plastic polymers are widely used because they provide durable surfaces with excellent resistance to ultraviolet (UV) radiation and chemical exposure. They also offer strong oxidation resistance, water repellency while maintaining vapor permeability, and reliable mechanical strength. These characteristics help manufacturers produce medical products that are durable, cost-effective, and suitable for demanding healthcare environments. In addition, the naturally hydrophobic properties of many biopharma polymers have increased their use in protective healthcare apparel and other medical safety products.
The market for biopharma plastic polymers is expected to expand steadily due to favorable manufacturing conditions, rising healthcare awareness, and increasing healthcare spending worldwide. The availability of large-scale polypropylene (PP) molding facilities and a well-established manufacturing industry is further supporting market growth. Other polymers, including polyethylene (PE) and polytetrafluoroethylene (PTFE), are also widely used because of their excellent durability, chemical resistance, surface finish, and long-term performance. Together, these factors are expected to drive continued growth in the biopharma plastics market over the forecast period.
Biopharma Plastic Market Share, By Product Type, 2025(%)
| By Product Type | Revenue Share, 2025 (%) |
| Polyethylene (PE) | 12% |
| Polypropylene (PP) | 22% |
| Polyethylene Terephthalate (PET) | 14% |
| Polyvinyl Chloride (PVC) | 26.00% |
| Polycarbonate (PC) | 10% |
| Polytetrafluoroethylene (PTFE) | 7% |
| Acrylonitrile Butadiene Styrene (ABS) | 5% |
| Other | 4% |
Application Insights
Syringes represented the largest application segment, accounting for more than 20.85% of the global market revenue in 2024. The increasing demand for prefilled syringes is a major factor supporting this growth, as they offer greater convenience, lower costs, reduced risks of microbial contamination, and fewer injection and dosage errors compared to conventional syringe systems.
 The growing adoption of advanced healthcare technologies, increasing production of biologic drugs and large-molecule therapeutics, and rising investments in healthcare infrastructure are further contributing to the expansion of this segment. Disposable biopharma plastic syringes are particularly preferred because they are easy to use, improve patient safety, and support efficient drug delivery.
Well-established healthcare systems across both developed and emerging economies are also driving demand for high-quality medical devices, increasing the consumption of biopharma plastics in syringe manufacturing and other healthcare applications. Furthermore, the continued shift toward prefilled syringes, supported by their convenience, affordability, and ability to minimize contamination and dosing errors, is expected to sustain strong growth in this application segment throughout the forecast period.
Biopharma Plastic Market Share, By Application, 2025(%)
| By Application | Revenue Share, 2025 (%) |
| Protective Wear | 12% |
| Containers | 21% |
| Bioreactor Bags | 18% |
| Syringes | 24% |
| Depth Filters | 9% |
| Disposable Medical Connectors | 10% |
| Others | 6% |
Recent Developments
- In April 2026, Eli Lilly launched its once-daily oral obesity pill, Foundayo (orforglipron), setting a $149 monthly self-pay starting price to compete with Novo Nordisk’s oral Wegovy. Unlike competitors, Foundayo is a small-molecule, nonpeptide drug that requires no specific fasting or water restrictions, allowing for higher manufacturing volumes.(Source: biopharmadive.com )
- In April 2026, RBL LLC, a biotech venture creation studio based out of Houston's Texas Medical Center Helix Park, launched Duracyte, a biotechnology startup commercializing implantable "biohybrid pharmacy" devices.(Source:news.rice.edu)
- In January 2026, MGS, a healthcare contract development and manufacturing organization (CDMO), launched the Auto-injector Reimagined (A.i.r.) Platform. The customizable drug-delivery system is engineered to help pharmaceutical innovators bring ownable, patient-centric auto-injectors to market faster and more cost-effectively.(Source: www.contractpharma.com)
- In April 2026, Biopharma is launching a €75 million plasma processing plant in Uzhhorod, Ukraine, slated to become operational in September 2026. The new facility, which will be one of Europe’s largest, represents a significant expansion in the company's high-tech blood plasma processing capabilities.(Source: inventure.com.ua)
Top Companies List
- BASF SE
- SABIC
- Dow Inc.
- DuPont de Nemours, Inc.
- Celanese Corporation
- Solvay SA
- Evonik Industries AG
- Röchling Group
- Ensinger GmbH
- Saint-Gobain Performance Plastics
- 3M Company
- Covestro AG
- W. L. Gore & Associates, Inc.
- Daikyo Seiko Ltd.
- West Pharmaceutical Services, Inc.
- Thermo Fisher Scientific Inc.
- Freudenberg Group
- Entegris, Inc.
- Nordson Corporation
- Moldex3D (CoreTech System Co., Ltd.)
Segments Covered
By Product Type
- Polyethylene (PE)
- Low-Density Polyethylene (LDPE)
- High-Density Polyethylene (HDPE)
- Ultra-High Molecular Weight Polyethylene (UHMWPE)
- Polypropylene (PP)
- Homopolymer PP
- Random Copolymer PP
- Impact Copolymer PP
- Acrylonitrile Butadiene Styrene (ABS)
- Medical Grade ABS
- High-Impact ABS
- Polyethylene Terephthalate (PET)
- Virgin PET
- Recycled Medical PET
- Polyvinyl Chloride (PVC)
- Flexible PVC
- Rigid PVC
- Polytetrafluoroethylene (PTFE)
- Virgin PTFE
- Modified PTFE
- Polycarbonate (PC)
- Medical Grade PC
- High-Clarity PC
- Other
- Polyamide (PA)
- Polyether Ether Ketone (PEEK)
- Polysulfone (PSU)
- Cyclic Olefin Polymer (COP)
- Cyclic Olefin Copolymer (COC)
By Application
- Protective Wear
- Isolation Gowns
- Gloves
- Face Shields
- Containers
- Bottles
- Storage Vials
- Sample Containers
- Bioreactor Bags
- 2D Bags
- 3D Bags
- Mixing Bags
- Syringes
- Disposable Syringes
- Prefilled Syringes
- Depth Filters
- Capsule Filters
- Sheet Filters
- Disposable Medical Connectors
- Tube Connectors
- Sterile Connectors
- Quick Connectors
- Others
- Pipette Tips
- Cell Culture Consumables
- Diagnostic Components
By Region
- North America
- U.S.
- Canada
- Europe
- Germany
- UK
- France
- Italy
- Spain
- Sweden
- Denmark
- Norway
- Asia Pacific
- China
- Japan
- India
- South Korea
- Thailand
- Latin America
- Brazil
- Mexico
- Argentina
- Middle East & Africa
- South Africa
- UAE
- Saudi Arabia
- Kuwait
A Seven-Phase Framework
Our methodology is designed to be universally applicable across commodity chemicals, specialty chemicals, petrochemicals, construction chemicals, coatings, electronic chemicals, industrial gases, agrochemicals, water treatment chemicals, and performance materials. Each phase builds upon the last, creating a layered validation structure that minimizes estimation error and maximizes analytical confidence.
The framework ensures comprehensive market coverage, robust cross-validation, and reliable long-term forecasting — producing market estimates that withstand scrutiny from investors, regulators, and corporate strategy teams.

Seven-Phase Framework — Analytical Effort Distribution
Relative analytical effort allocated across each phase of the Chemicals & Materials research framework

Phase 1 - Secondary Research: Establishing the Foundation
Secondary research collects and evaluates publicly available information from authoritative sources, establishing the foundational understanding of market structure, value chain dynamics, competitive landscape, and end-use demand patterns. Every source is evaluated for credibility, recency, geographic relevance, and methodological soundness before inclusion.
Industry Associations
Sources include ACC, CEFIC, ICCA, JCIA, CPCIF, and SOCMA providing production volumes, consumption trends, capacity developments, and sustainability initiatives.
Company Disclosures
Annual reports, investor presentations, earnings transcripts, and regulatory filings reveal product portfolios, manufacturing footprints, capacity expansions, and revenue segmentation.
Government Databases
National statistical offices, customs authorities, environmental agencies, and industrial production databases provide verified statistics on output, trade flows, and regulatory compliance.
Trade Databases
UN Comtrade, ITC, Eurostat, and national customs authorities enable assessment of global product movement, import dependency, and export competitiveness across regions.
Our Secondary Research Sources
- Ministry of Chemicals and Fertilizers
- European Chemicals Agency
- United States Department of Energy
- Ministry of Industry and Information Technology
- Ministry of Economy Trade and Industry
- Ministry of Trade Industry and Energy
- National Institute of Standards and Technology
- Council of Scientific and Industrial Research
- Fraunhofer Society
- National Institute for Materials Science
Phase 2 — Supply-Side Assessment: Mapping Production Capabilities
Production Capacity Analysis
All major manufacturers are assessed for existing installed capacity, planned additions, expansions, new plant announcements, and technology adoption — mapped at global, regional, and country levels.
Capacity Utilization Adjustment
Installed capacity is adjusted using utilization rates based on demand conditions, feedstock availability, plant operating rates, maintenance schedules, and regulatory restrictions.
Manufacturer Revenue Analysis
Product-specific revenues, segment-level performance, regional distribution, average selling prices, and margin trends are evaluated to establish market value estimates.
Supply-Side Assessment — Capacity vs. Effective Production by Region
Illustrative comparison of installed capacity vs. effective production volume (after utilization rate adjustment) across major regions

Phase 3 — Demand-Side Assessment: Quantifying Chemical Consumption
Demand-side analysis quantifies chemical consumption across industries, applications, and geographies — identifying where and how chemicals are consumed throughout the value chain with precision.
End-Use Industry Analysis
Chemical demand is evaluated across automotive, construction, packaging, electronics, agriculture, healthcare, consumer goods, industrial manufacturing, energy and utilities, and water treatment. Industry output, production trends, and consumption intensity are analyzed to determine demand patterns.
Consumption Modeling
Demand is estimated using measurable indicators: kilograms per vehicle, kilograms per square meter of construction, dosage per cubic meter of water treated, kilograms per hectare of agricultural land, and kilograms per ton of manufactured products. Consumption factors are validated through industry publications and primary interviews.
Application Analysis
The market is segmented by application area to understand product performance requirements, formulation trends, technology adoption, customer preferences, and regulatory requirements improving demand accuracy and segmentation granularity.
Demand-Side Assessment — End-Use Industry Demand Distribution
Illustrative distribution of chemical & materials demand across key end-use industries

Phase 4 - Trade Flow Analysis: Balancing Regional Supply and Demand
Trade flow analysis reconciles regional supply and demand estimates through import and export data, identifying net supply positions, regional dependencies, and market imbalances. It serves as an independent validation layer that tests the consistency of supply-side and demand-side estimates.
Import Analysis
Import data is evaluated to determine volumes, source countries, product dependency, regional supply gaps, and pricing trends — identifying markets that rely heavily on external supply and where domestic production is insufficient to meet demand.
Export Analysis
Export assessments reveal production surplus, export competitiveness, regional manufacturing strength, and global market participation. Export patterns also help validate domestic production estimates and identify net exporting regions.
Apparent Consumption Model
Regional consumption is assessed using the standard apparent consumption formula:
Results identify net importing regions, net exporting regions, regional deficits, and surpluses — serving as an independent validation of supply and demand estimates.
Trade Flow Analysis — Net Supply Position by Region
Illustrative apparent consumption vs. domestic production across major regions — positive gap indicates net import dependency

Phase 5 — Primary Research: The Critical Validation Layer
Primary research tests and refines findings from secondary research through direct engagement with industry participants across the supply chain, demand side, and expert community. It captures intelligence that no database or published report can provide — the real-world experience of manufacturers, buyers, and specialists operating in the market.

Supply-Side Interviews
Conversations with chemical manufacturers, raw material suppliers, contract manufacturers, technology providers, and plant operators cover production trends, capacity utilization, pricing developments, technology shifts, and competitive dynamics.

Demand-Side Interviews
Engagement with OEMs, industrial consumers, procurement managers, distributors, formulators, and end-use manufacturers focuses on consumption trends, purchasing behavior, product substitution, demand outlook, and emerging applications.

Industry Expert Consultations
Additional interviews with industry consultants, independent experts, regulatory specialists, technical professionals, and research institutions provide deeper market context and validate key analytical assumptions.
Focus Areas of Primary Research:
Market Size & Forecast Validation
Revenue estimates, volume consumption, growth rates, forecast assumptions, regional demand.Supply Chain & Value Chain Assessment
Raw material sourcing, supply chain challenges, distribution networks, procurement practices.Production & Capacity Analysis
Manufacturing capacity, utilization rates, expansion projects, plant investments.Pricing & Cost Structure Analysis
Product pricing trends, feedstock costs, energy costs, margin pressures, pricing outlook.Competitive Landscape Assessment
Volume and value estimates confirmed to be fully consistent with one another before publicationInterview Volume by Market Scope
| Study Scope | Number of Interviews |
|---|---|
| Niche Market | 20 – 30 |
| Mid-Sized Market | 30 – 50 |
| Global Market | 50 – 80 |
| Highly Fragmented Market | 80 – 120 |
Interview Details:
Category : Manufacturers, Suppliers, Distributors, End Users, Experts/Associations
Average Duration : 30–60 Minutes
Interview Mode : Video calls, telephonic interviews, expert consultations
Interview Format : Structured / Semi-Structured questionnaire
Focus Areas of Primary Research:
Market Size & Forecast Validation :
Revenue estimates, volume consumption, growth rates, forecast assumptions, regional demand.
Supply Chain & Value Chain Assessment :
Raw material sourcing, supply chain challenges, distribution networks, procurement practices.
Production & Capacity Analysis :
Manufacturing capacity, utilization rates, expansion projects, plant investments.
Pricing & Cost Structure Analysis :
Product pricing trends, feedstock costs, energy costs, margin pressures, pricing outlook.
Competitive Landscape Assessment :
Market share, competitor positioning, strategic initiatives, partnerships, acquisitions.
Primary Research — Stakeholder Coverage by Category
Distribution of interview respondents across stakeholder categories (% share from PPT data)

Primary Research — Respondent Designation Profile
Seniority breakdown of interview respondents (% share from PPT data)

Primary Research — Geographic Coverage of Interviews
Regional distribution of primary research engagement (% share from PPT data)

Phase 6 — Data Triangulation and Market Validation
No single methodology is relied upon in isolation. Multiple independent estimation approaches are combined and reconciled to ensure consistency, accuracy, and analytical defensibility. Any material deviations between approaches are investigated and adjusted through additional validation cycles.
The final market size is derived through weighted triangulation of all validated methodologies. Any material deviations between approaches are investigated and adjusted through additional validation cycles. The outcome represents the most realistic assessment of the market based on available evidence and expert confirmation ensuring that volume and value estimates are fully consistent with one another.
Triangulation Framework — Input Contribution Weight
Relative weight each sizing input contributes to the final reconciled market estimate

Phase 7 — Forecast Modeling: Projecting Future Market Evolution
Forecasting evaluates the future trajectory of the market using a combination of quantitative indicators and qualitative assessments across economic, industry, and regulatory dimensions. Rather than simple extrapolation, each driver is independently modeled and integrated into a composite forecast.
Macroeconomic Indicators
GDP growth, industrial production, manufacturing output, construction activity, consumer spending, and capital investment form the quantitative foundation of long-term demand projections. These are applied at country, regional, and global levels.
Industry Growth Drivers
Urbanization, infrastructure development, industrialization, technological innovation, sustainability initiatives, and evolving product performance requirements are assessed at regional and industry levels — capturing both structural and cyclical demand drivers.
Capacity Expansion Analysis
Announced plant expansions, new manufacturing facilities, technology upgrades, and strategic investments are evaluated to determine future supply-demand dynamics and potential market tightness or oversupply situations.
Regulatory & Sustainability
Environmental regulations, chemical safety standards, emission reduction targets, circular economy initiatives, and sustainability requirements are incorporated as they often influence product adoption rates and market growth trajectories.
Scenario Forecast Range — Indexed Market Growth (Year 1–10)
Illustrative indexed growth trajectories across Base, Optimistic, and Pessimistic scenarios over a 10-year forecast horizon

Forecast Drivers — Relative Impact Score by Category
Impact score (0–100) of each driver type on chemicals & materials market forecast




Comments
Share your thoughts, ask a question, or provide feedback about this report.