
Asia Pacific Ceramic Tiles Market Size Analysis Report 2035
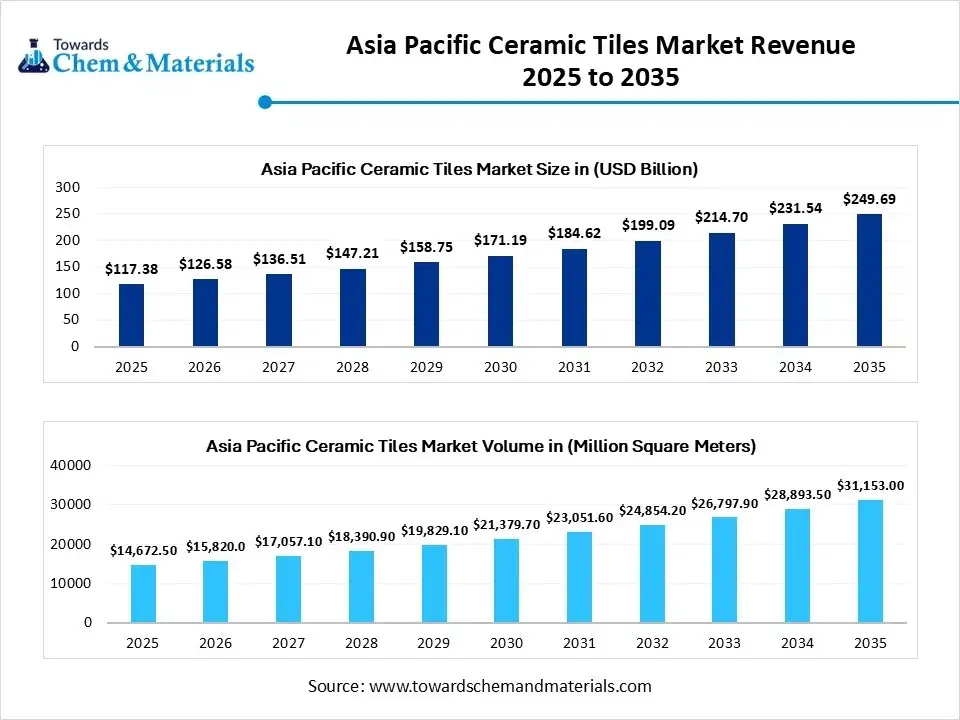
The Asia Pacific ceramic tiles market size was estimated at USD 117.38 billion in 2025 and is expected to be worth around USD 249.69 billion by 2035, growing at a CAGR of 7.84% from 2026 to 2035. In terms of volume, the Asia Pacific ceramic tiles market is projected to grow from 14,673 million square meters in 2025 to 31,153 million square meters by 2035. growing at a CAGR of 7.82% from 2026 to 2035.The rapid industrialization and infrastructure development projects with innovative technologies drive the growth of the market.
Key Takeaways
- By product/tile type, the porcelain tiles segment dominated the market with a share of approximately 52.40% in 2025
- By product/tile type, the vitrified/ceramic (non-porcelain) segment is expected to grow significantly in the market during the forecast period.
- By application, the floor tiles segment dominated the market with a share of approximately 49.00% in 2025.
- By application, the wall tiles segment is expected to grow in the forecast period.
- By tile size/ format, the standard formats (≤400×400 / ≤600×600 mm) segment dominated the market with a share of approximately 56.00% in 2025.
- By tile size/ format, the large format (600×600 to 1200×2400 mm) segment is expected to grow in the forecast period.
- By end use, the residential segment dominated the market with a share of approximately 55.00% in 2025
- By end use, the commercial segment is expected to grow in the forecast period.
- By distribution channel, the traditional/independent dealers & local showrooms segment dominated the market with a share of 60.00% in 2025
- By distribution channel, the online / e-commerce & B2B direct sales segment is expected to grow in the forecast period.
- By manufacturing/technology, the dry-pressed & single-firing press-sintered porcelain segment dominated the market with a share of approximately 62.00% in 2025
- By manufacturing/technology, the digital printing/surface finishing value-add segment is expected to grow in the forecast period.
Market Size and Volume Forecast:
- Market Estimated Size (2025): USD 117.38 Billion | CAGR (2026–2035): 7.84%
- Market Projected Size (2035): USD 249.69 Billion
- Market Volume (2025): 14,673 Million Square Meters | Volume CAGR (2026–2035): 7.82%
- Market Projected Volume (2035): 31,153 Million Square Meters
- Market Pricing (2025):
- Average Manufacturing Price: USD 7.99/Square Meter
- Average Selling Price: USD 7.99/Square Meter
- Pricing CAGR (2025–2035): 7.82%
Market Overview
What is the significance of the Asia Pacific Ceramic Tiles Market?
The Asia Pacific ceramic tiles market is important because the region has the largest global share, driven by rapid urban growth, expanding construction, and rising disposable incomes. These factors increase demand for durable and attractive flooring and wall solutions in both residential and non-residential buildings. Additionally, the market is a key production center due to low manufacturing costs and advanced technology, enabling it to meet global supply needs and innovate in design and functionality. This makes it a crucial part of the worldwide construction and design industries.
Report Scope
| Report Attributes | Details |
| Market Size in 2025 | USD 117.38 Billion / 15,820 Million Square Meters |
| Expected Size by 2035 | USD 231.54 Billion/ 31,153 Million Square Meters |
| Growth Rate from 2025 to 2035 | CAGR 7.84% |
| Base Year of Estimation | 2025 |
| Forecast Period | 2025 - 2035 |
| Segment Covered | By Product / Tile Type, By Application, By Tile Size / Format, By End-User / Buyer Type, By Distribution Channel, By Manufacturing / Technology |
| Key Companies Profiled | Mohawk Industries (Marazzi, Daltile, partner brands) , Grupo Lamosa (and regional affiliates) , Somany Ceramics / HSIL group (India) , Asian Granito India Ltd. , Marco Polo / New Marco Polo (China), Monalisa (China) , SCG Ceramics / Cotto (Thailand) , Dongwha / LG Hausys (Korea) — (LG Hausys: building materials & tile systems) , Caesar Ceramics (Taiwan) , Atlas Concorde (Italy — large APAC presence via distribution & JV) , Florim / Iris Ceramica Group (Italy — strong APAC channel) , Indorama / local compounders & distributors (regional players) , RAK-Siam / regional JVs (local partnerships) , Johnson Tiles / H&R Johnson (India) |
Asia Pacific Ceramic Tiles Market Outlook:
- Industry Growth Overview: Between 2025 and 2034, the Asia Pacific ceramic tiles market is projected to grow steadily, driven by strong residential and commercial construction activity across China, India, and Southeast Asia. Rising urbanization, increasing disposable incomes, and government-led housing programs are key growth drivers.
- Sustainability Trends: Sustainability is becoming a core focus in ceramic tile manufacturing, with companies investing in energy-efficient kilns, waste heat recovery systems, and low-emission glazing technologies. The adoption of eco-friendly raw materials and water-recycling systems is rising to reduce environmental impact.
- Regional Expansion & Investments: Leading manufacturers are expanding production capacities in India, Vietnam, and Indonesia to meet growing domestic and export demand. Strategic partnerships and technology collaborations with European tile producers are helping improve product quality and design innovation.
Key Technological Shifts In The Asia Pacific Ceramic Tiles Market:
Key technological shifts in the Asia Pacific ceramic tiles market are driven by consumer demand for aesthetics and sustainability, as well as innovations that enhance manufacturing and functionality. Advanced automation, including robotic handling, is being integrated into manufacturing to improve precision, reduce labor costs, and increase production speed. The use of artificial intelligence and machine learning is also emerging to enhance tile design and production efficiency. This creates opportunity and demand for the growth of the market.
Trade Analysis Of the Asia Pacific Ceramic Tiles Market: Import & Export Statistics
- India exported 39,732 shipments of Ceramic Tile from Nov 2023 to Oct 2024 (TTM). These exports were made by 2,491 Indian Exporters to 4,704 Buyers.
(Source: www.volza.com) - Most of the Ceramic Tile exports from India go to Nepal, Vietnam, and the United States.(Source: www.volza.com)
- Globally, the top 3 exporters of Ceramic Tile are India, Italy, and Spain. Italy leads the world in Ceramic Tile exports with 297,755 shipments, followed by India with 289,935 shipments, and Spain taking the third spot with 232,661 shipments.(Source: www.volza.com)
- Singapore exported 206 shipments of Ceramic Tiles from Sep 2023 to Aug 2024 (TTM). These exports were made by 61 Singapore Exporters to 59 Buyers.(Source: www.volza.com)
- Most of the Ceramic Tiles exported from Singapore go to the United States, Australia, and the United Arab Emirates.(Source: www.volza.com)
- Malaysia exported 3,448 shipments of Ceramic Tile from Oct 2023 to Sep 2024 (TTM). These exports were made by 69 Malaysian exporters to 159 Buyers.(Source: www.volza.com)
Asia Pacific Ceramic Tiles Market Value Chain Analysis
- Chemical Synthesis and Processing : Ceramic tiles are manufactured using raw materials such as clay, feldspar, and silica through processes including mixing, molding, glazing, and high-temperature firing.
Key players: Kajaria Ceramics, Somany Ceramics, SCG Ceramics, Asian Granito India Ltd, China Ceramics Co. Ltd. - Quality Testing and Certification : Ceramic tiles require certifications for durability, surface finish, and water absorption, following ISO 10545 and BIS standards.
- Key players: Bureau of Indian Standards (BIS), ISO, SGS, TÜV SÜD.
- Distribution to Industrial Users : Ceramic tiles are distributed across the residential, commercial, and infrastructure construction sectors through dealers, distributors, and export networks.
- Key players: RAK Ceramics, Orient Bell Ltd, Nitco Tiles, Asian Granito India Ltd.
Asia Pacific Ceramic Tiles Regulatory Landscape: Global Regulations
| Country / Region | Regulatory Body | Key Regulations / Standards | Focus Areas | Notable Notes |
| China | Standardization Administration of China (SAC), Ministry of Industry and Information Technology (MIIT), Ministry of Ecology and Environment (MEE) | - GB/T 4100-2021 – Ceramic tiles standard (replaces GB/T 4100-2015) - GB 6566-2010 – Limits of radionuclides in building materials - Environmental Protection Law (2015) |
- Tile dimensional accuracy, strength, and absorption - Radiological safety - Emission control and waste management in kilns |
China enforces strict quality and environmental standards for tiles. GB/T 4100 is harmonized with ISO 13006. Producers must comply with energy efficiency and low-emission kiln policies. |
| India | Bureau of Indian Standards (BIS), Ministry of Commerce and Industry, Central Pollution Control Board (CPCB) | - IS 15622:2017 – Ceramic tiles specification (based on ISO 13006) - IS 13755:1993 – Water absorption test - Environmental Protection Act, 1986 |
- Product performance (strength, absorption, glaze quality) - Pollution and waste management - Industrial emission standards |
India’s BIS standards are mandatory for tile manufacturers and importers. CPCB regulates air emissions from tile clusters (e.g., Morbi, Gujarat) with a shift to natural gas and cleaner fuels. |
| Japan | Japanese Industrial Standards Committee (JISC), Ministry of Land, Infrastructure, Transport and Tourism (MLIT) | - JIS A 5209:2019 – Ceramic tiles for construction - Building Standards Act - Act on Rational Use of Energy (Energy Conservation Act) |
- Product safety and structural integrity - Fire resistance and water absorption - Energy-efficient manufacturing |
Japan enforces high precision and safety standards for tiles, particularly for seismic and fire-resistant performance in buildings. |
| Australia | Standards Australia, National Construction Code (NCC), Green Building Council of Australia (GBCA) | - AS ISO 13006:2020 – Ceramic tiles definitions and classification - NCC Volume 1 & 2 – Building code requirements - Green Star Certification – Sustainable building rating |
- Tile classification and slip resistance - Compliance with building codes - Sustainable construction materials |
Australia follows ISO-aligned product standards. Increasing focus on slip resistance (AS 4586) and environmental product declarations (EPDs) for sustainable construction. |
| Indonesia | National Standardization Agency (BSN), Ministry of Industry, Ministry of Environment and Forestry | - SNI 15-2094-2011 – Ceramic tiles standards (based on ISO 13006) - Law No. 3/2014 – Industrial development law - Environmental Management Law No. 32/2009 |
- Product labeling and certification - Manufacturing emissions - Industrial quality compliance |
Indonesia mandates SNI certification for all domestically produced and imported ceramic tiles. Local manufacturers must adhere to eco-design and energy-efficient production norms. |
Segmental Insights
Product/Tile Type Insights
Which Product/Tile Segment Dominated The Asia Pacific Ceramic Tiles Market In 2025?
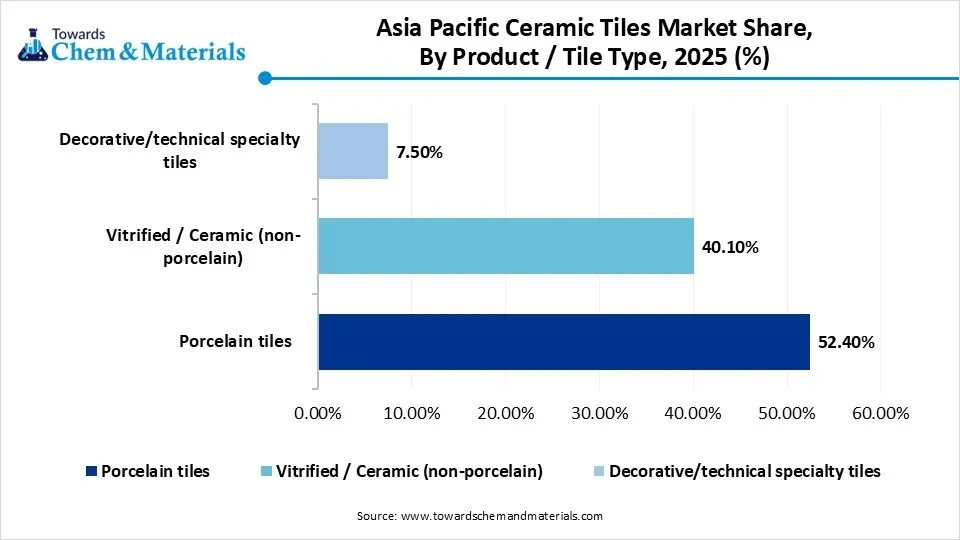
The porcelain tiles segment dominated the Asia Pacific ceramic tiles market with a share of approximately 52.40% in 2025. Porcelain tiles dominate the market due to their superior strength, low water absorption, and durability. They are widely used in both commercial and high-end residential projects where performance and aesthetics are equally valued. Technological advancements in digital printing and glazing have enhanced design variety, enabling porcelain tiles to effectively replicate natural materials such as marble and stone while maintaining cost-effectiveness.
The vitrified/ceramic (non-porcelain) segment expects significant growth in the market during the forecast period. Vitrified/ceramic (non-porcelain) tiles continue to see high demand, especially in cost-sensitive markets like India and Southeast Asia. These tiles offer versatility in colors and textures, making them suitable for mid-range residential and small commercial applications. Manufacturers are improving surface coatings and production efficiency to offer competitive pricing while maintaining quality standards. Non-porcelain ceramic tiles remain a preferred choice for interior wall and floor applications across the region.
Asia Pacific Ceramic Tiles Market Share, By Product / Tile Type, 2025(%)
| By Product / Tile Type | Revenue Share, 2025 (%) |
| Porcelain tiles | 52.40% |
| Vitrified / Ceramic (non-porcelain) | 40.10% |
| Decorative/technical specialty tiles | 7.50% |
- Porcelain tiles hold 52.40% of the market share in 2025. Porcelain tiles are the most popular type, dominating the ceramic tiles market in the region.
- Vitrified / Ceramic (non-porcelain) account for 40.10% of the market share. These tiles are widely used due to their versatility and cost-effectiveness.
- Decorative/technical specialty tiles make up 7.50% of the market share. While smaller in share, these specialty tiles cater to niche, high-end markets with unique designs and features.
Application Insights
How Did The Floor Tiles Segment Dominate The Asia Pacific Ceramic Tiles Market In 2025?
The floor tiles segment dominated the Asia Pacific ceramic tiles market with a share of approximately 49.00% in 2025. Floor tiles represent a significant portion of market demand, driven by rapid urbanization and the construction of new residential and commercial complexes. Their resistance to heavy traffic, ease of cleaning, and long lifespan make them a preferred flooring solution in both indoor and outdoor environments.
The growing focus on design aesthetics has encouraged manufacturers to offer textured and large-format floor tiles tailored to regional preferences. The wall tiles segment expects significant growth in the market during the forecast period. Wall tiles are gaining popularity in kitchens, bathrooms, and decorative interiors due to their ability to enhance visual appeal and provide easy maintenance.
Lightweight and moisture-resistant wall tiles are increasingly used in both new construction and renovation projects. The introduction of glazed finishes, decorative motifs, and high-definition printing technologies has expanded their aesthetic potential, making them an integral component of modern architectural design in the Asia Pacific.
Asia Pacific Ceramic Tiles Market Share, By Application, 2025(%)
| By Application | Revenue Share, 2025 (%) |
| Floor tiles | 49.00% |
| Wall tiles | 31.20% |
| Outdoor / Façade & paving tiles | 11.50% |
| Countertop/tabletop/specialty | 5.80% |
| Others | 2.50% |
- Floor tiles hold 49.00% of the market share in 2025. They are the leading application in the ceramic tiles market, widely used in both residential and commercial spaces.
- Wall tiles account for 31.20% of the market share. Wall tiles are the second most common application, often used in kitchens, bathrooms, and decorative walls.
- Outdoor / Façade & paving tiles represent 11.50% of the market share. These tiles are designed for outdoor use, including façades and paving, contributing to a significant portion of the market.
- Countertop/tabletop/specialty make up 5.80% of the market share. This application includes high-end tiles used for specialized purposes like countertops and tabletops.
- Others hold 2.50% of the market share. This category includes all other niche applications of ceramic tiles that don't fall into the main categories.
Tile Size/ Format Insights
Which Tile Size/Format Segment Dominated The Asia Pacific Ceramic Tiles Market In 2025?
The Standard formats (≤400×400 / ≤600×600 mm) segment dominated the Asia Pacific ceramic tiles market with a share of approximately 56.00% in 2025. Standard formats (≤400×400 / ≤600×600 mm) continue to dominate due to their cost efficiency, convenience in installation, and compatibility with diverse architectural designs. These tiles remain the preferred choice for residential applications and small-scale construction projects. Manufacturers are optimizing production lines to deliver consistent quality and a wider range of finishes to meet growing consumer expectations.
The large-format (600×600 to 1200×2400 mm) segment expects significant growth in the market during the forecast period. Large format (600×600 to 1200×2400 mm) tiles are witnessing increasing adoption in premium residential and commercial projects. They provide a seamless aesthetic with fewer grout lines and a luxurious appearance suitable for modern architectural interiors. Driven by technological advances in pressing and sintering, large-format tiles are being used in façades, floors, and countertops, reflecting the region’s shift toward high-end, design-focused construction.
Asia Pacific Ceramic Tiles Market Share, By Tile Size / Format, 2025(%)
| By Tile Size / Format | Revenue Share, 2025 (%) |
| Standard formats | 56.00% |
| Large format | 28.50% |
| Slabs / ultra-large porcelain panels | 11.20% |
| Mosaic & specialty small tiles | 4.30% |
- Standard formats account for 56.00% of the market share in 2025. Standard-sized tiles remain the most popular choice for a wide range of applications.
- Large format holds 28.50% of the market share. These larger tiles are gaining popularity for modern and stylish design, especially in commercial and high-end residential spaces.
- Slabs / ultra-large porcelain panels make up 11.20% of the market share. These ultra-large tiles are used for luxurious and seamless flooring and wall designs.
- Mosaic & specialty small tiles represent 4.30% of the market share. These smaller tiles are often used for intricate designs and specialized applications, offering decorative appeal.
End Use Insights
How Did The Residential Segment Dominate The Asia Pacific Ceramic Tiles Market In 2025?
The residential segment dominated the Asia Pacific ceramic tiles market with a share of approximately 55% in 2025. Residential applications account for a major share of ceramic tile consumption in the Asia Pacific region. Rising disposable incomes, rapid urban housing developments, and consumer preference for modern, easy-to-maintain surfaces are boosting demand. Developers are integrating digitally printed tiles to enhance home aesthetics, while renovation trends across urban areas are further accelerating tile replacement and upgrade cycles.
The commercial segment expects significant growth in the market during the forecast period. Commercial end use includes offices, retail, hospitality, and institutional spaces, where durability and design versatility are essential. Porcelain and vitrified tiles are particularly favored for high-traffic areas due to their resistance to wear and moisture. The post-pandemic recovery in retail and tourism sectors has also strengthened demand for aesthetically appealing, long-lasting surfaces that align with modern architectural and sustainability standards.
Asia Pacific Ceramic Tiles Market Share, By End-User / Buyer Type, 2025(%)
| By End-User / Buyer Type | Revenue Share, 2025 (%) |
| Residential — New build + Renovation | 55.00% |
| Commercial | 24.80% |
| Infrastructure / Institutional | 13.50% |
| Industrial / Special projects | 6.70% |
- Residential — New build + Renovation holds 55.00% of the market share in 2025. The residential sector, including new builds and renovations, is the largest end-user of ceramic tiles in the region.
- Commercial accounts for 24.80% of the market share. The commercial sector, including offices, retail spaces, and hospitality, represents a significant portion of the market.
- Infrastructure / Institutional contributes 13.50% to the market share. This sector includes public and institutional buildings such as schools, hospitals, and government facilities.
- Industrial / Special projects make up 6.70% of the market share. Special industrial and project-based applications also drive a smaller, specialized demand for ceramic tiles.
Distribution Channel Insights
Which Distribution Channel Segment Dominated The Asia Pacific Ceramic Tiles Market In 2025?
The traditional/independent dealers & local showrooms segment dominated the Asia Pacific ceramic tiles market with a share of approximately 60% in 2025. Traditional/independent dealers & local showrooms remain the dominant distribution route, especially in emerging economies like India, Vietnam, and Indonesia. Local networks offer personalized service and cater to regional aesthetic preferences. Small-scale dealers often maintain strong relationships with contractors and homeowners, ensuring continued demand across Tier-II and Tier-III cities where organized retail penetration remains limited.
The online / e-commerce & B2B direct sales segment expects significant growth in the market during the forecast period. Online e-commerce and B2B direct sales are reshaping tile distribution in the Asia Pacific. E-commerce platforms enable convenient product visualization, comparison, and direct ordering for consumers and contractors. Meanwhile, B2B sales support large-scale procurement for builders and developers. These digital channels improve accessibility, transparency, and customer engagement, gradually reducing dependence on traditional dealer networks and enhancing regional market efficiency and competitiveness.
Asia Pacific Ceramic Tiles Market Share, By Distribution Channel, 2025(%)
| By Distribution Channel | Revenue Share, 2025 (%) |
| Traditional/Independent dealers & local showrooms | 60.00% |
| Organized/modern retail | 28.20% |
| Online / e-commerce & B2B direct sales | 11.80% |
- Traditional/Independent dealers & local showrooms account for 60.00% of the market share in 2025. This channel remains the dominant method of ceramic tile distribution, with a wide reach through local outlets.
- Organized/modern retail holds 28.20% of the market share. Organized retail, including large chain stores and showrooms, continues to expand its share in the ceramic tiles market.
- Online / e-commerce & B2B direct sales contribute 11.80% to the market share. E-commerce and B2B sales are growing channels, offering convenience and direct access to a wider customer base.
Manufacturing/Technology Insights
How Did The Pressed & Single-Firing Press-Sintered Porcelain Segment Dominate The Asia Pacific Ceramic Tiles Market In 2025?
The dry-pressed & single-firing press-sintered porcelain segment dominated the Asia Pacific ceramic tiles market with a share of approximately 62% in 2025. Dry-pressed & single-firing press-sintered porcelain technology dominates the production landscape due to its energy efficiency, high density, and superior mechanical strength. Manufacturers are adopting advanced kilns, automation, and precision glazing techniques to achieve consistent finishes and reduced production costs. The process supports mass production of both standard and large-format tiles, meeting the growing demand for quality and durability.
The digital printing/surface finishing value-add segment is expected to experience significant growth in the market during the forecast period. Digital printing and surface finishing technologies are transforming ceramic tile production across the Asia Pacific. Manufacturers increasingly use advanced inkjet and glazing systems to achieve detailed, customizable designs resembling natural materials. Value-added finishes such as anti-slip coatings and high-gloss effects enhance both aesthetics and performance. This innovation trend, driven by urbanization and rising interior design standards, positions digitally finished tiles as a preferred choice in residential and commercial construction projects.
Asia Pacific Ceramic Tiles Market Share, By Manufacturing / Technology, 2025(%)
| By Manufacturing / Technology | Revenue Share, 2025 (%) |
| Dry pressed & single-firing pressed porcelain | 62.00% |
| Double-firing ceramic lines & traditional press | 18.40% |
| Digital printing/surface finishing value add | 12.10% |
| Ultra-large slab lines | 7.50% |
- Dry pressed & single-firing pressed porcelain holds 62.00% of the market share in 2025. This technology dominates the ceramic tile production process, offering cost-effective and efficient manufacturing.
- Double-firing ceramic lines & traditional press accounts for 18.40% of the market share. This traditional method is still widely used for certain types of ceramic tiles, especially in decorative applications.
- Digital printing/surface finishing value add contributes 12.10% to the market share. The use of digital printing technology allows for advanced designs and surface finishes, adding value to the tiles.
- Ultra-large slab lines make up 7.50% of the market share. The production of ultra-large slabs is becoming more popular for premium applications, offering a sleek, modern look.
Regional Insights
China Has Seen Significant Growth, Driven By Rapid Urbanization.
China's ceramic tile market is driven by rapid urbanization and infrastructure development, and it has the world's highest output and a strong competitive advantage. Key drivers include ongoing economic growth, technological advancements in digital printing for diverse designs, and increasing use of ceramic tiles in residential and commercial green building projects to improve sustainability and aesthetics. These factors drive the growth and expansion of the market.
India Has Seen Growth Due To Infrastructure Development Projects.
India has seen growth in the market due to rapid urbanization and infrastructure development, with India being a key growth market. Driven by government initiatives for housing and infrastructure, increasing disposable incomes, and a preference for value-added products like vitrified and digitally printed tiles, India's ceramic tile market is experiencing significant expansion due to these drivers. Key factors like the adoption of digital printing, a focus on sustainability, and growth in both residential and commercial sectors also support the growth.
Country-level Investments & Funding Trends for the Asia Pacific Ceramic Tiles Industry:
- India: The government's increased capital investment outlay for housing schemes like the Pradhan Mantri Awas Yojana is a major catalyst for tile demand.
- China: The government's 14th Five-Year Plan includes massive investment in infrastructure projects, fueling demand for construction materials.
- Malaysia: In countries such as Malaysia, government economic programs are supporting residential construction and driving tile demand.
- South Korea: In South Korea, demand is spurred by investments in new high-rise commercial buildings and urban renewal.
Recent Developments
- In May 2024, Messe München Singapore announced the co-location of the new ASEAN Stone exhibition with the established ASEAN Ceramics event in Ho Chi Minh City, Vietnam, scheduled for December 11 to 13, 2024. This initiative aims to serve Southeast Asia's over $450 billion construction sector by creating a combined platform for the natural stone and ceramic industries, expected to attract over 300 exhibitors and 5,000 trade visitors(Source: en.acnnewswire.com)
Top players in the Asia Pacific Ceramic Tiles Market & Their Offerings:
- Nitco Limited (India): Specializes in premium floor and wall tiles, including ceramic, vitrified, and designer tiles, catering to luxury housing, retail, and hospitality sectors across India and Southeast Asia.
- RAK Ceramics (global with APAC sales): A global leader in ceramic and porcelain tiles, RAK Ceramics serves the Asia Pacific market through its wide distribution network, offering innovative surface designs and large-format tiles.
- Kajaria Ceramics (India): One of the largest tile manufacturers in Asia, Kajaria offers a wide range of ceramic and vitrified tiles for residential, commercial, and industrial applications, with a strong presence in both domestic and export markets.
- China Ceramics Co., Ltd. (China): Manufactures a variety of glazed, polished, and porcelain tiles for construction and real estate projects, with a focus on energy-efficient and durable materials.
- Dongpeng Holdings Co., Ltd. (China): A major tile producer in China, Dongpeng offers high-end ceramic and porcelain tiles for interior design, architectural, and commercial projects.
Other Top Players Are
- Mohawk Industries (Marazzi, Daltile, partner brands)
- Grupo Lamosa (and regional affiliates)
- Somany Ceramics / HSIL group (India)
- Asian Granito India Ltd.
- Marco Polo / New Marco Polo (China)
- Monalisa (China)
- SCG Ceramics / Cotto (Thailand)
- Dongwha / LG Hausys (Korea) — (LG Hausys: building materials & tile systems)
- Caesar Ceramics (Taiwan)
- Atlas Concorde (Italy — large APAC presence via distribution & JV)
- Florim / Iris Ceramica Group (Italy — strong APAC channel)
- Indorama / local compounders & distributors (regional players)
- RAK-Siam / regional JVs (local partnerships)
- Johnson Tiles / H&R Johnson (India)
Segments Covered
By Product / Tile Type
- Porcelain tiles
- Glazed porcelain
- Unglazed porcelain / full-body porcelain
- Vitrified / Ceramic (non-porcelain)
- Decorative/technical specialty tiles
By Application
- Floor tiles
- Wall tiles
- Outdoor / Façade & paving tiles
- Countertop/tabletop/specialty (kitchen backsplashes, ceilings)
- Others (steps, pools, industrial surfaces)
By Tile Size / Format
- Standard formats (≤400×400 / ≤600×600 mm)
- Large format (600×600 to 1200×2400 mm)
- Slabs / ultra-large porcelain panels (>1200×2400 mm)
- Mosaic & specialty small tiles
By End-User / Buyer Type
- Residential — New build + Renovation
- Commercial (offices, hotels, retail, healthcare)
- Infrastructure / Institutional (schools, hospitals, airports)
- Industrial / Special projects
By Distribution Channel
- Traditional/Independent dealers & local showrooms
- Organized/modern retail (branded showrooms, builders’ channels)
- Online / e-commerce & B2B direct sales
By Manufacturing / Technology
- Dry pressed & single-firing pressed porcelain
- Double-firing ceramic lines & traditional press
- Digital printing/surface finishing value add
- Ultra-large slab lines (sintered porcelain slab tech)
A Seven-Phase Framework
Our methodology is designed to be universally applicable across commodity chemicals, specialty chemicals, petrochemicals, construction chemicals, coatings, electronic chemicals, industrial gases, agrochemicals, water treatment chemicals, and performance materials. Each phase builds upon the last, creating a layered validation structure that minimizes estimation error and maximizes analytical confidence.
The framework ensures comprehensive market coverage, robust cross-validation, and reliable long-term forecasting — producing market estimates that withstand scrutiny from investors, regulators, and corporate strategy teams.

Seven-Phase Framework — Analytical Effort Distribution
Relative analytical effort allocated across each phase of the Chemicals & Materials research framework

Phase 1 - Secondary Research: Establishing the Foundation
Secondary research collects and evaluates publicly available information from authoritative sources, establishing the foundational understanding of market structure, value chain dynamics, competitive landscape, and end-use demand patterns. Every source is evaluated for credibility, recency, geographic relevance, and methodological soundness before inclusion.
Industry Associations
Sources include ACC, CEFIC, ICCA, JCIA, CPCIF, and SOCMA providing production volumes, consumption trends, capacity developments, and sustainability initiatives.
Company Disclosures
Annual reports, investor presentations, earnings transcripts, and regulatory filings reveal product portfolios, manufacturing footprints, capacity expansions, and revenue segmentation.
Government Databases
National statistical offices, customs authorities, environmental agencies, and industrial production databases provide verified statistics on output, trade flows, and regulatory compliance.
Trade Databases
UN Comtrade, ITC, Eurostat, and national customs authorities enable assessment of global product movement, import dependency, and export competitiveness across regions.
Our Secondary Research Sources
- Ministry of Chemicals and Fertilizers
- European Chemicals Agency
- United States Department of Energy
- Ministry of Industry and Information Technology
- Ministry of Economy Trade and Industry
- Ministry of Trade Industry and Energy
- National Institute of Standards and Technology
- Council of Scientific and Industrial Research
- Fraunhofer Society
- National Institute for Materials Science
Phase 2 — Supply-Side Assessment: Mapping Production Capabilities
Production Capacity Analysis
All major manufacturers are assessed for existing installed capacity, planned additions, expansions, new plant announcements, and technology adoption — mapped at global, regional, and country levels.
Capacity Utilization Adjustment
Installed capacity is adjusted using utilization rates based on demand conditions, feedstock availability, plant operating rates, maintenance schedules, and regulatory restrictions.
Manufacturer Revenue Analysis
Product-specific revenues, segment-level performance, regional distribution, average selling prices, and margin trends are evaluated to establish market value estimates.
Supply-Side Assessment — Capacity vs. Effective Production by Region
Illustrative comparison of installed capacity vs. effective production volume (after utilization rate adjustment) across major regions

Phase 3 — Demand-Side Assessment: Quantifying Chemical Consumption
Demand-side analysis quantifies chemical consumption across industries, applications, and geographies — identifying where and how chemicals are consumed throughout the value chain with precision.
End-Use Industry Analysis
Chemical demand is evaluated across automotive, construction, packaging, electronics, agriculture, healthcare, consumer goods, industrial manufacturing, energy and utilities, and water treatment. Industry output, production trends, and consumption intensity are analyzed to determine demand patterns.
Consumption Modeling
Demand is estimated using measurable indicators: kilograms per vehicle, kilograms per square meter of construction, dosage per cubic meter of water treated, kilograms per hectare of agricultural land, and kilograms per ton of manufactured products. Consumption factors are validated through industry publications and primary interviews.
Application Analysis
The market is segmented by application area to understand product performance requirements, formulation trends, technology adoption, customer preferences, and regulatory requirements improving demand accuracy and segmentation granularity.
Demand-Side Assessment — End-Use Industry Demand Distribution
Illustrative distribution of chemical & materials demand across key end-use industries

Phase 4 - Trade Flow Analysis: Balancing Regional Supply and Demand
Trade flow analysis reconciles regional supply and demand estimates through import and export data, identifying net supply positions, regional dependencies, and market imbalances. It serves as an independent validation layer that tests the consistency of supply-side and demand-side estimates.
Import Analysis
Import data is evaluated to determine volumes, source countries, product dependency, regional supply gaps, and pricing trends — identifying markets that rely heavily on external supply and where domestic production is insufficient to meet demand.
Export Analysis
Export assessments reveal production surplus, export competitiveness, regional manufacturing strength, and global market participation. Export patterns also help validate domestic production estimates and identify net exporting regions.
Apparent Consumption Model
Regional consumption is assessed using the standard apparent consumption formula:
Results identify net importing regions, net exporting regions, regional deficits, and surpluses — serving as an independent validation of supply and demand estimates.
Trade Flow Analysis — Net Supply Position by Region
Illustrative apparent consumption vs. domestic production across major regions — positive gap indicates net import dependency

Phase 5 — Primary Research: The Critical Validation Layer
Primary research tests and refines findings from secondary research through direct engagement with industry participants across the supply chain, demand side, and expert community. It captures intelligence that no database or published report can provide — the real-world experience of manufacturers, buyers, and specialists operating in the market.

Supply-Side Interviews
Conversations with chemical manufacturers, raw material suppliers, contract manufacturers, technology providers, and plant operators cover production trends, capacity utilization, pricing developments, technology shifts, and competitive dynamics.

Demand-Side Interviews
Engagement with OEMs, industrial consumers, procurement managers, distributors, formulators, and end-use manufacturers focuses on consumption trends, purchasing behavior, product substitution, demand outlook, and emerging applications.

Industry Expert Consultations
Additional interviews with industry consultants, independent experts, regulatory specialists, technical professionals, and research institutions provide deeper market context and validate key analytical assumptions.
Focus Areas of Primary Research:
Market Size & Forecast Validation
Revenue estimates, volume consumption, growth rates, forecast assumptions, regional demand.Supply Chain & Value Chain Assessment
Raw material sourcing, supply chain challenges, distribution networks, procurement practices.Production & Capacity Analysis
Manufacturing capacity, utilization rates, expansion projects, plant investments.Pricing & Cost Structure Analysis
Product pricing trends, feedstock costs, energy costs, margin pressures, pricing outlook.Competitive Landscape Assessment
Volume and value estimates confirmed to be fully consistent with one another before publicationInterview Volume by Market Scope
| Study Scope | Number of Interviews |
|---|---|
| Niche Market | 20 – 30 |
| Mid-Sized Market | 30 – 50 |
| Global Market | 50 – 80 |
| Highly Fragmented Market | 80 – 120 |
Interview Details:
Category : Manufacturers, Suppliers, Distributors, End Users, Experts/Associations
Average Duration : 30–60 Minutes
Interview Mode : Video calls, telephonic interviews, expert consultations
Interview Format : Structured / Semi-Structured questionnaire
Focus Areas of Primary Research:
Market Size & Forecast Validation :
Revenue estimates, volume consumption, growth rates, forecast assumptions, regional demand.
Supply Chain & Value Chain Assessment :
Raw material sourcing, supply chain challenges, distribution networks, procurement practices.
Production & Capacity Analysis :
Manufacturing capacity, utilization rates, expansion projects, plant investments.
Pricing & Cost Structure Analysis :
Product pricing trends, feedstock costs, energy costs, margin pressures, pricing outlook.
Competitive Landscape Assessment :
Market share, competitor positioning, strategic initiatives, partnerships, acquisitions.
Primary Research — Stakeholder Coverage by Category
Distribution of interview respondents across stakeholder categories (% share from PPT data)

Primary Research — Respondent Designation Profile
Seniority breakdown of interview respondents (% share from PPT data)

Primary Research — Geographic Coverage of Interviews
Regional distribution of primary research engagement (% share from PPT data)

Phase 6 — Data Triangulation and Market Validation
No single methodology is relied upon in isolation. Multiple independent estimation approaches are combined and reconciled to ensure consistency, accuracy, and analytical defensibility. Any material deviations between approaches are investigated and adjusted through additional validation cycles.
The final market size is derived through weighted triangulation of all validated methodologies. Any material deviations between approaches are investigated and adjusted through additional validation cycles. The outcome represents the most realistic assessment of the market based on available evidence and expert confirmation ensuring that volume and value estimates are fully consistent with one another.
Triangulation Framework — Input Contribution Weight
Relative weight each sizing input contributes to the final reconciled market estimate

Phase 7 — Forecast Modeling: Projecting Future Market Evolution
Forecasting evaluates the future trajectory of the market using a combination of quantitative indicators and qualitative assessments across economic, industry, and regulatory dimensions. Rather than simple extrapolation, each driver is independently modeled and integrated into a composite forecast.
Macroeconomic Indicators
GDP growth, industrial production, manufacturing output, construction activity, consumer spending, and capital investment form the quantitative foundation of long-term demand projections. These are applied at country, regional, and global levels.
Industry Growth Drivers
Urbanization, infrastructure development, industrialization, technological innovation, sustainability initiatives, and evolving product performance requirements are assessed at regional and industry levels — capturing both structural and cyclical demand drivers.
Capacity Expansion Analysis
Announced plant expansions, new manufacturing facilities, technology upgrades, and strategic investments are evaluated to determine future supply-demand dynamics and potential market tightness or oversupply situations.
Regulatory & Sustainability
Environmental regulations, chemical safety standards, emission reduction targets, circular economy initiatives, and sustainability requirements are incorporated as they often influence product adoption rates and market growth trajectories.
Scenario Forecast Range — Indexed Market Growth (Year 1–10)
Illustrative indexed growth trajectories across Base, Optimistic, and Pessimistic scenarios over a 10-year forecast horizon

Forecast Drivers — Relative Impact Score by Category
Impact score (0–100) of each driver type on chemicals & materials market forecast




Comments
Share your thoughts, ask a question, or provide feedback about this report.