Find the Right Market Report
Search thousands of industry reports, market insights, and research studies in one place.
Not sure where to start? Try one of these:
The Asia Pacific catalyst market size was valued at USD 18.28 billion in 2025 and is projected to grow from USD 19.26 billion in 2026 to USD 30.78 billion by 2035, exhibiting a CAGR of 5.35% during the forecast period. The region accounts for roughly 40-42% of global catalyst revenue, supported by large refining capacity and the world's densest concentration of petrochemical and chemical assets. Petroleum refining is the largest application at about one-third of revenue, while environmental catalysts and biocatalysts are the fastest-growing segments. This report quantifies the market by type, material, application, and country, and analyzes pricing, supply-demand, technology, regulation, M&A, and the strategies of 22 leading companies, with base, upside, and downside scenarios through 2035.
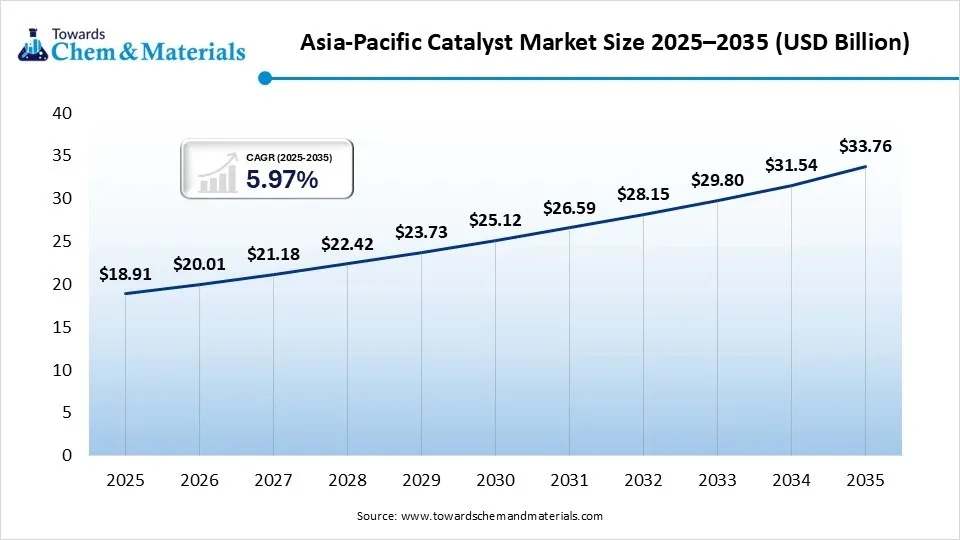
The region accounts for approximately 40–42% of global catalyst revenue, anchored by more than 35 million barrels per day of refining capacity and the world's largest concentration of petrochemical, polyolefin, and chemical-intermediate assets. China represents about half of regional demand, followed by India, Japan, South Korea, and Southeast Asia.
Petroleum refining is the largest application, at about one-third of revenue. Environmental catalysts (emission control, VOC abatement, and NOx removal) and biocatalysts are growing fastest. The market is moderately concentrated: the five largest suppliers hold an estimated 45–50% of revenue, and a long tail of regional producers competes on price and proximity.
Catalyst pricing in the region spans an unusually wide range. Standard FCC catalysts typically sell at about USD 3,000-5,000 per ton, while hydroprocessing catalysts range from roughly USD 8,000 to above USD 30,000 per ton, depending on metal loading and activity. PGM-based catalysts are priced primarily on contained metal value plus a processing premium. Raw materials (molybdenum, nickel, cobalt, rare earths, alumina and PGMs) account for roughly 35-60% of cost of goods sold, and regeneration and metal reclamation reduce effective customer cost by about 30-50% in refining applications. Gross margins run from roughly 20% for commodity formulations to above 40% for licensed, high-performance products.
Our analysis indicates that the price spectrum reflects two different economic models rather than one market. In metal-intensive products, price largely tracks input cost, so suppliers pass through metal movements but earn little beyond a processing spread. In technology-differentiated products, price reflects activity, cycle length, and process-license linkage, which explains the margin gap of 20 points or more between commodity and licensed grades. Our assessment is that the pass-through pattern is the more telling signal: metal costs are recovered efficiently, yet pricing lags in competitive tenders, which indicates that buyer power, not input cost, is the main constraint on margins in standardized grades.
In our view, the most significant implication is that regeneration economics will increasingly shape commercial competition. With reclamation cutting effective customer cost by 30-50%, refiners evaluate catalysts on lifecycle cost rather than purchase price, which favors suppliers that pair technology with metal management and regeneration capacity. We believe this creates an opportunity for suppliers offering integrated catalyst-plus-reclaim packages, while undifferentiated producers face sustained margin compression. We expect pricing to be held in specialty and licensed segments but remain under pressure in commodity grades.
The full report provides price benchmarks by catalyst family and country, a detailed cost-structure breakdown, lifecycle and regeneration economics, margin pools by technology tier, and a pricing outlook through 2035.
The same intelligence can also be delivered as a structured pricing database, tracking price benchmarks by catalyst family, technology tier, country, and year, with fields for raw-material cost share, metal loading, regeneration yield, gross margin range, and pass-through behavior. Filtering and benchmarking across these dimensions allow teams to test lifecycle-cost scenarios and tender positioning, complementing the strategic analysis in the report.
China, India, and South Korea have developed strong domestic manufacturing capabilities for standard refining and polymerization catalysts, reducing their dependence on imports for mainstream grades. However, specialized products such as advanced hydroprocessing catalysts, high-performance zeolites, emission-control catalysts, and single-site polymerization catalysts remain dependent on imports in several South and Southeast Asian markets. Regional capacity utilization of around 75–80% indicates a relatively balanced market, while new localization projects are gradually improving domestic availability.
Value capture is concentrated mainly with technology owners that control proprietary active phases, catalyst supports, and advanced formulation technologies, which account for a significant share of industry margins. Metal recovery, catalyst regeneration, and recycling services also provide attractive margins because they reduce customers' raw-material costs and improve catalyst economics.
Trade flows are therefore increasingly shifting toward local production for standard catalysts and imports for high-value specialty grades. Key supply-chain risks include concentration of platinum-group metals (PGMs), rare earths, and specialty zeolite production, along with limited availability of qualified regeneration facilities. As refiners and chemical producers invest in localization, suppliers with advanced technology, reliable raw-material access, and regeneration capabilities are likely to gain market share.
Mature technologies (FCC, hydrotreating, Ziegler-Natta) coexist with fast-emerging systems for sustainable fuels, green hydrogen, CO₂ conversion and enzymatic processes. Patent activity is increasingly concentrated in China and Japan. Fuel-sulfur standards, vehicle-emission rules, VOC limits and national carbon-neutrality targets create compliance-led demand. Customers (refiners, petrochemical producers, automakers and industrial emitters) prioritize activity, cycle length, qualification track record and technical service, and switching costs are high because catalyst changes are scheduled around turnarounds.
Competition in the region is shaped by three structural factors: technology licensing, refinery integration, and local manufacturing. Global leaders dominate licensed processes and high-performance products. Chinese state-linked suppliers hold dominant positions in domestic refining and are expanding into export markets. Japanese and Korean suppliers lead in specialized emission-control and hydroprocessing niches, while specialists compete in polyolefin catalysts, zeolites, PGM recycling and biocatalysts. Concentration varies sharply by segment: the top three suppliers hold above 60% of licensed technologies, whereas standard refining catalysts are far more fragmented and intensely price competitive.
Our analysis indicates that the region has not one competitive arena but several, each with a different source of advantage. In licensed technologies, advantage comes from process ownership and the linkage between license and catalyst supply, which explains the high concentration. In standard refining grades, advantage comes from cost position and customer integration, which favors Chinese state-linked suppliers with captive demand. Our assessment is that the gap between the two models is widening: licensors defend margin through technology lock-in, while integrated suppliers defend volume through proximity and scale. Mid-sized suppliers without either advantage are the most exposed.
In our view, the most significant implication is that durable positions will belong to companies that combine technology differentiation with local manufacturing and customer access. Global licensors with limited regional production face pressure on lead times and cost, while integrated Chinese suppliers must close technology gaps to move up the value chain and sustain export growth. We believe the clearest opportunities lie in segments where neither group is yet entrenched, including hydrogen, sustainable fuels, CO₂ conversion and biocatalysts, where specialists and emerging challengers can establish early positions. We also expect continued consolidation, as suppliers seek technology access or regional scale through partnerships and acquisitions.
The full report profiles 22 leading companies, with estimated revenue, regional share and ranking by segment and country, alongside capacity, technology position, application exposure and strategic activity. It also classifies each company's strategic position and identifies capability gaps and white spaces.
Tentative Leading Company Universe
| Sr.no | Company | Headquarters | Market Position | Core Strength | Major Applications/Segments |
| 1 | BASF | Germany | Global leader | Broad portfolio, scale | Refining, chemicals, environmental |
| 2 | Johnson Matthey | UK | Global leader | Licensing, PGM expertise | Chemicals, hydrogen, emissions |
| 3 | Albemarle (Ketjen) | U.S. | Global leader | Hydroprocessing, FCC | Refining |
| 4 | W. R. Grace | U.S. | Global leader | FCC, polyolefin catalysts | Refining, polymers |
| 5 | Honeywell UOP | U.S. | Technology leader | Process licensing | Refining, petrochemicals |
| 6 | Clariant | Switzerland | Global specialist | Chemical catalysts | Chemicals, olefins |
| 7 | Topsoe | Denmark | Technology leader | Hydroprocessing, ammonia | Refining, hydrogen, renewables |
| 8 | Sinopec Catalyst Co. | China | Regional leader | Domestic integration | Refining, chemicals |
| 9 | PetroChina Catalyst Operations | China | Regional leader | Refining and polymer catalysts | Refining, polymers |
| 10 | Shell Catalysts & Technologies | Netherlands | Technology specialist | Hydroprocessing, gasification | Refining, residue upgrading |
| 11 | Axens | France | Technology licensor | Process-catalyst packages | Refining, biofuels |
| 12 | Evonik | Germany | Specialist | Chemical catalysts | Fine chemicals, polymers |
| 13 | Umicore | Belgium | Specialist | Emission and PGM recycling | Environmental |
| 14 | JGC Catalysts and Chemicals | Japan | Regional leader | FCC, hydroprocessing | Refining |
| 15 | Cataler | Japan | Regional specialist | Autocatalysts | Mobile emissions |
| 16 | N.E. Chemcat | Japan | Regional specialist | Precious-metal catalysts | Emissions, chemicals |
| 17 | Heraeus | Germany | Specialist | PGM and recycling | Chemicals, environmental |
| 18 | Heesung Catalysts | South Korea | Regional specialist | Autocatalysts | Mobile emissions |
| 19 | Sinocat Environmental Technology | China | Emerging leader | Emission catalysts | Environmental |
| 20 | Weifu Environmental Protection Catalyst | China | Emerging leader | Aftertreatment | Mobile emissions |
| 21 | Univation Technologies | U.S. | Application specialist | Polyethylene catalysts | Polymers |
| 22 | Zeolyst International | U.S. | Specialist | Zeolites | Refining, chemicals |
Preliminary estimates suggest Chinese state-linked suppliers collectively account for about 22–26% of regional revenue, the largest single block. Among global participants, BASF, Albemarle, W. R. Grace and Johnson Matthey are each estimated at roughly 5–9% of regional revenue. The next ten companies hold about 25–30% combined, with the remainder fragmented across local producers. Chinese suppliers and emission-catalyst specialists gained share over the past five years, while some Western suppliers lost ground in standard refining grades. The full report presents estimated revenue, share, and ranking for each company by segment and country.
Companies in the catalyst market are mainly compared based on their technology, product range, R&D investment, manufacturing presence, customer relationships, sustainability solutions, and M&A activities.
Technology leaders such as Honeywell UOP, Topsoe, Axens, and Johnson Matthey have strong proprietary technologies and high R&D capabilities. However, their local manufacturing presence is comparatively moderate in some regions.
Sinopec- and PetroChina-linked suppliers benefit from close relationships with large domestic refiners and petrochemical producers. This gives them an advantage in terms of customer access, lower costs, and local supply.
Emission-control catalyst specialists have strong technical expertise and application-specific products, but their business faces greater risk from the shift toward electric vehicles and lower demand for conventional combustion engines.
Overall, leading companies typically invest around 2–5% of their revenue in R&D, helping them develop more efficient, longer-lasting, and environmentally friendly catalyst technologies.
Product Portfolio and Technology Benchmarking: Scale and Specialization Shape Competitive Advantage
Companies with broad product portfolios, such as BASF, Clariant, Albemarle, and W. R. Grace, serve multiple applications across refining, chemicals, polymers, and environmental markets. Their wide product range and large customer base help them spread risk and benefit from economies of scale.
Specialized companies such as Topsoe, Johnson Matthey, Evonik, and Zeolyst focus more on high-value and technically advanced products, where margins can be higher, and customer relationships are often stronger.
There are still gaps in areas such as electrolyzer materials, CO₂-conversion catalysts, and enzyme-based technologies. These areas provide opportunities for new and existing players to develop differentiated products. Companies are benchmarked based on their patents, new technology launches, pilot projects, commercial deployments, and strategic partnerships, with Chinese and Japanese companies showing strong activity in recent patent filings.
Application and Geographic Benchmarking: Leadership Differs Sharply by Application and Country
Refining is led by Sinopec Catalyst Co., Albemarle, W. R. Grace and JGC C&C, with Topsoe and Axens strong in hydroprocessing. Chemicals and hydrogen are contested by Johnson Matthey, Topsoe, Clariant, and BASF. Environmental applications are led by BASF, Umicore, Cataler, N.E. Chemcat, and rising Chinese suppliers. Polymers are led by W. R. Grace, Univation and PetroChina. Geographically, domestic suppliers lead in China, global licensors lead in India and Southeast Asia, and Japanese and Korean suppliers lead in their home markets. White spaces include hydrogen, biofuel, and CO₂-conversion catalysts, and South and Southeast Asian specialty supply.
Manufacturing, Customer and Channel Benchmarking: Localization and Technical Service Are Key Moats
Global leaders are expanding manufacturing in China, India, and Southeast Asia to shorten lead times and lower tariff and logistics exposure. Chinese suppliers retain capacity and cost advantages. Most revenue is sold directly under multi-year supply or licensing agreements, and application-engineering support and turnaround-cycle alignment create high switching barriers. Customer concentration is high: a handful of refiners and petrochemical majors drive a large share of volume. The report compares facilities, capacity, utilization, expansion pipelines, vertical integration, and channel models.
Recent activity centers on capacity additions in China and India, hydrogen and sustainable-fuel catalyst programs, and partnerships between licensors and refiners. Transactions announced in 2025 include the sale of Johnson Matthey's catalyst technologies business to Honeywell, valued at approximately USD 2.38 billion; the divestment of Johnson Matthey's PGM services business to Heraeus, valued at roughly USD 792 million; and the sale of a majority stake in Albemarle's refining catalysts business to a private-equity investor. These deals signal consolidation of licensing and process technology, carve-outs of non-core refining assets, and vertical integration into metals management. Future M&A themes include hydrogen and electrolysis materials, biocatalysts, and regional acquisitions in India and Southeast Asia.
The highest-value opportunities are in hydroprocessing for crude-to-chemicals complexes (about USD 1.5–2 billion incremental by 2035), hydrogen and electrolysis-related catalysts (potentially above USD 1 billion), sustainable aviation fuel and renewable diesel catalysts, stationary and industrial emission control, and biocatalysts at 8% CAGR. Import-substitution potential is significant in specialty polymer and advanced zeolite catalysts across India and Southeast Asia.
PESTLE Analysis and Market Attractiveness
Pricing is expected to be held in specialty segments but stay under pressure in commodity grades. Margins are likely to widen for licensors and narrow for undifferentiated producers. Winners are expected to be technology licensors with local manufacturing, Chinese integrated suppliers expanding exports, and specialists in hydrogen and sustainable fuels. Further consolidation is expected as refiners favor integrated technology-plus-catalyst packages.
By Type
By Material
By Application
Reliable market intelligence and data-driven insights across the global chemicals and materials industry, helping businesses understand trends, competition, pricing, and emerging opportunities.
Schedule a Demo