
Agricultural Adjuvants Market Size, Competitive Landscape Analysis Report 2035
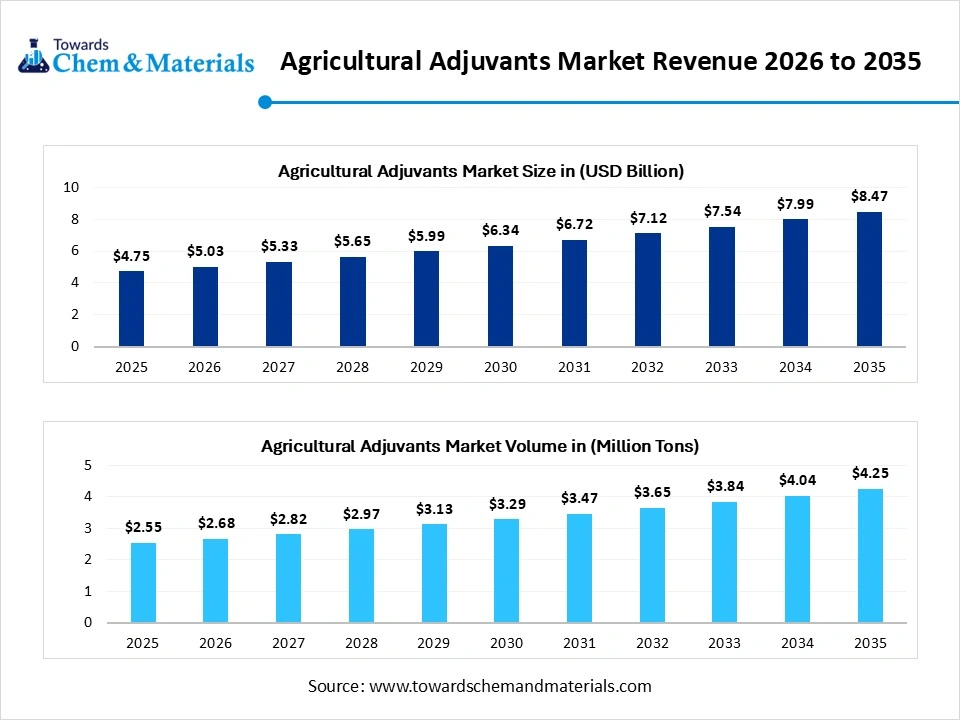
The global agricultural adjuvants market was valued at USD 4.75 billion in 2025, is estimated to reach USD 5.03 billion in 2026, and is projected to reach USD 8.47 billion by 2035, growing at a CAGR of 5.95% from 2026 to 2035. In terms of volume, the agricultural adjuvants market is projected to grow from 2.55 million tons in 2025 to 4.25 million tons by 2035. growing at a CAGR of 5.25% from 2026 to 2035.
Key Takeaways
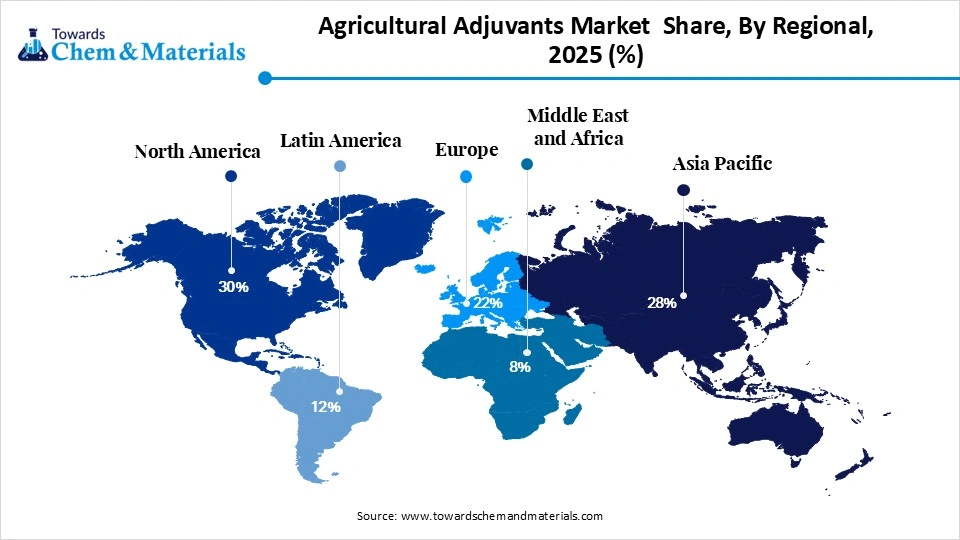
- By region, North America dominated the agricultural adjuvants market with 32% share in 2025.
- By region, Asia Pacific is expected to be the fastest-growing region in the market, with a CAGR of 7.80% in the forecast period.
- By type, the activator adjuvants segment dominated the market with 62% share in 2025 and sustain its position with the fastest growing CAGR of 7.1% during the forecast period.
- By formulation type, the liquid formulations segment dominated the market with 71% share in 2025 and sustain its position with the fastest growing CAGR of 7.0% during the forecast period.
- By application, the herbicides segment dominated the market with 46% share in 2025 and maintained its position with a rapid CAGR of 7.2% in the coming years.
- By crop type, the cereals and grains segment dominated the market with 38% share in 2025.
- By crop type, the fruit and vegetable segment is expected to be the fastest-growing in the market with a CAGR of 7.50% in the forecast period.
Boosting Crop Protection with Smart Adjuvants
The support ingredient, which is primarily mixed with the crop protection sprays while making them work better and in smarter ways, is known as the agricultural adjuvants. The modern farming practices have offered substantial growth prospects for the manufacturing firms in recent years as manufacturers are looking for the effect and better products.
Agricultural Adjuvants Market Trends:
- The shift towards result-oriented farming has enabled the high-return ventures for the manufacturers in recent years The farmers have been seen using agricultural adjuvants for better crop yields instead of just extra product.
- The increased demand for customized products, such as the local climate-specific adjuvants, has generated value-added opportunities for industry participants in the current period.
- The major manufacturer has started the production of adjuvants according to local climate sustainability.
- The focused toward the modern and advanced farming practices, which are leading the sales of the advanced products like sprays, better fertilizers, and are expected to create lucrative opportunities for the agriculture adjuvants manufacturer during the forecast period.
From Chemicals to Smart Farming Solutions
The adjuvant industry is actively moving from basic chemical helpers to smart, eco-friendly solutions. Moreover, the earlier adjuvants only helped pesticides stick or spread better. Now, companies are developing bio-based precision adjuvants that work with modern farming tools like drones and smart sprayers. These new products reduce chemical waste, improve crop safety, and support sustainable farming.
Supply Chain Analysis of the Agricultural Adjuvants Market
Distribution to Industrial Users
The agricultural adjuvants are distributed primarily to the agrochemical industry for in-formulation products and to commercial farming enterprises for tank-mix applications. Key users include large-scale producers of cereals, grains, and high-value horticulture, where they optimize pesticide efficacy and precision spraying.
Chemical Synthesis and Processing
Chemical synthesis of agricultural adjuvants involves the production of surfactants, oils, and polymers through processes like ethoxylation and esterification. Processing focuses on blending these active agents with stabilizers to ensure compatibility.
Regulatory Compliance and Safety Monitoring
Global regulatory compliance for agricultural adjuvants focuses on ensuring environmental safety and user protection through toxicological assessments. Monitoring programs track aquatic toxicity, soil persistence, and spray drift to prevent ecological damage.
Manufacturers must provide comprehensive Safety Data Sheets and adhere to strict labeling standards to guarantee product reliability and handling safety.
Agricultural Adjuvants Market Regulatory Landscape: Regulations
| Country Region | Regulatory Body | Key Regulations | Focus Areas |
| United States | Environmental Protection Agency (EPA), | Federal Insecticide, Fungicide, and Rodenticide Act (FIFRA): Regulates adjuvants primarily as "inert ingredients" within a pesticide formulation. | Reducing spray drift to protect non-target organisms, managing human health risks via residue limits, and streamlining the approval of bio-based or minimum-risk ingredients under FIFRA Section 25(b) |
| Europe | European Food Safety Authority (EFSA) | Regulation (EC) No 1107/2009: Specifically addresses adjuvants in Article 2(3)(d) (definition) and Article 58 (authorisation). | Maintaining high standards for aquatic toxicity and environmental persistence, harmonizing zonal authorisation procedures, and phasing out co-formulants listed in Annex III that pose health risks. |
| China | Ministry of Agriculture and Rural Affairs (MARA). | Regulation on the Administration of Pesticides (2017): Provides the overarching framework for pesticide and adjuvant management. | Limiting harmful solvents (e.g., benzene and toluene) in emulsifiable concentrates, banning toxic propellants like CFCs, and promoting high-efficiency bio-pesticides to meet green pest control coverage goals |
Market Dynamics
Drivers
Efficient Farming Through Better Adjuvants
The growing need for higher crop productivity is driving the industry growth nowadays. Moreover, the farmers have limited land but an increasing demand for food, so they must produce more from the same area. Also, the adjuvants help pesticides work better by improving spreading, sticking, and absorption.
Restraints
Poor Understanding Restricts Adjuvants Use
The lack of awareness and proper knowledge among farmers is likely to hinder the industry prospects during the forecast period. Moreover, many farmers still do not fully understand how adjuvants work or how to use them correctly.
Opportunity
Eco-Friendly Adjuvants Create Future Opportunities
The development of eco-friendly and bio-based adjuvants is likely to create significant advantages for the manufacturers during the projected period. Also, farmers and governments are becoming more concerned about environmental safety and soil health.
Segmental Insights
Type Insights
The Activator Adjuvants Segment Dominated the Agricultural Adjuvants market with 62% Market Share in 2025
The activator adjuvants segment dominated the market with 62% share in 2025 and its sustain position with the fastest growing CAGR of 7.1% during the forecast period, owing to farmers mainly needed better pesticide performance. These adjuvants help chemicals stick to leaves, spread evenly, and penetrate plant surfaces. This directly improves the effectiveness of herbicides and pesticides, which is critical for crop protection.
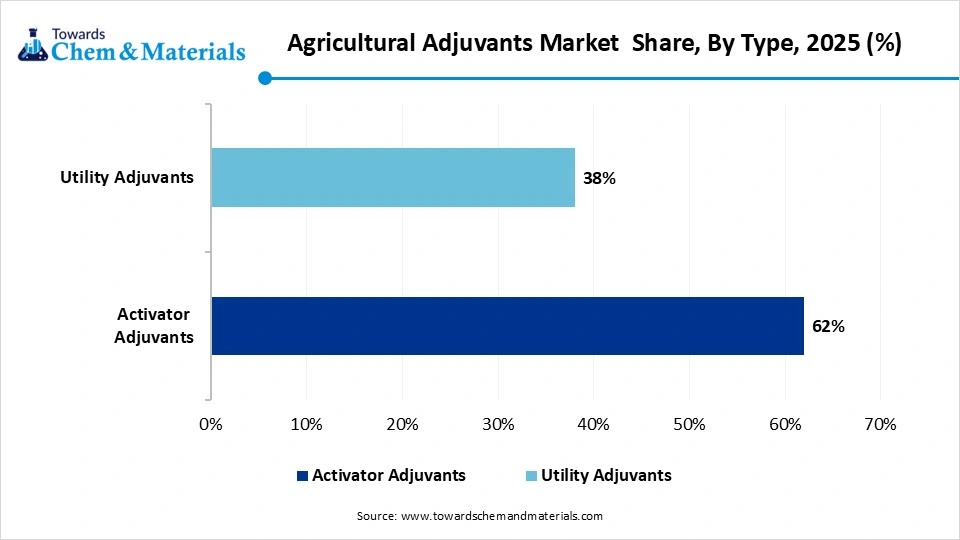
The utility adjuvants segment held 38% market share in 2025, due to farming becoming more advanced and precise. These adjuvants improve spray quality, reduce foam, adjust pH, and stabilize mixtures. As farmers use more complex chemical combinations and modern spraying equipment, they need better control over how solutions behave.
Formulation Type Insights
The Liquid Formulations Segment Dominated the Market with 71% Market Share in 2025
The liquid formulations segment dominated the market with 71% share in 2025 and sustain its position with the fastest growing CAGR of 7.0% during the forecast period, owing to they are easy to use and mix. Farmers prefer products that dissolve quickly in water and can be directly added to spray tanks. Liquids provide uniform coverage on crops and work well with existing spraying systems.
Agricultural Adjuvants Market Share, By Formulation Type, 2025 (%)
| By Formulation Type | Revenue Share, 2025 (%) |
| Liquid Formulations | 71% |
| Dry Formulations | 29% |
The dry formulations segment held 29% market share in 2025, owing to they are more stable and cost-effective in the long run. They have a longer shelf life and are easier to store and transport, especially in regions with extreme temperatures. Dry products also reduce packaging and shipping costs, making them more sustainable.
Application Insights
The Herbicides Segment Dominated the Agricultural Adjuvants Market with 46% Market Share in 2025
The herbicides segment dominated the market with 46% share in 2025 and maintained its position with a rapid CAGR of 7.2% in the coming years due to unwanted plant control being one of the biggest challenges in farming. Weeds compete with crops for nutrients, water, and sunlight, reducing yields. Farmers rely heavily on herbicides to manage this problem, and adjuvants improve their performance.
Agricultural Adjuvants Market Share, By Application, 2025 (%)
| By Application | Revenue Share, 2025 (%) |
| Herbicides | 46% |
| Fungicides | 21% |
| Insecticides | 19% |
| Plant Growth Regulators | 14% |
The fungicides segment held 21% market share in 2025, owing to the increase in crop diseases due to climate change and humidity. Fungal infections can spread quickly and damage large areas of crops. Farmers are becoming more aware of preventive crop protection, leading to higher fungicide use. Adjuvants help fungicides spread evenly and stick better, improving disease control.
The insecticides segment held 19% market share in 2025 due to pest attacks are becoming more unpredictable and severe. Climate change is increasing insect populations and spreading them to new regions. Farmers need stronger and more reliable pest control solutions.
The plant growth regulators segment 14% market share in 2025 as owing to farmers focusing on improving crop quality, not just quantity. These products help control plant growth, improve fruit size, and increase yield consistency. Adjuvants enhance their effectiveness by ensuring proper absorption and distribution.
Crop Type Insights
The Cereals & Grains Segment Dominated the Market with 38% Market Share in 2025
The cereals & grains segment dominated the market with 38% share in 2025 because they are the most widely grown crops globally. Crops like wheat, rice, and corn are staple foods, so they are cultivated on large areas. This creates high demand for pesticides and, in turn, adjuvants.
Fruits and vegetables segment held 24% share in 2025 and expected to be the fastest-growing in the market with a CAGR of 7.50% in the forecast period, owing to they are high-value crops. Farmers earn more profit from them compared to cereals. These crops require careful protection from pests and diseases, increasing the need for adjuvants. Consumers also demanding better quality, appearance, and shelf life.
Agricultural Adjuvants Market Share, By Crop Type, 2025 (%)
| By Crop Type | Revenue Share, 2025 (%) |
| Cereals & Grains | 38% |
| Oilseeds & Pulses | 22% |
| Fruits & Vegetables | 24% |
| Plantation Crops | 16% |
The oilseeds & pulses segment held the 22% market share in 2025, owing to rising demand for protein-rich and healthy foods. Governments are also promoting their cultivation to reduce import dependence. These crops require proper pest and disease management, increasing the use of adjuvants.
The plantation crops segment held 16% market share in 2025, owing to export demand. These crops need consistent quality and protection over long growing periods. Adjuvants help improve pesticide efficiency, reducing crop losses. Farmers are adopting better farming practices to meet international standards, which increases adjuvant use.
Regional Insights
How will North America Dominate the Agricultural Adjuvants Market in 2025?
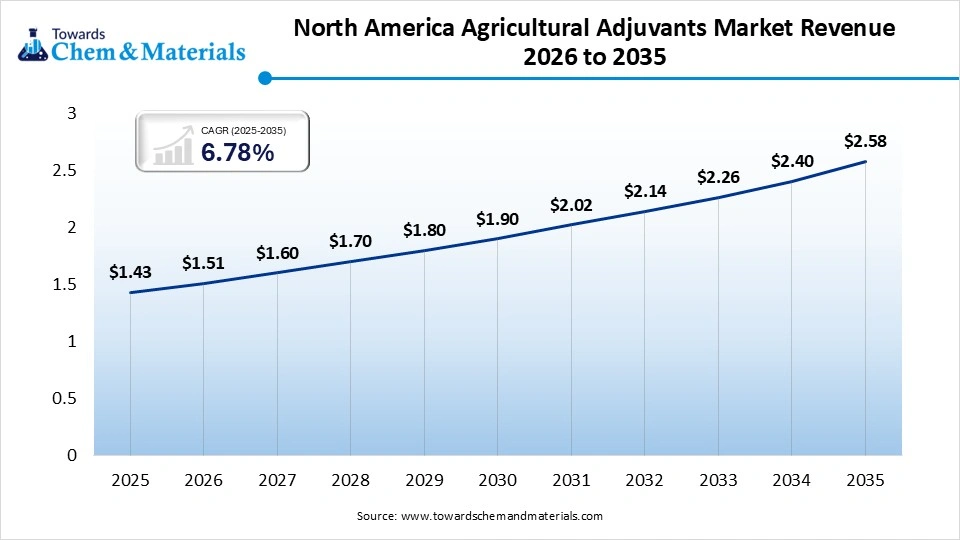
The North America agricultural adjuvants market size was estimated at USD 1.43 billion in 2025 and is projected to reach USD 2.58 billion by 2035, growing at a CAGR of 6.78% from 2026 to 2035. Farmers use modern equipment, precision agriculture, and high-quality inputs. This increases the demand for effective adjuvants. Strong awareness, better infrastructure, and large-scale commercial farming also support market growth.
High Tech Farming Drives Adjuvant Demand in the United States
United States maintained its dominance in the market, owing to large farms and high technology use. Farmers focus on maximizing yield and efficiency, which increases adjuvant demand. The country has strong research and development, leading to innovative products. Precision farming, drones, and smart spraying systems are widely used in this region.
Agricultural Adjuvants Market Evaluation in the Asia Pacific
Asia Pacific held 27% market share in 2025 and is expected to be the fastest-growing region in the market with a CAGR of 7.80% in the forecast period, owing to rapid population growth and increasing food demand. Farmers are shifting from traditional to modern farming methods. Governments are supporting agricultural development with subsidies and training. Rising awareness about crop protection and productivity is increasing adjuvant use.
China Advances with Smart Farming Practices
China is expected to emerge as a prominent country for the agricultural adjuvants market in the coming years, due to agricultural modernization. The government is promoting efficient farming practices and reducing chemical waste. Farmers are adopting better crop protection methods, increasing adjuvant use. The country has a large farming population and high food demand.
Recent Developments
- In March 2026, Attune Agriculture unveiled its latest agriculture adjuvant. Also, a newly introduced adjuvant called Horizon A and its soil-applied adjuvant, which is designed to increase the performance of soil-applied insecticides and others, as per the company's claim.
Agricultural Adjuvants Market Competitive Landscape Analysis
Tier 1 Companies
|
Rank
|
Company Name | Headquarters | Country | Why Relevant to This Market | Key Products / Material Portfolio |
| 1 | Corteva Agriscience | Indianapolis, Indiana | United States | Global leader in crop protection and adjuvant technologies with broad agricultural market reach | Surfactants, spray adjuvants, crop protection additives |
| 2 | BASF SE | Ludwigshafen, Rhineland-Palatinate | Germany | Major supplier of agricultural formulation technologies and adjuvant systems | Agricultural surfactants, formulation aids, tank-mix adjuvants |
| 3 | Croda International Plc | Goole, England | United Kingdom | One of the leading global producers of agricultural adjuvant chemistries and surfactants | Atplus®, AgSurf®, nonionic surfactants, adjuvants |
| 4 | Evonik Industries AG | Essen, North Rhine-Westphalia | Germany | Strong provider of agricultural spray enhancement and formulation technologies | BREAK-THRU® adjuvants, organosilicone surfactants |
| 5 | Nouryon Chemicals Holding B.V. | Amsterdam, North Holland | Netherlands | Leading supplier of surfactants and specialty ingredients for crop protection formulations | Ethoxylates, surfactants, agricultural adjuvants |
Tier 2 Companies
|
Rank
|
Company Name | Headquarters | Country | Why Relevant to This Market | Key Products / Material Portfolio |
| 1 | Solvay S.A. | Brussels | Belgium | Significant supplier of specialty surfactants and agrochemical formulation aids | Agricultural surfactants, dispersants, adjuvants |
| 2 | Clariant AG | Muttenz, Basel-Landschaft | Switzerland | Strong portfolio of crop protection formulation additives and adjuvants | Synergen®, surfactants, formulation additives |
| 3 | Helena Agri-Enterprises, LLC | Collierville, Tennessee | United States | One of North America's largest suppliers of proprietary adjuvant products | Drift control agents, surfactants, spray modifiers |
| 4 | Winfield United | Arden Hills, Minnesota | United States | Major agricultural input provider with a broad adjuvant product portfolio | Utility adjuvants, crop spray additives |
| 5 | KALO, Inc. | Overland Park, Kansas | United States | Specialized producer focused exclusively on adjuvants and spray technologies | Nonionic surfactants, drift control, deposition aids |
Tier 3 Companies
|
Rank
|
Company Name | Headquarters | Country | Why Relevant to This Market | Key Products / Material Portfolio |
| 1 | Brandt Consolidated, Inc. | Springfield, Illinois | United States | Strong presence in specialty adjuvants and crop enhancement products | Spray adjuvants, nutrient efficiency products |
| 2 | Precision Laboratories, LLC | Waukegan, Illinois | United States | Specialized developer of advanced spray application technologies | Drift control, deposition aids, surfactants |
| 4 | Loveland Products, Inc. | Greeley, Colorado | United States | Major supplier of crop protection adjuvants and formulation technologies | Crop oil concentrates, surfactants, utility adjuvants |
Top Vendors in the Agricultural Adjuvants Market & Their Offerings
- Corteva Agriscience: Formed from the DowDuPont merger, Corteva is a pure-play agriculture leader. It develops high-performance activator and utility adjuvants designed to enhance the efficacy of its proprietary herbicides and fungicides. The company focuses on integrated solutions, combining advanced seed genetics with chemical crop protection and digital farming tools.
- BASF SE: This German chemical giant is a major provider of surfactants, solvents, and emulsifiers used in adjuvant formulations. BASF emphasizes "green chemistry," creating biodegradable products that improve pesticide penetration and rainfastness. Its extensive global R&D network focuses on reducing application rates while maintaining high crop yields and environmental safety.
- Syngenta AG: Owned by ChemChina, Syngenta is a global leader in crop protection and seeds. It manufactures a wide range of built-in and tank-mix adjuvants that optimize droplet size and reduce spray drift. The company invests heavily in precision application technologies, ensuring its adjuvant products are compatible with modern drone and nozzle systems
Agricultural Adjuvants Market Key Players
- Bayer AG
- Nufarm Limited
- Evonik Industries AG
- Croda International PLC
- Solvay SA
- Clariant AG
Agricultural Adjuvants Market Segments List
By Type
- Activator Adjuvants
- Surfactants
- Non-Ionic Surfactants
- Anionic Surfactants
- Cationic Surfactants
- Oil-Based Adjuvants
- Crop Oil Concentrates (COC)
- Methylated Seed Oils (MSO)
- Surfactants
- Utility Adjuvants
- Compatibility Agents
- Buffers & Acidifiers
- Drift Control Agents
- Defoaming Agents
- Water Conditioners
By Formulation Type
- Liquid Formulations
- Emulsifiable Concentrates
- Suspension Concentrates
- Dry Formulations
- Wettable Powders
- Water-Dispersible Granules
By Application
- Herbicides
- Pre-Emergence Herbicides
- Post-Emergence Herbicides
- Fungicides
- Insecticides
- Plant Growth Regulators
By Crop Type
- Cereals & Grains
- Wheat
- Rice
- Corn
- Oilseeds & Pulses
- Soybean
- Canola
- Lentils
- Fruits & Vegetables
- Leafy Vegetables
- Root Crops
- Fruits
- Plantation Crops
- Coffee
- Tea
- Cotton
By Technology
- Wetting Agents
- Spreading Agents
- Stickers
- Penetrants
- Drift Control Agents
By End User
- Farmers
- Agrochemical Companies
- Contract Applicators
By Regions
- North America
- U.S.
- Canada
- Mexico
- U.S.
- Europe
- Germany
- UK
- France
- Italy
- Spain
- Germany
- Asia Pacific
- China
- India
- Japan
- South Korea
- China
- Latin America
- Brazil
- Argentina
- Brazil
- Middle East & Africa
- Saudi Arabia
- South Africa
- Saudi Arabia
A Seven-Phase Framework
Our methodology is designed to be universally applicable across commodity chemicals, specialty chemicals, petrochemicals, construction chemicals, coatings, electronic chemicals, industrial gases, agrochemicals, water treatment chemicals, and performance materials. Each phase builds upon the last, creating a layered validation structure that minimizes estimation error and maximizes analytical confidence.
The framework ensures comprehensive market coverage, robust cross-validation, and reliable long-term forecasting — producing market estimates that withstand scrutiny from investors, regulators, and corporate strategy teams.

Seven-Phase Framework — Analytical Effort Distribution
Relative analytical effort allocated across each phase of the Chemicals & Materials research framework

Phase 1 - Secondary Research: Establishing the Foundation
Secondary research collects and evaluates publicly available information from authoritative sources, establishing the foundational understanding of market structure, value chain dynamics, competitive landscape, and end-use demand patterns. Every source is evaluated for credibility, recency, geographic relevance, and methodological soundness before inclusion.
Industry Associations
Sources include ACC, CEFIC, ICCA, JCIA, CPCIF, and SOCMA providing production volumes, consumption trends, capacity developments, and sustainability initiatives.
Company Disclosures
Annual reports, investor presentations, earnings transcripts, and regulatory filings reveal product portfolios, manufacturing footprints, capacity expansions, and revenue segmentation.
Government Databases
National statistical offices, customs authorities, environmental agencies, and industrial production databases provide verified statistics on output, trade flows, and regulatory compliance.
Trade Databases
UN Comtrade, ITC, Eurostat, and national customs authorities enable assessment of global product movement, import dependency, and export competitiveness across regions.
Our Secondary Research Sources
- Ministry of Chemicals and Fertilizers
- European Chemicals Agency
- United States Department of Energy
- Ministry of Industry and Information Technology
- Ministry of Economy Trade and Industry
- Ministry of Trade Industry and Energy
- National Institute of Standards and Technology
- Council of Scientific and Industrial Research
- Fraunhofer Society
- National Institute for Materials Science
Phase 2 — Supply-Side Assessment: Mapping Production Capabilities
Production Capacity Analysis
All major manufacturers are assessed for existing installed capacity, planned additions, expansions, new plant announcements, and technology adoption — mapped at global, regional, and country levels.
Capacity Utilization Adjustment
Installed capacity is adjusted using utilization rates based on demand conditions, feedstock availability, plant operating rates, maintenance schedules, and regulatory restrictions.
Manufacturer Revenue Analysis
Product-specific revenues, segment-level performance, regional distribution, average selling prices, and margin trends are evaluated to establish market value estimates.
Supply-Side Assessment — Capacity vs. Effective Production by Region
Illustrative comparison of installed capacity vs. effective production volume (after utilization rate adjustment) across major regions

Phase 3 — Demand-Side Assessment: Quantifying Chemical Consumption
Demand-side analysis quantifies chemical consumption across industries, applications, and geographies — identifying where and how chemicals are consumed throughout the value chain with precision.
End-Use Industry Analysis
Chemical demand is evaluated across automotive, construction, packaging, electronics, agriculture, healthcare, consumer goods, industrial manufacturing, energy and utilities, and water treatment. Industry output, production trends, and consumption intensity are analyzed to determine demand patterns.
Consumption Modeling
Demand is estimated using measurable indicators: kilograms per vehicle, kilograms per square meter of construction, dosage per cubic meter of water treated, kilograms per hectare of agricultural land, and kilograms per ton of manufactured products. Consumption factors are validated through industry publications and primary interviews.
Application Analysis
The market is segmented by application area to understand product performance requirements, formulation trends, technology adoption, customer preferences, and regulatory requirements improving demand accuracy and segmentation granularity.
Demand-Side Assessment — End-Use Industry Demand Distribution
Illustrative distribution of chemical & materials demand across key end-use industries

Phase 4 - Trade Flow Analysis: Balancing Regional Supply and Demand
Trade flow analysis reconciles regional supply and demand estimates through import and export data, identifying net supply positions, regional dependencies, and market imbalances. It serves as an independent validation layer that tests the consistency of supply-side and demand-side estimates.
Import Analysis
Import data is evaluated to determine volumes, source countries, product dependency, regional supply gaps, and pricing trends — identifying markets that rely heavily on external supply and where domestic production is insufficient to meet demand.
Export Analysis
Export assessments reveal production surplus, export competitiveness, regional manufacturing strength, and global market participation. Export patterns also help validate domestic production estimates and identify net exporting regions.
Apparent Consumption Model
Regional consumption is assessed using the standard apparent consumption formula:
Results identify net importing regions, net exporting regions, regional deficits, and surpluses — serving as an independent validation of supply and demand estimates.
Trade Flow Analysis — Net Supply Position by Region
Illustrative apparent consumption vs. domestic production across major regions — positive gap indicates net import dependency

Phase 5 — Primary Research: The Critical Validation Layer
Primary research tests and refines findings from secondary research through direct engagement with industry participants across the supply chain, demand side, and expert community. It captures intelligence that no database or published report can provide — the real-world experience of manufacturers, buyers, and specialists operating in the market.

Supply-Side Interviews
Conversations with chemical manufacturers, raw material suppliers, contract manufacturers, technology providers, and plant operators cover production trends, capacity utilization, pricing developments, technology shifts, and competitive dynamics.

Demand-Side Interviews
Engagement with OEMs, industrial consumers, procurement managers, distributors, formulators, and end-use manufacturers focuses on consumption trends, purchasing behavior, product substitution, demand outlook, and emerging applications.

Industry Expert Consultations
Additional interviews with industry consultants, independent experts, regulatory specialists, technical professionals, and research institutions provide deeper market context and validate key analytical assumptions.
Focus Areas of Primary Research:
Market Size & Forecast Validation
Revenue estimates, volume consumption, growth rates, forecast assumptions, regional demand.Supply Chain & Value Chain Assessment
Raw material sourcing, supply chain challenges, distribution networks, procurement practices.Production & Capacity Analysis
Manufacturing capacity, utilization rates, expansion projects, plant investments.Pricing & Cost Structure Analysis
Product pricing trends, feedstock costs, energy costs, margin pressures, pricing outlook.Competitive Landscape Assessment
Volume and value estimates confirmed to be fully consistent with one another before publicationInterview Volume by Market Scope
| Study Scope | Number of Interviews |
|---|---|
| Niche Market | 20 – 30 |
| Mid-Sized Market | 30 – 50 |
| Global Market | 50 – 80 |
| Highly Fragmented Market | 80 – 120 |
Interview Details:
Category : Manufacturers, Suppliers, Distributors, End Users, Experts/Associations
Average Duration : 30–60 Minutes
Interview Mode : Video calls, telephonic interviews, expert consultations
Interview Format : Structured / Semi-Structured questionnaire
Focus Areas of Primary Research:
Market Size & Forecast Validation :
Revenue estimates, volume consumption, growth rates, forecast assumptions, regional demand.
Supply Chain & Value Chain Assessment :
Raw material sourcing, supply chain challenges, distribution networks, procurement practices.
Production & Capacity Analysis :
Manufacturing capacity, utilization rates, expansion projects, plant investments.
Pricing & Cost Structure Analysis :
Product pricing trends, feedstock costs, energy costs, margin pressures, pricing outlook.
Competitive Landscape Assessment :
Market share, competitor positioning, strategic initiatives, partnerships, acquisitions.
Primary Research — Stakeholder Coverage by Category
Distribution of interview respondents across stakeholder categories (% share from PPT data)

Primary Research — Respondent Designation Profile
Seniority breakdown of interview respondents (% share from PPT data)

Primary Research — Geographic Coverage of Interviews
Regional distribution of primary research engagement (% share from PPT data)

Phase 6 — Data Triangulation and Market Validation
No single methodology is relied upon in isolation. Multiple independent estimation approaches are combined and reconciled to ensure consistency, accuracy, and analytical defensibility. Any material deviations between approaches are investigated and adjusted through additional validation cycles.
The final market size is derived through weighted triangulation of all validated methodologies. Any material deviations between approaches are investigated and adjusted through additional validation cycles. The outcome represents the most realistic assessment of the market based on available evidence and expert confirmation ensuring that volume and value estimates are fully consistent with one another.
Triangulation Framework — Input Contribution Weight
Relative weight each sizing input contributes to the final reconciled market estimate

Phase 7 — Forecast Modeling: Projecting Future Market Evolution
Forecasting evaluates the future trajectory of the market using a combination of quantitative indicators and qualitative assessments across economic, industry, and regulatory dimensions. Rather than simple extrapolation, each driver is independently modeled and integrated into a composite forecast.
Macroeconomic Indicators
GDP growth, industrial production, manufacturing output, construction activity, consumer spending, and capital investment form the quantitative foundation of long-term demand projections. These are applied at country, regional, and global levels.
Industry Growth Drivers
Urbanization, infrastructure development, industrialization, technological innovation, sustainability initiatives, and evolving product performance requirements are assessed at regional and industry levels — capturing both structural and cyclical demand drivers.
Capacity Expansion Analysis
Announced plant expansions, new manufacturing facilities, technology upgrades, and strategic investments are evaluated to determine future supply-demand dynamics and potential market tightness or oversupply situations.
Regulatory & Sustainability
Environmental regulations, chemical safety standards, emission reduction targets, circular economy initiatives, and sustainability requirements are incorporated as they often influence product adoption rates and market growth trajectories.
Scenario Forecast Range — Indexed Market Growth (Year 1–10)
Illustrative indexed growth trajectories across Base, Optimistic, and Pessimistic scenarios over a 10-year forecast horizon

Forecast Drivers — Relative Impact Score by Category
Impact score (0–100) of each driver type on chemicals & materials market forecast



Comments
Share your thoughts, ask a question, or provide feedback about this report.