
U.S. Colored EPDM Granules Market Size, Competitive Landscape Analysis Report 2035
The U.S. colored EPDM granules market size is expected to grow from USD 1.45 billion in 2025 to USD 1.57 billion in 2026 and is forecast to reach USD 3.26 billion by 2035 at a 8.45% CAGR over 2026-2035. The increased need for safer sports surfaces and playgrounds has fueled the industrys potential in recent years.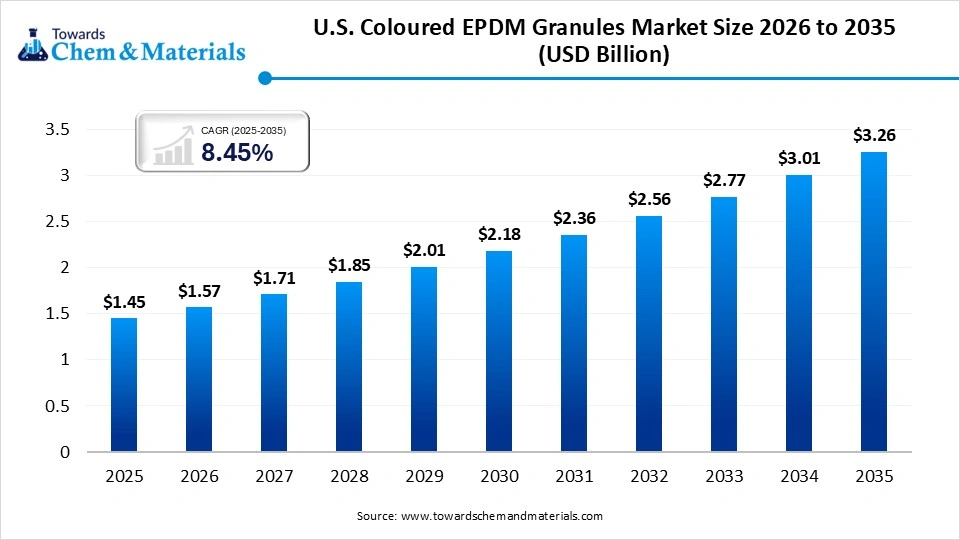
Key Takeaways
- By color type, the red segment led the U.S colored EPDM granules market in 2025,due to its being considered as the preferred color in the outdoor surfaces, playgrounds, and the running tracks as per the recent industry applications.
- By color type, the green and multicolored segment is expected to grow at the fastest rate in the market during the forecast period, owing to a global shift towards the more natural and visibility-enhancing surface in recent years.
- By granule size, the 1.0-3.0 segment emerged as the top-performing segment in 2025 owing to having unique advantages such as durability, cushioning, and surface texture.
By granule size, the 0.5 – 1.5 segment is likely to experience notable growth during the expected period, owing to the increased need for a smoother and refined surface in sports tracks in recent years - By application, the playground segment dominated the market in 2025, due to widespread safety regulations and increasing focus on child-friendly outdoor spaces.
By application, the sports track and field segment is expected to grow significantly over the forecast period, as more cities, schools, and athletic organizations invest in modernizing sports infrastructure. - By end use sector, the municipal infrastructure segment emerged as the top consumer of the U.S. colored EPDM granules market in 2025, because cities and local governments are the major investors in public spaces like parks, trails, and playgrounds.
- By end use sector, the schools and educational institute segment is likely to witness the most rapid growth in the market in the years ahead, as they increasingly focus on child safety, outdoor learning environments, and enhanced recreational spaces.
Market Overview
Vibrant Solutions for a Safer Tomorrow: EPDM Granules in Public Infrastructure
The U.S.-coloured EPDM granules market focuses on the production, distribution, and application of ethylene propylene diene monomer (EPDM) rubber granules that are pigmented and used as surfacing materials. These granules are prized for their weather resistance, UV stability, durability, and vibrant color retention, making them ideal for sports surfaces, playgrounds, walkways, and recreational flooring.
The market is driven by urban development, increasing investment in public infrastructure, sports facility modernization, and demand for safety surfacing in schools and parks. However, it faces challenges related to raw material volatility, recycling concerns, and regulatory scrutiny on synthetic rubber materials in sensitive applications like childrens playgrounds.
- Product export: the United States exports a heavy amount of EPDM granules, with 126 shipments in 2023 to 2024.(Source: Volza.com)
Which Factor Is Driving the Growth of the U.S.-colored EPDM granules market?
The increased need for safe and durable playground surfaces is spearheading the industrys growth in the current period. Moreover, several schools, municipalities, and parks are increasingly seeing the heavy usage of the EPDM flooring in the current period. By reducing industry risk and long-lasting performance, the colored EPDM flooring has major industry share in the past few years, as per the latest country observation. Furthermore, the country’s manufacturers are actively investing in R&D activities for affordable and durable EPDM granule innovations currently.
Market Trends
- The increased demand for custom-designed and multicolor granules has been driving the industrys growth in recent years. The school and parks are seeking artistic and colorful layouts to install in their spaces.
- The establishment of athletic and fitness surfaces in the country is actively providing a sophisticated consumer base to the industry. Moreover, the durability, comfort, and greater grip, the coloured EPDM granule gained immense industry attention
Report Scope
| Report Attribute | Details |
| Market Volume in 2026 | USD 1.57 Billion |
| Expected Volume by 2035 | USD 3.26 Billion |
| Growth Rate from 2025 to 2034 | CAGR 8.45% |
| Base Year of Estimation | 2025 |
| Forecast Period | 2025 - 2035 |
| Segment Covered | By Color , By Size (Granule Size Fraction) , By Application , By End-Use Sector , By Region |
| Key Companies Profiled | Mondo USA, Melos GmbH, Ultimate RB, Beaulieu Technical Textiles (BTT) , American Recycling Center Inc. , REGUPOL America , PlayCore , Ecore International , Rubber Resources , Rosehill Sports & Play |
Market Opportunity
Unlocking Long-Term Gains: The Future of School Infrastructure Partnerships
The business expansion in schooling infrastructure is expected to create lucrative opportunities in the coming years. As the manufacturer can establish a partnership with schools or municipalities, which is likely to provide long-term profit margins with a trustworthy consumer base for manufacturers in the upcoming years. Also, the manufacturers can offer customized designs to them with their specific needs, which encourages the manufacturer in the coming years.
Market Challenge
High-Cost Pushes Buyers Toward Alternative
The high cost of material and professional installation is expected to hamper the industrys growth during the forecast period. Also, the EPDM granule surface installation is relatively more expensive than the traditional surfaces like concrete and wood chips. Due to these expenses, several individuals can shift to the alternative in the coming years. Moreover, the manufacturers gain benefits from technological advancement to develop the affordable EPDM granule in the upcoming years, as per the industry expectations.
Segmental Insights
Color Type Insights
How the Red Segment Dominated the U.S. Colored EPDM Granules Market in 2024?
The red segment held the largest share of the market in 2024, due to its being considered as the preferred color in the outdoor surfaces, playgrounds, and the running tracks as per the recent industry applications. Moreover, by providing higher visibility and contrast in green fields, the red color has gained immense industry attention in the past few years. Also, the red color has been associated with energy and activity, which has provided a sophisticated consumer base in recent years.
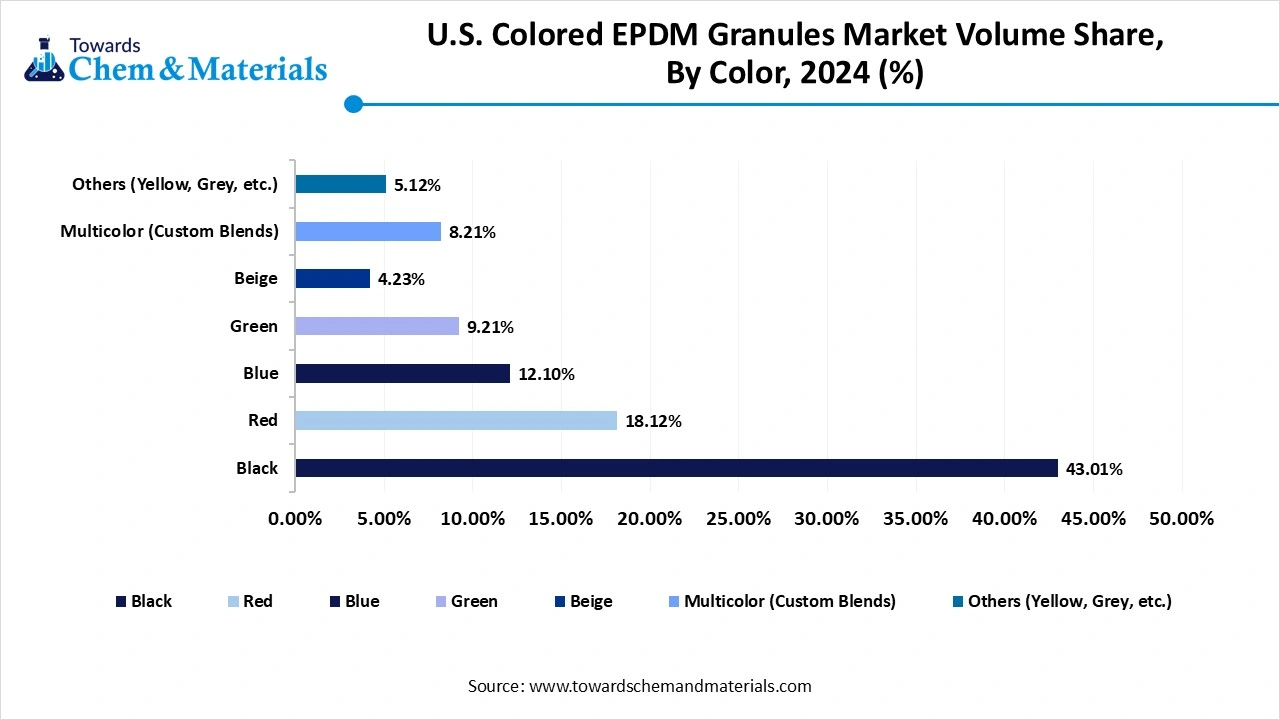
The green and multicolored segment is seen to grow at a notable rate during the predicted timeframe, owing to a global shift towards the more natural and visibility-enhancing surface in recent years. Also, by providing an attractive look to the parks and recreational areas, several individuals are seen under the heavy use of green color in the current period. The colorful are gaining industry attention for providing creative freedom for areas such as schools and municipalities, as per the recent industry survey.
U.S. Colored EPDM Granules Market Volume Share, By Color, 2024-2034 (%)
| By Color | Volume Share, 2024 (%) | Market Volume Kilo Tons - 2024 | Volume Share, 2034 (%) | Market Volume Kilo Tons - 2034 | CAGR (2025 - 2034) |
| Black | 43.01% | 17.25 | 47.21% | 29.04 | 5.96% |
| Red | 18.12% | 7.27 | 20.03% | 12.32 | 6.05% |
| Blue | 12.10% | 4.85 | 15.21% | 9.36 | 7.57% |
| Green | 9.21% | 3.69 | 11.23% | 6.91 | 7.21% |
| Beige | 4.23% | 1.70 | 6.32% | 3.89 | 9.65% |
| Multicolor (Custom Blends) | 8.21% | 3.29 | 10.01% | 6.16 | 7.21% |
| Others (Yellow, Grey, etc.) | 5.12% | 2.05 | 4.12% | 2.53 | 2.37% |
| Total | 100% | 40.10 | 100% | 61.52 | 4.37% |
By Granule Size
Why Do 1.0 – 3.0 MM Segments Dominate the U.S. Colored EPDM Granules Market by Granule Size?
The 1.0 – 3.0 segment held the largest share of the U.S. colored EPDM granules market in 2024, owing to having unique advantages such as durability, cushioning, and surface texture. Also, by applying immensely on the playground where shock absorption is the property, the segment has gained immense industry attention in the past few years. Moreover, by offering better wear resistance and drainage, the granule size becomes ideal for outdoor installation, as per recent observations.
The 0.5 – 1.5 segment is observed to grow at the fastest rate during the forecast period, owing to the increased need for a smoother and refined surface in sports tracks in recent years. Moreover, the increased development of the sport and activity infrastructure in the developing region can create significant opportunities for manufacturers in the coming years.
By Application Insights
Why Did the Playgrounds Segment Dominate the U.S. Colored EPDM Granules Market in 2024?
The playgrounds segment dominated the market with the largest share in 2024 due to widespread safety regulations and increasing focus on child-friendly outdoor spaces. EPDM granules are preferred in playground flooring for their shock-absorbing, non-slip, and weather-resistant properties. Vibrant color options also help in creating fun and engaging environments for kids. Government and school investments in safe play zones have boosted the demand for these surfaces. Since playgrounds require both safety and aesthetic appeal, coloured EPDM granules are the ideal choice. This strong focus on playground safety and durability has made this segment the largest application area to date.
The sports track and field segment is expected to grow at a rapid rate during the forecast period, as more cities, schools, and athletic organizations invest in modernizing sports infrastructure. EPDM granules offer ideal properties for sports surfaces, such as impact resistance, durability, and customizable colors. As athletics and fitness culture grow across the U.S., so does the need for safe, long-lasting running tracks and multisport surfaces. EPDM is a low-maintenance, weather-proof solution ideal for both indoor and outdoor facilities. With rising interest in competitive sports and public fitness initiatives, the demand for coloured granules in sports applications is projected to outpace playground usage.
By End Use Insights
Why is Municipal Infrastructure Dominating the U.S. Colored EPDM Granules Market in 2024?
The municipal infrastructure segment held the largest share of the market in 2024 because cities and local governments are the major investors in public spaces like parks, trails, and playgrounds. These projects require safe, weather-resistant, and low-maintenance materials, which makes coloured EPDM granules a reliable choice. Municipalities prefer these granules for their long life, vibrant colors, and compliance with safety standards. Large-scale urban development and renovation of old recreational areas have driven this segments dominance. Public funding and policy support for safe, accessible, and inclusive infrastructure have led local governments to adopt EPDM-based solutions across many applications, especially in outdoor recreational zones.
The schools and educational institutes segment is observed to grow at a notable rate during the forecast period as they increasingly focus on child safety, outdoor learning environments, and enhanced recreational spaces. EPDM granules are ideal for schoolyards, running tracks, and play zones due to their soft texture, slip resistance, and color flexibility. With growing awareness of injury prevention and inclusive design, schools are investing in rubberized surfaces for both safety and engagement. Moreover, many institutions are upgrading older facilities with modern, low-maintenance materials like EPDM. The rise in school infrastructure spending and focus on student well-being will push this segment ahead in the coming years.
Recent Developments
- In May 2025, STEER World’s unveiled its latest product line, the PlastAsia 2025. The newly launched product line includes pigment and rubber innovations called the iSeries, as per the companys claim.(Source: modernplasticscanada.com )
- In April 2024, Gezolan introduces its latest EPDM granule product line called GEZOFLEX. Also, these newly launched EPDM granules have UV stability, as per the report published by the company.(Source: https://gezolan.com)
Top Companies List
- Mondo USA
- Melos GmbH
- Ultimate RB
- Beaulieu Technical Textiles (BTT)
- American Recycling Center Inc.
- REGUPOL America
- PlayCore
- Ecore International
- Rubber Resources
- Rosehill Sports & Play
Segment Covered
By Color
- Black
- Red
- Blue
- Green
- Beige
- Multicolor (custom blends)
- Others (Yellow, Grey, etc.)
By Size (Granule Size Fraction)
- 0.5–1.5 mm
- 1.0–3.0 mm
- 1.0–4.0 mm
- 3.0–6.0 mm
- Others
By Application
- Playgrounds
- Sports Tracks & Fields
- Walkways & Pathways
- Indoor Flooring
- Commercial Landscaping
- Others (Safety Surfacing, Pool Decks, etc.)
By End-Use Sector
- Municipal/Urban Infrastructure
- Schools & Educational Institutions
- Commercial Facilities
- Residential Complexes
- Recreational Centers
- Others
A Seven-Phase Framework
Our methodology is designed to be universally applicable across commodity chemicals, specialty chemicals, petrochemicals, construction chemicals, coatings, electronic chemicals, industrial gases, agrochemicals, water treatment chemicals, and performance materials. Each phase builds upon the last, creating a layered validation structure that minimizes estimation error and maximizes analytical confidence.
The framework ensures comprehensive market coverage, robust cross-validation, and reliable long-term forecasting — producing market estimates that withstand scrutiny from investors, regulators, and corporate strategy teams.

Seven-Phase Framework — Analytical Effort Distribution
Relative analytical effort allocated across each phase of the Chemicals & Materials research framework

Phase 1 - Secondary Research: Establishing the Foundation
Secondary research collects and evaluates publicly available information from authoritative sources, establishing the foundational understanding of market structure, value chain dynamics, competitive landscape, and end-use demand patterns. Every source is evaluated for credibility, recency, geographic relevance, and methodological soundness before inclusion.
Industry Associations
Sources include ACC, CEFIC, ICCA, JCIA, CPCIF, and SOCMA providing production volumes, consumption trends, capacity developments, and sustainability initiatives.
Company Disclosures
Annual reports, investor presentations, earnings transcripts, and regulatory filings reveal product portfolios, manufacturing footprints, capacity expansions, and revenue segmentation.
Government Databases
National statistical offices, customs authorities, environmental agencies, and industrial production databases provide verified statistics on output, trade flows, and regulatory compliance.
Trade Databases
UN Comtrade, ITC, Eurostat, and national customs authorities enable assessment of global product movement, import dependency, and export competitiveness across regions.
Our Secondary Research Sources
- Ministry of Chemicals and Fertilizers
- European Chemicals Agency
- United States Department of Energy
- Ministry of Industry and Information Technology
- Ministry of Economy Trade and Industry
- Ministry of Trade Industry and Energy
- National Institute of Standards and Technology
- Council of Scientific and Industrial Research
- Fraunhofer Society
- National Institute for Materials Science
Phase 2 — Supply-Side Assessment: Mapping Production Capabilities
Production Capacity Analysis
All major manufacturers are assessed for existing installed capacity, planned additions, expansions, new plant announcements, and technology adoption — mapped at global, regional, and country levels.
Capacity Utilization Adjustment
Installed capacity is adjusted using utilization rates based on demand conditions, feedstock availability, plant operating rates, maintenance schedules, and regulatory restrictions.
Manufacturer Revenue Analysis
Product-specific revenues, segment-level performance, regional distribution, average selling prices, and margin trends are evaluated to establish market value estimates.
Supply-Side Assessment — Capacity vs. Effective Production by Region
Illustrative comparison of installed capacity vs. effective production volume (after utilization rate adjustment) across major regions

Phase 3 — Demand-Side Assessment: Quantifying Chemical Consumption
Demand-side analysis quantifies chemical consumption across industries, applications, and geographies — identifying where and how chemicals are consumed throughout the value chain with precision.
End-Use Industry Analysis
Chemical demand is evaluated across automotive, construction, packaging, electronics, agriculture, healthcare, consumer goods, industrial manufacturing, energy and utilities, and water treatment. Industry output, production trends, and consumption intensity are analyzed to determine demand patterns.
Consumption Modeling
Demand is estimated using measurable indicators: kilograms per vehicle, kilograms per square meter of construction, dosage per cubic meter of water treated, kilograms per hectare of agricultural land, and kilograms per ton of manufactured products. Consumption factors are validated through industry publications and primary interviews.
Application Analysis
The market is segmented by application area to understand product performance requirements, formulation trends, technology adoption, customer preferences, and regulatory requirements improving demand accuracy and segmentation granularity.
Demand-Side Assessment — End-Use Industry Demand Distribution
Illustrative distribution of chemical & materials demand across key end-use industries

Phase 4 - Trade Flow Analysis: Balancing Regional Supply and Demand
Trade flow analysis reconciles regional supply and demand estimates through import and export data, identifying net supply positions, regional dependencies, and market imbalances. It serves as an independent validation layer that tests the consistency of supply-side and demand-side estimates.
Import Analysis
Import data is evaluated to determine volumes, source countries, product dependency, regional supply gaps, and pricing trends — identifying markets that rely heavily on external supply and where domestic production is insufficient to meet demand.
Export Analysis
Export assessments reveal production surplus, export competitiveness, regional manufacturing strength, and global market participation. Export patterns also help validate domestic production estimates and identify net exporting regions.
Apparent Consumption Model
Regional consumption is assessed using the standard apparent consumption formula:
Results identify net importing regions, net exporting regions, regional deficits, and surpluses — serving as an independent validation of supply and demand estimates.
Trade Flow Analysis — Net Supply Position by Region
Illustrative apparent consumption vs. domestic production across major regions — positive gap indicates net import dependency

Phase 5 — Primary Research: The Critical Validation Layer
Primary research tests and refines findings from secondary research through direct engagement with industry participants across the supply chain, demand side, and expert community. It captures intelligence that no database or published report can provide — the real-world experience of manufacturers, buyers, and specialists operating in the market.

Supply-Side Interviews
Conversations with chemical manufacturers, raw material suppliers, contract manufacturers, technology providers, and plant operators cover production trends, capacity utilization, pricing developments, technology shifts, and competitive dynamics.

Demand-Side Interviews
Engagement with OEMs, industrial consumers, procurement managers, distributors, formulators, and end-use manufacturers focuses on consumption trends, purchasing behavior, product substitution, demand outlook, and emerging applications.

Industry Expert Consultations
Additional interviews with industry consultants, independent experts, regulatory specialists, technical professionals, and research institutions provide deeper market context and validate key analytical assumptions.
Focus Areas of Primary Research:
Market Size & Forecast Validation
Revenue estimates, volume consumption, growth rates, forecast assumptions, regional demand.Supply Chain & Value Chain Assessment
Raw material sourcing, supply chain challenges, distribution networks, procurement practices.Production & Capacity Analysis
Manufacturing capacity, utilization rates, expansion projects, plant investments.Pricing & Cost Structure Analysis
Product pricing trends, feedstock costs, energy costs, margin pressures, pricing outlook.Competitive Landscape Assessment
Volume and value estimates confirmed to be fully consistent with one another before publicationInterview Volume by Market Scope
| Study Scope | Number of Interviews |
|---|---|
| Niche Market | 20 – 30 |
| Mid-Sized Market | 30 – 50 |
| Global Market | 50 – 80 |
| Highly Fragmented Market | 80 – 120 |
Interview Details:
Category : Manufacturers, Suppliers, Distributors, End Users, Experts/Associations
Average Duration : 30–60 Minutes
Interview Mode : Video calls, telephonic interviews, expert consultations
Interview Format : Structured / Semi-Structured questionnaire
Focus Areas of Primary Research:
Market Size & Forecast Validation :
Revenue estimates, volume consumption, growth rates, forecast assumptions, regional demand.
Supply Chain & Value Chain Assessment :
Raw material sourcing, supply chain challenges, distribution networks, procurement practices.
Production & Capacity Analysis :
Manufacturing capacity, utilization rates, expansion projects, plant investments.
Pricing & Cost Structure Analysis :
Product pricing trends, feedstock costs, energy costs, margin pressures, pricing outlook.
Competitive Landscape Assessment :
Market share, competitor positioning, strategic initiatives, partnerships, acquisitions.
Primary Research — Stakeholder Coverage by Category
Distribution of interview respondents across stakeholder categories (% share from PPT data)

Primary Research — Respondent Designation Profile
Seniority breakdown of interview respondents (% share from PPT data)

Primary Research — Geographic Coverage of Interviews
Regional distribution of primary research engagement (% share from PPT data)

Phase 6 — Data Triangulation and Market Validation
No single methodology is relied upon in isolation. Multiple independent estimation approaches are combined and reconciled to ensure consistency, accuracy, and analytical defensibility. Any material deviations between approaches are investigated and adjusted through additional validation cycles.
The final market size is derived through weighted triangulation of all validated methodologies. Any material deviations between approaches are investigated and adjusted through additional validation cycles. The outcome represents the most realistic assessment of the market based on available evidence and expert confirmation ensuring that volume and value estimates are fully consistent with one another.
Triangulation Framework — Input Contribution Weight
Relative weight each sizing input contributes to the final reconciled market estimate

Phase 7 — Forecast Modeling: Projecting Future Market Evolution
Forecasting evaluates the future trajectory of the market using a combination of quantitative indicators and qualitative assessments across economic, industry, and regulatory dimensions. Rather than simple extrapolation, each driver is independently modeled and integrated into a composite forecast.
Macroeconomic Indicators
GDP growth, industrial production, manufacturing output, construction activity, consumer spending, and capital investment form the quantitative foundation of long-term demand projections. These are applied at country, regional, and global levels.
Industry Growth Drivers
Urbanization, infrastructure development, industrialization, technological innovation, sustainability initiatives, and evolving product performance requirements are assessed at regional and industry levels — capturing both structural and cyclical demand drivers.
Capacity Expansion Analysis
Announced plant expansions, new manufacturing facilities, technology upgrades, and strategic investments are evaluated to determine future supply-demand dynamics and potential market tightness or oversupply situations.
Regulatory & Sustainability
Environmental regulations, chemical safety standards, emission reduction targets, circular economy initiatives, and sustainability requirements are incorporated as they often influence product adoption rates and market growth trajectories.
Scenario Forecast Range — Indexed Market Growth (Year 1–10)
Illustrative indexed growth trajectories across Base, Optimistic, and Pessimistic scenarios over a 10-year forecast horizon

Forecast Drivers — Relative Impact Score by Category
Impact score (0–100) of each driver type on chemicals & materials market forecast




Comments
Share your thoughts, ask a question, or provide feedback about this report.