
Tertiary Water & Wastewater Treatment Equipment Market Size Analysis Report 2035
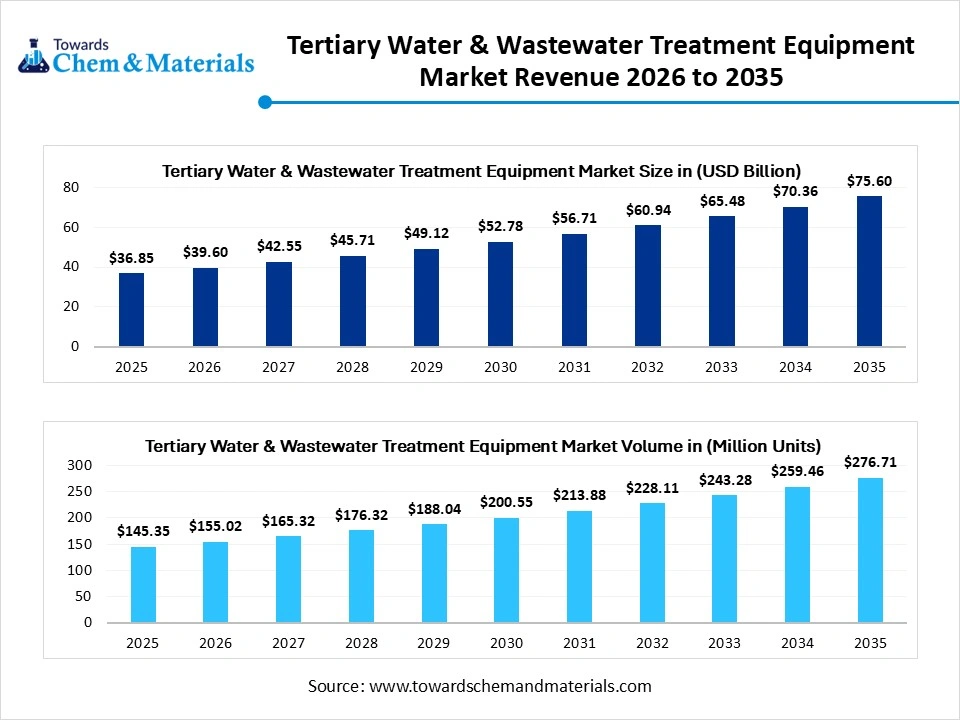
The global tertiary water & wastewater treatment equipment market was valued at USD 36.85 billion in 2025, is estimated to reach USD 39.6 billion in 2026, and is projected to reach USD 75.6 billion by 2035, growing at a CAGR of 7.45% from 2026 to 2035. In terms of volume, the tertiary water & wastewater treatment equipment market is projected to grow from 145.35 million tons in 2025 to 276.71 million tons by 2035. growing at a CAGR of 6.6% from 2026 to 2035.
Key Takeaways
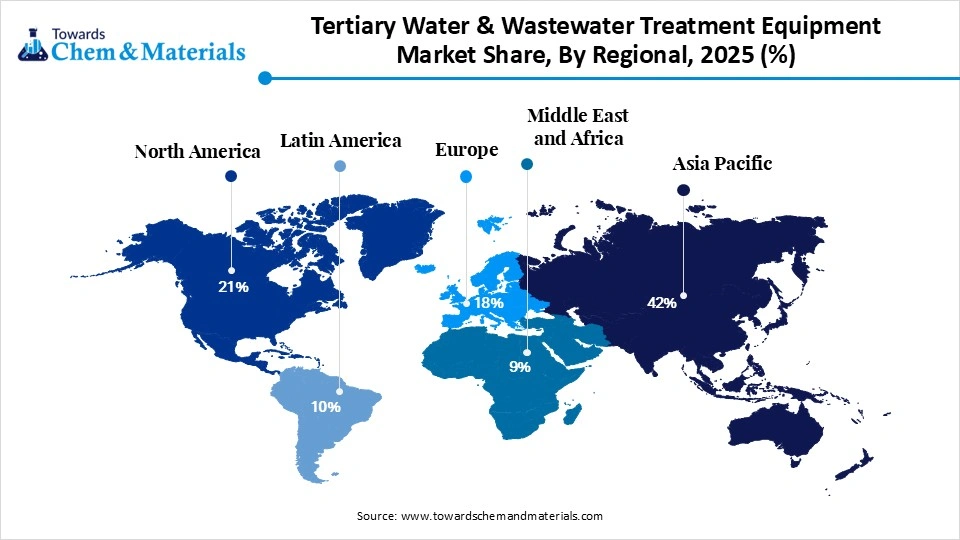
- By region, Asia Pacific dominated the tertiary water & wastewater treatment equipment market in 2025, with 42% share, and is expected to be the fastest-growing in the market, with a CAGR of 8.0% in the forecast period.
- By region, North America is notably growing with 21% market share in 2025.By equipment type, the filtration systems segment dominated the market with 38% share in 2025 and is expected to be the fastest-growing in the market, with a CAGR of 7.8% in the forecast period.
- By technology, the membrane-based treatment segment held 41% share in 2025 and is expected to be the fastest-growing in the market, with a CAGR of 8.1% in the forecast period.
- By application, the municipal water treatment segment dominated the market with 46% share in 2025.
- By application, the industrial wastewater treatment segment held 34% share in 2025 and is expected to be the fastest-growing in the market, with a CAGR of 7.6% in the forecast period.
- By end-use industry, the municipal segment dominated the market with 48% share in 2025.
- By end-use industry, the industrial segment held 32% share in 2025 and is expected to be the fastest-growing in the market, with a CAGR of 7.7% in the forecast period.
- By system type, the fixed systems segment dominated the market with 54% share in 2025.
- By system type, the modular system segment held 31% share in 2025 and is expected to be the fastest-growing in the market, with a CAGR of 8.2% in the forecast period.
High End Water Treatment Systems Growing
The advanced systems, which include advanced systems primarily used in the final stage of water cleaning is known as the tertiary wastewater and wastewater treatment equipment. Also, with the advancements in water cleaning technologies, the developed regions have been seen creating lucrative opportunities for manufacturers in the current period.
Recent Market Trends
- The demand for ultra-clean water has contributed to the stronger cash flows for manufacturing enterprises in recent years. Also, the increased expectations for the production of water, which is almost equal to the worlds fresh water, have elevated the earning potential for producers in the past few years.
- The shift towards flexible treatment systems has translated into favorable financial prospects for producers in the current period. Also, the plants are designed to adapt to changing water qualities and seasonal variations as per the survey.
- The integration of artificial intelligence and robotics is seen as a high-margin opportunity for manufacturers in the coming years. Also, these advanced systems are seen as working more efficiently than manual labor nowadays.
From Isolated Steps to Smart Flow
The industry is actively shifting towards the isolated processes to connected treatment flows. Also, earlier, each step, like filtration or disinfection, worked separately, with limited coordination. Now, systems are designed so each stage supports the next, creating a smooth and optimized process. This improves overall performance and reduces waste in the coming years.
Supply Chain Analysis of the Tertiary Water & Wastewater Treatment Equipment Market
Distribution to Industrial Users
- Industrial distribution of tertiary treatment equipment is concentrated in water-intensive sectors like oil and gas, pharmaceuticals, food and beverage, and power generation.
- These users adopt advanced filtration and disinfection to meet strict discharge regulations and enable water reuse, essential for operational efficiency and sustainability.
Chemical Synthesis and Processing
- In chemical synthesis and processing, tertiary treatment equipment is vital for refining effluent to ultra-pure standards. Systems like advanced oxidation and ion exchange neutralize complex synthetic compounds and residual toxins.
- This ensures high-quality water recovery, allowing facilities to maintain precise chemical reactions while adhering to stringent environmental safety protocols.
Regulatory Compliance and Safety Monitoring
- Strict regulatory frameworks mandate that tertiary treatment systems achieve precise decontamination levels before discharge or reuse. Integrated safety monitoring tools, such as real-time sensors and automated shut-offs, ensure continuous compliance with environmental standards.
- These technologies mitigate risks by detecting pollutant spikes, protecting local ecosystems, and ensuring facility legal adherence.
Tertiary Water & Wastewater Treatment Equipment Market Regulatory Landscape: Regulations
| Country Region | Regulatory Body | Key Regulations | Focus Areas |
| United States | Environmental Protection Agency (EPA), | Clean Water Act (CWA) Section 402: Establishes the National Pollutant Discharge Elimination System (NPDES), which issues permits to all wastewater treatment facilities. These permits often mandate tertiary processes for discharges into "impaired waters". | Removal of PFAS (updated in 2024), nutrient reduction (nitrogen and phosphorus), and protection of sensitive aquatic environments |
| Europe | European Commission - Environment | Revised Urban Wastewater Treatment Directive (UWWTD): Entered into force January 1, 2025. It mandates tertiary treatment (nutrient removal) for plants with a capacity of 150,000 p.e. (population equivalents) by 2039. | Nutrient removal to stop eutrophication, micropollutant removal (pharmaceuticals and cosmetics), and achieving energy neutrality in treatment plants by 2045. |
| China | Ministry of Ecology and Environment (MEE) | GB 18918-2002: The "Discharge Standard of Pollutants for Municipal Wastewater Treatment Plants." It defines the Grade 1-A standard, which often requires tertiary treatment (filtration and disinfection). | Effluent reuse for landscaping and irrigation in water-scarce megacities, and industrial water recovery in manufacturing zones along major rivers like the Yangtze. |
Market Dynamics
Drivers
Reuse Pressure Reshaping the Water Industry
The rising pressure to reuse water instead of wasting it has driven the industrys growth in recent years. Also, water is no longer easily available, especially in growing cities and industrial zones. Governments, industries, and even real estate developers are being forced to treat water to higher levels and reuse it.
Restraints
Expensive Systems Limit Wide Market Adoption
The high cost and complexity of advanced treatment systems are likely to create growth barriers in the market. Many small industries and local authorities struggle to invest in tertiary treatment because it requires skilled operation, regular maintenance, and a high upfront cost.
Opportunity
From Treatment Cost to Profit Opportunity
Turning wastewater treatment into a profit-generating activity is likely to create sophisticated opportunities for manufacturers during the forecast period. Also, instead of just treating water, companies can recover valuable resources like reusable water, energy, and nutrients.
Segmental Insights
Equipment Type Insights
The filtration systems segment dominated the market with 38% share in 2025 and is expected to be the fastest-growing in the market, with a CAGR of 7.8% in the forecast period, owing to they are the most reliable and widely understood method of removing physical impurities. They act as the backbone of almost every treatment plant, whether simple or advanced. Without proper filtration, other processes cannot work effectively.
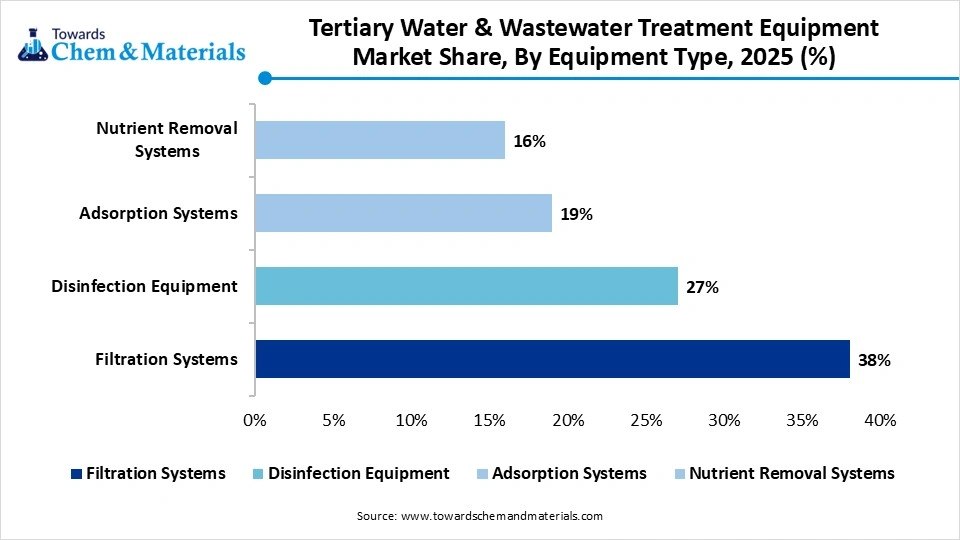
The disinfection equipment segment held 27% market share in 2025, as the focus is shifting toward eliminating invisible biological risks. Earlier, removing visible impurities was enough, but now bacteria, viruses, and pathogens are a major concern. Public health awareness has increased, especially after global health events.
The adsorption systems segment held the 19% market share in 2025 due to they can remove contaminants that other methods struggle with. These include chemicals, odors, colors, and micro-pollutants. As water pollution becomes more complex, traditional systems are not enough. Adsorption provides an extra layer of purification.
Technology Insights
The membrane-based treatment segment dominated the market with 41% share in 2025 and is expected to be the fastest-growing in the market, with a CAGR of 8.1% in the forecast period, owing to it offers high precision and consistent output quality. It can remove extremely small particles, making it suitable for reuse applications. Industries prefer membranes because they reduce uncertainty and provide predictable results.
The chemical treatment segment held the 26% market share in 2025, owing to its effectiveness in handling sudden changes in water quality. Unlike some systems that require stable conditions, chemical processes can quickly adjust to different contaminants. This makes them useful in industries where wastewater composition changes frequently.
The biological treatment segment held the 21% market share in 2025 due to its being seen as a more natural and sustainable approach. It uses microorganisms to break down organic waste, reducing the need for chemicals. This makes it environmentally friendly and cost-efficient in the long run.
Application Insights
The municipal water treatment segment dominated the market with 46% share in 2025, owing to cities generating the largest volume of wastewater. Urban populations are growing rapidly, increasing the demand for large-scale treatment systems. Governments also prioritize public health and sanitation, which leads to continuous investment in municipal infrastructure.
The industrial wastewater treatment segment held 34% industry share in 2025 and is expected to be the fastest-growing in the market, with a CAGR of 7.6% in the forecast period, as industries are under increasing pressure to manage their own water. Regulations are becoming stricter, and companies are being held responsible for their discharge. At the same time, industries want to reduce water costs by recycling internally.
The water rescue and recycling segment held the 20% market share in 2025 because it directly solves the problem of water shortage. Instead of finding new water sources, treated water is reused multiple times. This reduces dependency on natural resources. Industries, agriculture, and even residential sectors are adopting reuse systems.
End-Use Industry Insights
The municipal segment dominated the market with 48% share in 2025 because governments are responsible for managing public water systems. They invest heavily in infrastructure to ensure a safe water supply and wastewater treatment. This creates steady demand for equipment and services.
The industrial segment held the 32% market share in 2025 and is expected to be the fastest-growing in the market, with a CAGR of 7.7% in the forecast period, owing to companies shifting toward self-sufficiency. Instead of depending on municipal systems, industries are building their own treatment and recycling units. This is driven by cost, regulation, and sustainability goals.
The commercial segment held the 12% market share in 2025, as increasing awareness and regulatory pressure on buildings like malls, hotels, and offices. These spaces consume large amounts of water and generate wastewater daily. Installing treatment systems helps reduce costs and improve the sustainability image.
System Type Insights
The fixed systems segment dominated the market with 54% share in 2025 because they are designed for long-term, large-scale operations. They offer stability, high capacity, and consistent performance. Municipal plants and large industries prefer fixed systems because they can handle continuous flow without interruption.
The modular systems segment held the 31% market share in 2025 and is expected to be the fastest-growing in the market, with a CAGR of 8.2% in the forecast period, owing to they offer flexibility and scalability. Users can start small and expand as needed. This reduces initial investment and risk. Modular systems are also faster to install and easier to upgrade.
The portable systems segment held the 15% market share in 2025, as they provide quick and temporary solutions. They are useful in emergencies, remote locations, and construction sites. These systems are easy to transport and install. Also, their use in pilot testing before permanent installation is driving growth.
Regional Insights
How will Asia Pacific Dominate the Tertiary Water & Wastewater Treatment Equipment Market in 2025?
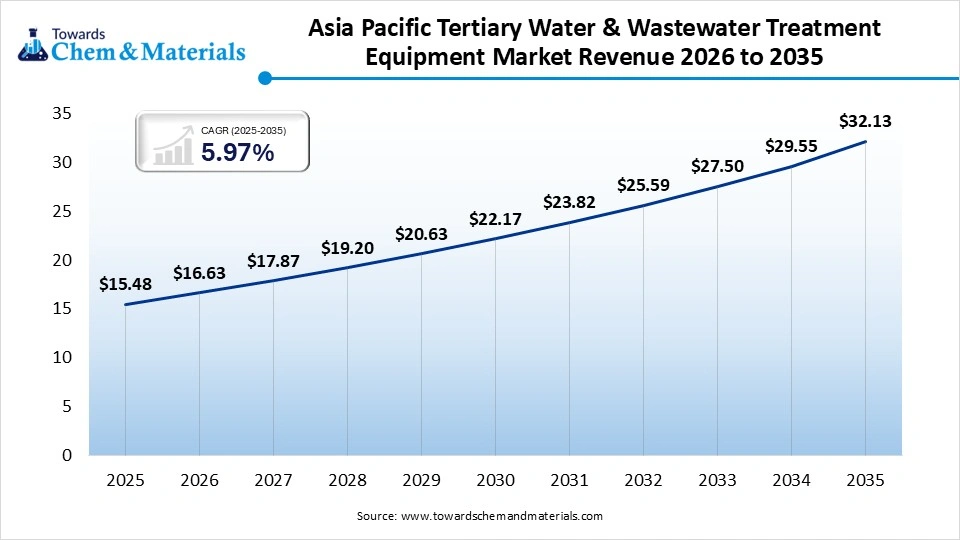
The Asia Pacific tertiary water & wastewater treatment equipment market size was estimated at USD 15.48 billion in 2025 and is projected to reach USD 32.13 billion by 2035, growing at a CAGR of 5.97% from 2026 to 2035 Countries in this region are facing serious water challenges due to population increase and pollution. Governments are investing heavily in water infrastructure. Also, the awareness about water reuse. Moreover, the region dominates because demand is extremely high and growing fast, making it the largest market for water treatment solutions.
Strong Policies Power China Market Dominance
China maintained its dominance in the market, owing to its large industrial base and strict environmental policies. The government is actively promoting wastewater treatment and reuse. Many industries are required to install advanced systems. Furthermore, the urban expansion, which increases municipal demand in the country.
Tertiary Water & Wastewater Treatment Equipment Market Evaluation in North America
North America is growing notably with 21% market share in 2025, owing to technological advancement and focus on water reuse. The region is investing in upgrading old infrastructure with modern systems. Also, innovation in treatment technologies is leading industry growth. Moreover, the future dominance comes from strong technology adoption and continuous improvement of existing systems.
 Strong R&D Drives United States Market Growth
The United States is expected to emerge as a prominent country for the tertiary water & wastewater treatment equipment market in the coming years, due to its advanced infrastructure and strict regulations. Also, many plants are being upgraded to handle new contaminants. Water reuse is also becoming more common. Moreover, the strong research and development.
Recent Development
- In January 2026, Sulzer established its latest global water treatment Centre of Excellence. Also, the newly introduced centre is a global platform that includes deep process knowledge, state-of-the-art engineering, and updated technologies, as per the companys claim.
Tertiary Water & Wastewater Treatment Equipment Market Competitive Landscape Analysis
Tier 1 Companies
|
Rank
|
Company Name | Headquarters | Country | Why Relevant to This Market | Key Products / Material Portfolio |
| 1 | Veolia Environnement S.A. | Paris, Île-de-France | France | Global leader in municipal and industrial water treatment with extensive tertiary treatment technologies | Membrane systems, RO, UF, UV disinfection, water reuse solutions |
| 2 | Xylem Inc. | Washington, D.C. | United States | Major supplier of advanced wastewater treatment and filtration equipment worldwide | UV systems, filtration equipment, biological treatment solutions |
| 3 | SUEZ S.A. | Paris, Île-de-France | France | Leading provider of advanced water purification and reuse technologies | ZeeWeed™ membranes, tertiary filtration, desalination systems |
| 4 | Evoqua Water Technologies LLC | Pittsburgh, Pennsylvania | United States | Strong presence in industrial and municipal tertiary treatment systems | UV disinfection, filtration, RO systems, ion exchange technologies |
| 5 | DuPont Water Solutions | Wilmington, Delaware | United States | Global leader in membrane-based water treatment technologies | FilmTec™ RO membranes, ultrafiltration membranes, ion exchange resins |
Tier 2 Companies
|
Rank
|
Company Name | Headquarters | Country | Why Relevant to This Market | Key Products / Material Portfolio |
| 1 | Pentair plc | London, England | United Kingdom | Major supplier of filtration and advanced water treatment systems | Filtration systems, membrane technologies, treatment equipment |
| 2 | Kurita Water Industries Ltd. | Tokyo | Japan | Leading provider of industrial water and wastewater treatment technologies | Advanced filtration, water reuse systems, treatment chemicals |
| 3 | Toray Industries, Inc. | Tokyo | Japan | Major producer of membrane technologies for tertiary treatment and desalination | RO membranes, UF membranes, water purification systems |
| 4 | Hitachi, Ltd. | Tokyo | Japan | Significant supplier of municipal and industrial water treatment infrastructure | Membrane bioreactors, filtration systems, wastewater treatment equipment |
| 5 | Aquatech International LLC | Canonsburg, Pennsylvania | United States | Specialized provider of industrial water reuse and zero liquid discharge solutions | RO systems, ZLD systems, tertiary treatment technologies |
Tier 2 Companies
|
Rank
|
Company Name | Headquarters | Country | Why Relevant to This Market | Key Products / Material Portfolio |
| 1 | Ovivo Inc. | Montreal, Quebec | Canada | Provider of advanced filtration and water purification solutions | Membrane filtration, UV systems, wastewater treatment equipment |
| 2 | Parkson Corporation | Fort Lauderdale, Florida | United States | Strong focus on tertiary filtration and nutrient removal systems | Filtration equipment, tertiary treatment systems, clarifiers |
| 3 | Calgon Carbon Corporation | Moon Township, Pennsylvania | United States | Leading supplier of activated carbon solutions for tertiary treatment | Activated carbon filtration, adsorption systems, purification equipment |
| 4 | Bio-Microbics, Inc. | Shawnee, Kansas | United States | Specialized provider of decentralized and advanced wastewater treatment systems | Tertiary filtration systems, nutrient removal technologies |
Top Vendors in the Tertiary Water & Wastewater Treatment Equipment Market & Their Offerings:
- Xylem Inc.: Xylem is a global leader in water technology, specializing in the "Smart Water" segment. They provide advanced tertiary solutions, including UV disinfection, ozone treatments, and membrane filtration through brands like Wedeco and Leopold. Their focus centers on optimizing the water cycle through digital integration and energy-efficient equipment for resource recovery.
- Veolia Environnement S.A.: A French powerhouse, Veolia provides comprehensive water, waste, and energy management. In the tertiary market, they offer cutting-edge technologies like Actiflo for high-speed clarification and Hydrotech discfilters. Veolia leads in large-scale desalination and wastewater recycling projects, emphasizing circular economy practices to transform waste into valuable secondary raw materials.
- Suez S.A.: Suez focuses on innovative circular solutions for water and waste management across five continents. Their tertiary expertise includes advanced ultrafiltration membranes and specialized chemical treatments designed to remove persistent micropollutants. Following its acquisition by a consortium of investors, Suez has reinforced its commitment to sustainable infrastructure and industrial water reuse.
- DuPont Water Solutions
- Evoqua Water Technologies
- Pentair plc
- Ecolab Inc.
- Kemira Oyj
- Danaher Corporation
- 3M Company
Tertiary Water & Wastewater Treatment Equipment Market Segments List
By Equipment Type
- Filtration Systems
- Sand Filters
- Membrane Filtration
- Ultrafiltration (UF)
- Nanofiltration (NF)
- Reverse Osmosis (RO)
- Disinfection Equipment
- UV Disinfection
- Chlorination Systems
- Ozonation Systems
- Adsorption Systems
- Activated Carbon Filters
- Ion Exchange Systems
- Nutrient Removal Systems
- Biological Nutrient Removal (BNR)
- Chemical Precipitation Systems
By Technology
- Membrane-based Treatment
- RO Systems
- UF Systems
- NF Systems
- Chemical Treatment
- Coagulation & Flocculation
- Oxidation Processes
- Biological Treatment
- Aerobic Systems
- Anaerobic Systems
- Advanced Oxidation Processes (AOPs)
By Application
- Municipal Water Treatment
- Drinking Water Plants
- Sewage Treatment Plants
- Industrial Wastewater Treatment
- Power Generation
- Oil & Gas
- Chemicals
- Food & Beverage
- Water Reuse & Recycling
- Industrial Reuse
- Urban Reuse
By End-Use Industry
- Municipal
- Industrial
- Commercial
- Residential
By System Type
- Fixed Systems
- Modular Systems
- Portable Systems
By Regions
- North America
- U.S.
- Canada
- Mexico
- U.S.
- Europe
- Germany
- UK
- France
- Italy
- Spain
- Germany
- Asia Pacific
- China
- India
- Japan
- South Korea
- China
- Latin America
- Brazil
- Argentina
- Brazil
- Middle East & Africa
- Saudi Arabia
- South Africa
- Saudi Arabia
A Seven-Phase Framework
Our methodology is designed to be universally applicable across commodity chemicals, specialty chemicals, petrochemicals, construction chemicals, coatings, electronic chemicals, industrial gases, agrochemicals, water treatment chemicals, and performance materials. Each phase builds upon the last, creating a layered validation structure that minimizes estimation error and maximizes analytical confidence.
The framework ensures comprehensive market coverage, robust cross-validation, and reliable long-term forecasting — producing market estimates that withstand scrutiny from investors, regulators, and corporate strategy teams.

Seven-Phase Framework — Analytical Effort Distribution
Relative analytical effort allocated across each phase of the Chemicals & Materials research framework

Phase 1 - Secondary Research: Establishing the Foundation
Secondary research collects and evaluates publicly available information from authoritative sources, establishing the foundational understanding of market structure, value chain dynamics, competitive landscape, and end-use demand patterns. Every source is evaluated for credibility, recency, geographic relevance, and methodological soundness before inclusion.
Industry Associations
Sources include ACC, CEFIC, ICCA, JCIA, CPCIF, and SOCMA providing production volumes, consumption trends, capacity developments, and sustainability initiatives.
Company Disclosures
Annual reports, investor presentations, earnings transcripts, and regulatory filings reveal product portfolios, manufacturing footprints, capacity expansions, and revenue segmentation.
Government Databases
National statistical offices, customs authorities, environmental agencies, and industrial production databases provide verified statistics on output, trade flows, and regulatory compliance.
Trade Databases
UN Comtrade, ITC, Eurostat, and national customs authorities enable assessment of global product movement, import dependency, and export competitiveness across regions.
Our Secondary Research Sources
- Ministry of Chemicals and Fertilizers
- European Chemicals Agency
- United States Department of Energy
- Ministry of Industry and Information Technology
- Ministry of Economy Trade and Industry
- Ministry of Trade Industry and Energy
- National Institute of Standards and Technology
- Council of Scientific and Industrial Research
- Fraunhofer Society
- National Institute for Materials Science
Phase 2 — Supply-Side Assessment: Mapping Production Capabilities
Production Capacity Analysis
All major manufacturers are assessed for existing installed capacity, planned additions, expansions, new plant announcements, and technology adoption — mapped at global, regional, and country levels.
Capacity Utilization Adjustment
Installed capacity is adjusted using utilization rates based on demand conditions, feedstock availability, plant operating rates, maintenance schedules, and regulatory restrictions.
Manufacturer Revenue Analysis
Product-specific revenues, segment-level performance, regional distribution, average selling prices, and margin trends are evaluated to establish market value estimates.
Supply-Side Assessment — Capacity vs. Effective Production by Region
Illustrative comparison of installed capacity vs. effective production volume (after utilization rate adjustment) across major regions

Phase 3 — Demand-Side Assessment: Quantifying Chemical Consumption
Demand-side analysis quantifies chemical consumption across industries, applications, and geographies — identifying where and how chemicals are consumed throughout the value chain with precision.
End-Use Industry Analysis
Chemical demand is evaluated across automotive, construction, packaging, electronics, agriculture, healthcare, consumer goods, industrial manufacturing, energy and utilities, and water treatment. Industry output, production trends, and consumption intensity are analyzed to determine demand patterns.
Consumption Modeling
Demand is estimated using measurable indicators: kilograms per vehicle, kilograms per square meter of construction, dosage per cubic meter of water treated, kilograms per hectare of agricultural land, and kilograms per ton of manufactured products. Consumption factors are validated through industry publications and primary interviews.
Application Analysis
The market is segmented by application area to understand product performance requirements, formulation trends, technology adoption, customer preferences, and regulatory requirements improving demand accuracy and segmentation granularity.
Demand-Side Assessment — End-Use Industry Demand Distribution
Illustrative distribution of chemical & materials demand across key end-use industries

Phase 4 - Trade Flow Analysis: Balancing Regional Supply and Demand
Trade flow analysis reconciles regional supply and demand estimates through import and export data, identifying net supply positions, regional dependencies, and market imbalances. It serves as an independent validation layer that tests the consistency of supply-side and demand-side estimates.
Import Analysis
Import data is evaluated to determine volumes, source countries, product dependency, regional supply gaps, and pricing trends — identifying markets that rely heavily on external supply and where domestic production is insufficient to meet demand.
Export Analysis
Export assessments reveal production surplus, export competitiveness, regional manufacturing strength, and global market participation. Export patterns also help validate domestic production estimates and identify net exporting regions.
Apparent Consumption Model
Regional consumption is assessed using the standard apparent consumption formula:
Results identify net importing regions, net exporting regions, regional deficits, and surpluses — serving as an independent validation of supply and demand estimates.
Trade Flow Analysis — Net Supply Position by Region
Illustrative apparent consumption vs. domestic production across major regions — positive gap indicates net import dependency

Phase 5 — Primary Research: The Critical Validation Layer
Primary research tests and refines findings from secondary research through direct engagement with industry participants across the supply chain, demand side, and expert community. It captures intelligence that no database or published report can provide — the real-world experience of manufacturers, buyers, and specialists operating in the market.

Supply-Side Interviews
Conversations with chemical manufacturers, raw material suppliers, contract manufacturers, technology providers, and plant operators cover production trends, capacity utilization, pricing developments, technology shifts, and competitive dynamics.

Demand-Side Interviews
Engagement with OEMs, industrial consumers, procurement managers, distributors, formulators, and end-use manufacturers focuses on consumption trends, purchasing behavior, product substitution, demand outlook, and emerging applications.

Industry Expert Consultations
Additional interviews with industry consultants, independent experts, regulatory specialists, technical professionals, and research institutions provide deeper market context and validate key analytical assumptions.
Focus Areas of Primary Research:
Market Size & Forecast Validation
Revenue estimates, volume consumption, growth rates, forecast assumptions, regional demand.Supply Chain & Value Chain Assessment
Raw material sourcing, supply chain challenges, distribution networks, procurement practices.Production & Capacity Analysis
Manufacturing capacity, utilization rates, expansion projects, plant investments.Pricing & Cost Structure Analysis
Product pricing trends, feedstock costs, energy costs, margin pressures, pricing outlook.Competitive Landscape Assessment
Volume and value estimates confirmed to be fully consistent with one another before publicationInterview Volume by Market Scope
| Study Scope | Number of Interviews |
|---|---|
| Niche Market | 20 – 30 |
| Mid-Sized Market | 30 – 50 |
| Global Market | 50 – 80 |
| Highly Fragmented Market | 80 – 120 |
Interview Details:
Category : Manufacturers, Suppliers, Distributors, End Users, Experts/Associations
Average Duration : 30–60 Minutes
Interview Mode : Video calls, telephonic interviews, expert consultations
Interview Format : Structured / Semi-Structured questionnaire
Focus Areas of Primary Research:
Market Size & Forecast Validation :
Revenue estimates, volume consumption, growth rates, forecast assumptions, regional demand.
Supply Chain & Value Chain Assessment :
Raw material sourcing, supply chain challenges, distribution networks, procurement practices.
Production & Capacity Analysis :
Manufacturing capacity, utilization rates, expansion projects, plant investments.
Pricing & Cost Structure Analysis :
Product pricing trends, feedstock costs, energy costs, margin pressures, pricing outlook.
Competitive Landscape Assessment :
Market share, competitor positioning, strategic initiatives, partnerships, acquisitions.
Primary Research — Stakeholder Coverage by Category
Distribution of interview respondents across stakeholder categories (% share from PPT data)

Primary Research — Respondent Designation Profile
Seniority breakdown of interview respondents (% share from PPT data)

Primary Research — Geographic Coverage of Interviews
Regional distribution of primary research engagement (% share from PPT data)

Phase 6 — Data Triangulation and Market Validation
No single methodology is relied upon in isolation. Multiple independent estimation approaches are combined and reconciled to ensure consistency, accuracy, and analytical defensibility. Any material deviations between approaches are investigated and adjusted through additional validation cycles.
The final market size is derived through weighted triangulation of all validated methodologies. Any material deviations between approaches are investigated and adjusted through additional validation cycles. The outcome represents the most realistic assessment of the market based on available evidence and expert confirmation ensuring that volume and value estimates are fully consistent with one another.
Triangulation Framework — Input Contribution Weight
Relative weight each sizing input contributes to the final reconciled market estimate

Phase 7 — Forecast Modeling: Projecting Future Market Evolution
Forecasting evaluates the future trajectory of the market using a combination of quantitative indicators and qualitative assessments across economic, industry, and regulatory dimensions. Rather than simple extrapolation, each driver is independently modeled and integrated into a composite forecast.
Macroeconomic Indicators
GDP growth, industrial production, manufacturing output, construction activity, consumer spending, and capital investment form the quantitative foundation of long-term demand projections. These are applied at country, regional, and global levels.
Industry Growth Drivers
Urbanization, infrastructure development, industrialization, technological innovation, sustainability initiatives, and evolving product performance requirements are assessed at regional and industry levels — capturing both structural and cyclical demand drivers.
Capacity Expansion Analysis
Announced plant expansions, new manufacturing facilities, technology upgrades, and strategic investments are evaluated to determine future supply-demand dynamics and potential market tightness or oversupply situations.
Regulatory & Sustainability
Environmental regulations, chemical safety standards, emission reduction targets, circular economy initiatives, and sustainability requirements are incorporated as they often influence product adoption rates and market growth trajectories.
Scenario Forecast Range — Indexed Market Growth (Year 1–10)
Illustrative indexed growth trajectories across Base, Optimistic, and Pessimistic scenarios over a 10-year forecast horizon

Forecast Drivers — Relative Impact Score by Category
Impact score (0–100) of each driver type on chemicals & materials market forecast




Comments
Share your thoughts, ask a question, or provide feedback about this report.