
Polybags Market Size and Forecast 2026 to 2035
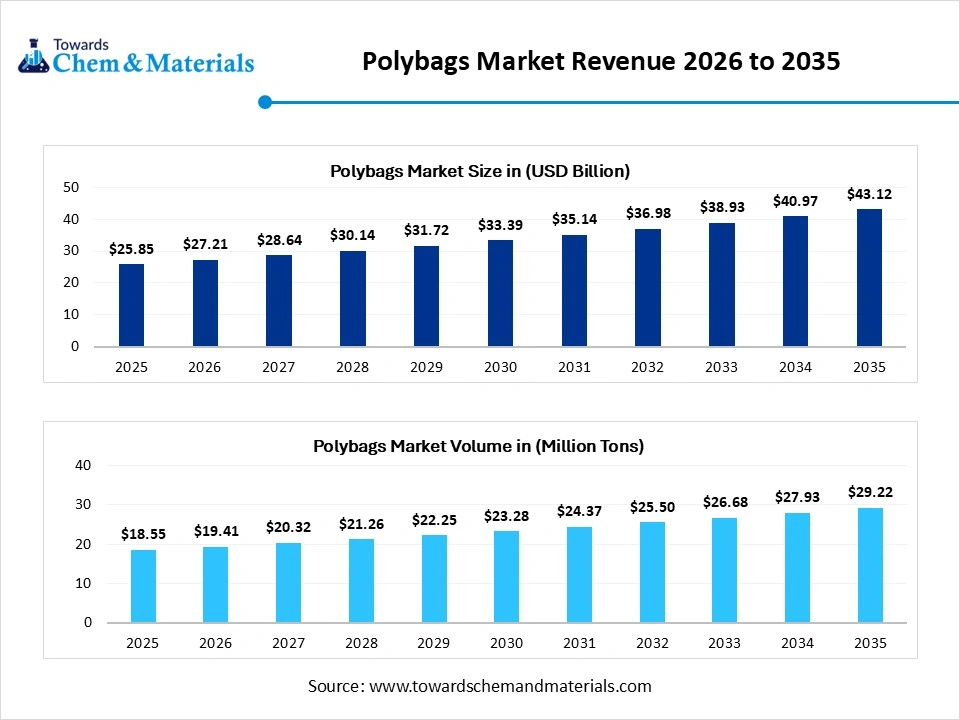
The global polybags market size was estimated at USD 25.85 billion in 2025 and is expected to be worth around USD 43.12 billion by 2035, exhibiting a compound annual growth rate (CAGR) of 5.25% over the forecast period from 2026 to 2035.In terms of volume the polybags market is projected to grow from 18.55 million tons in 2025 to 29.22 million tons by 2035. growing at a CAGR of 4.65% from 2026 to 2035. This report covers detailed market size analysis along with segment-wise data by material type, product type, and end-use industries. It also provides comprehensive regional insights across key markets, along with company profiles, competitive landscape, value chain analysis, trade data, and detailed information on manufacturers and suppliers shaping the industry.
Key Takeaways
- By region, Asia Pacific dominated the market with a share of 46% in 2025 and is expected to sustain its position while growing with a CAGR of 6.4% in the forecast period. Rapid urbanization and increased packaging demand in the region drive growth.
- By region, Europe held the second largest share of 20% in 2025. Strong presence of the retail sector drives the demand and growth of the market.
- By material type, the polyethylene segment dominated the market with 52% share in 2025. Cost-effective production drives the growth of the market.
- By material type, the biodegradable plastics segment held the third largest share of 16% in 2025 and is expected to have the fastest growth with a CAGR of 8.2% in the forecast period. Sustainability regulations drive the growth of the market.
- By product type, the flat polybags segment dominated the market with 26% share in 2025. Cost-effective production drives demand.
- By product type, the ziplock bags segment held the third largest share of 18% in 2025 and is expected to have the fastest growth with a CAGR of 6.8% in the forecast period. Reusability increases consumer preference.
- By end-use industry, the Retail & E-commerce segment dominated the market with 32% share in 2025. Rapid growth in online shopping increases packaging demand.
- By end-use industry, the healthcare segment held the fourth largest share of 10% in 2025 and is expected to have the fastest growth with a CAGR of 6.5% in the forecast period. Rising demand for sterile packaging drives usage.
- By distribution channel, the direct sales (B2B) segment dominated the market with 48% share in 2025. Large-volume contracts drive direct procurement.
- By distribution channel, the online retail segment held the third largest share of 20% in 2025 and is expected to have the fastest growth with a CAGR of 7.2% in the forecast period. Digital platforms increase accessibility for small buyers.
Market Overview
What Is The Significance Of The Polybags Market?
The polybags market is critical for providing durable, lightweight, and cost-effective packaging, primarily driven by the explosion of e-commerce, retail, and industrial shipping. These versatile, customizable solutions enable brand promotion and ensure product protection across diverse sectors, while transitioning towards sustainable materials, such as bio-based and biodegradable options, to meet environmental regulations. Low production costs make them a preferred, budget-friendly packaging choice compared to alternatives.
Polybags Market Growth Trends:
- Sustainability & Eco-Friendly Materials: Rising consumer awareness and regulatory bans on single-use plastics are driving innovation toward biodegradable, compostable, and recyclable materials.
- Smart Packaging: Future polybags are incorporating technology such as RFID tags for tracking and temperature-sensitive features, particularly in food and pharmaceutical logistics.
- Advanced Manufacturing Technologies: Increased use of digital printing for customization and advanced technologies like laser cutting for enhanced sealing and reduced material waste.
Key Technological Shifts In The Polybags Market:
The polybags market is undergoing a significant transformation driven by sustainability mandates, regulatory pressure, and the adoption of Industry 4.0 technologies. Key shifts include the rise of biodegradable/compostable materials, the adoption of mono-material recyclable structures, the integration of smart packaging (RFID/IoT), and the use of AI-driven automation to increase production efficiency and reduce waste. Manufacturers are transitioning from complex multi-layer laminates to mono-material polyethylene (PE) or polypropylene (PP) structures, making bags fully recyclable in existing streams.
Trade Analysis Of Polybags Market: Import & Export Statistics
- According to Global Export Data, the world exported 721,272 Plastic Bag shipments between July 2024 and June 2025 (TTM) via 38,595 exporters and 61,488 buyers, representing a 26% YoY change.
- Vietnam, the United States, and Mexico lead as the top Plastic Bag importers, while Vietnam with 985,032 shipments, China with 460,792, and the United States with 126,528, rank as the largest global Plastic Bag exporters.
Top-Performing Global Plastic Bag Exporters By Volume
- Hung Yen Plastic Joint Stock Company: 23,626 shipments (22%)
- Cedo Vietnam Limited Liability Company: 11,552 shipments (11%)
- AN PHAT BIOPLASTICS JOINT STOCK COMPANY: 11,120 shipments (10%)
Polybags Market - Supply Chain Analysis
Polymer Processing & Bag Manufacturing
Polybags are produced through extrusion of polyethylene or polypropylene resins followed by film blowing, cutting, sealing, and printing for packaging applications.
- Key players: Berry Global, Amcor, Sealed Air, Novolex
Quality Testing and Certification
Polybags must comply with material strength standards, food-contact safety regulations, recyclability guidelines, and environmental compliance requirements.
- Key players: International Organization for Standardization, ASTM International, European Chemicals Agency, and U.S. Food and Drug Administration.
Distribution to Industrial Users
Polybags are supplied to retail packaging companies, e-commerce businesses, food and beverage industries, logistics providers, and consumer goods manufacturers.
- Key players: Berry Global, Amcor, Sealed Air.
Polybags Regulatory Landscape: Global Regulations
| Country / Region | Regulatory Body | Key Regulations | Focus Areas | Notable Notes |
| U.S. | Environmental Protection Agency (EPA); State Environmental Agencies | Resource Conservation and Recovery Act (RCRA); State-level plastic bag bans and taxes | Plastic waste reduction, recycling, and environmental compliance | Several U.S. states have implemented bans or fees on single-use polybags, pushing demand toward recyclable and biodegradable alternatives. |
| Europe | European Commission; European Chemicals Agency (ECHA) | Single-Use Plastics Directive; Packaging and Packaging Waste Directive | Plastic reduction, recycling targets, circular economy | The EU mandates a reduction in lightweight plastic bags and promotes reusable and biodegradable alternatives through strict policies. |
| China | National Development and Reform Commission (NDRC); Ministry of Ecology and Environment (MEE) | Plastic Pollution Control Policy | Plastic bag bans, production restrictions, and environmental protection | China has imposed nationwide restrictions on non-degradable plastic bags, encouraging eco-friendly substitutes. |
| India | Ministry of Environment, Forest and Climate Change (MoEFCC); Central Pollution Control Board (CPCB) | Plastic Waste Management Rules; Single-use plastic ban | Plastic usage restrictions, EPR compliance, and recycling | India has banned several categories of single-use plastic bags and enforces extended producer responsibility for plastic waste management. |
| Japan | Ministry of Economy, Trade and Industry (METI); Ministry of the Environment | Plastic Resource Circulation Act | Plastic reduction, recycling, and sustainable alternatives | Japan imposes charges on plastic bags and promotes recycling and sustainable material use. |
| Brazil | Brazilian Institute of Environment and Renewable Natural Resources (IBAMA); State Governments | National Solid Waste Policy; Local plastic bag regulations | Waste management, plastic reduction | Brazil enforces regional bans and promotes recycling initiatives to reduce polybag usage. |
Segmental Insights
Material Type Insights
The Polyethylene Segment Dominated The Market With 52% Market Share In 2025
The polyethylene segment dominated the market with 52% share in 2025. The growth of the market is driven by the high flexibility and durability, which increases the demand and helps in the widespread adoption of the market. Cost-effectiveness and support for large-scale production further support growth. Strong demand from the retail and packaging sectors boosts the growth of the market.
The recycled plastics segment held the second largest share of 18% in 2025. The circular economy initiatives increase recycled content usage and offer cost advantages, improving adoption rates of recycled plastics, and corporate sustainability goals drive demand in the market. Innovations in recycling technologies have improved the quality, strength, and aesthetics of recycled plastic bags, making them competitive with virgin alternatives for applications like garment packaging, mailers, and retail bags.
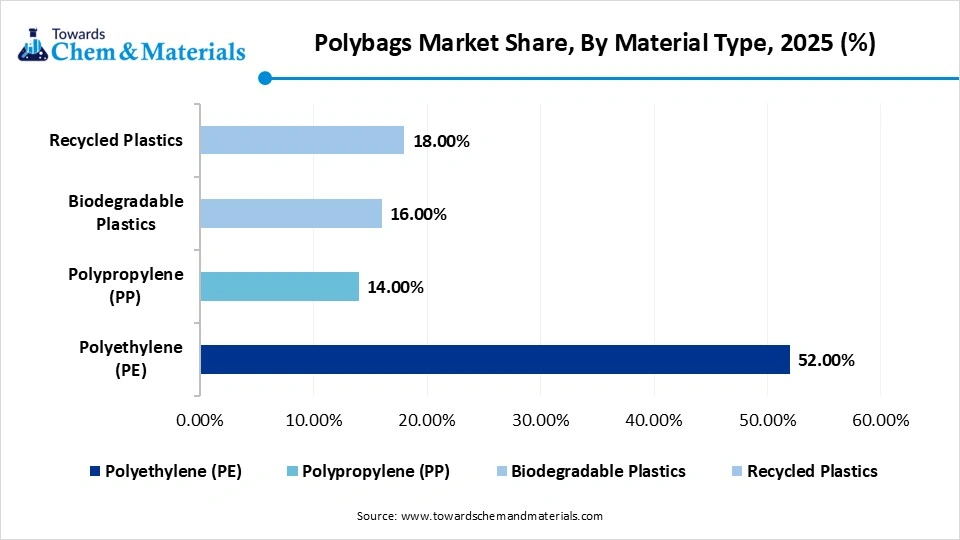
The biodegradable plastics segment held the third largest share of 16% in 2025 and is expected to have the fastest growth with a CAGR of 8.2% in the forecast period. Sustainability regulation increases the adoption of eco-friendly materials and sustainable products due to growing environmental concerns, driving growth. Consumers are also shifting towards green packaging, which further drives growth. A major factor is the government ban on singing; it uses plastics, which support the growth and expansion of the market.
The polypropylene segment held the fourth largest share of 14% in 2025. The higher strength enhances the load-bearing capacity; this property fuels the demand and growth of the market. The increased use of industrial packaging further supports the growth and expansion due to increased demand. Other major factors are the demand for lightweight materials to improve efficiency, which further helps in the growth of the market.
Polybags Market Share, By Material Type, 2025 (%)
| By Material Type | Revenue Share, 2025 (%) |
| Polyethylene (PE) | 52.00% |
| Polypropylene (PP) | 14.00% |
| Biodegradable Plastics | 16.00% |
| Recycled Plastics | 18.00% |
Product Type Insights
The Flat Polybags Segment Dominated The Market With 26% Market Share In 2025
The flat polybags segment dominated the market with 26% share in 2025. The Simple design supports wide applicability in various industries, and cost-effective production also helps in increased production from various industries, which drives demand for the market. High usage of sustainable products in the retail and packaging industries also further drives the growth and expansion of the market.
The gusseted polybags segment held the second largest share of 20% in 2025. The growth of the market is driven by the Expanded storage capacity, which increases usability and increases the demand from the market. The strong demand in bulk packaging applications also increases the production of polybags in the market. Industrial usage supports the growth and expansion of the market.
The ziplock bags segment held the third largest share of 18% in 2025 and is expected to have the fastest growth with a CAGR of 6.8% in the forecast period. The Reusability of the product increases consumer preference and increases demand for the product due to its easy use. The major applications, like Food storage applications, drive demand, increasing production. The ziplock bags' easy use and Convenience features boost adoption by consumers, which fuels the growth of the market.
The garbage bags segment held the fourth largest share of 16% in 2025. Rapid urbanization and increased waste management increase the demand for garbage bags, also due to growing awareness among consumers amid environmental concerns, which fuels the growth of the market. Municipal usage supports further growth, helping in the expansion of the market. Household consumption remains steady, due to increased demand and also due to waste management initiatives, which fuel the growth and expansion of the market.
Polybags Market Share, By Product Type, 2025 (%)
| By Product Type | Revenue Share, 2025 (%) |
| Flat Polybags | 26.00% |
| Gusseted Polybags | 20.00% |
| Ziplock Bags | 18.00% |
| Wicketed Bags | 12.00% |
| Garbage Bags | 16.00% |
| Others | 8.00% |
End-Use Industry Insights
The Retail & E-Commerce Segment Dominated The Market With 32% Market Share In 2025
The retail & e-commerce segment dominated the market with 32% share in 2025. Rapid growth in online shopping increases packaging demand; also, lightweight bags reduce shipping costs, supporting Branding opportunities, which drive adoption. E-commerce surging demand for tamper-evident, water-resistant courier bags, along with rising online grocery and fashion orders, fuels the need for custom, tear-resistant flexible bags.
The food & beverage segment held the second largest share of 26% in 2025. Food packaging demand increases consumption due to the demand for Hygiene and safety requirements, which boost usage. Flexible packaging supports the convenience of use of the product in the industry. The surge in demand for on-the-go meals, convenience foods, and specialized beverage carriers has shifted the industry toward flexible plastic formats.
The industrial segment held the third largest share of 14% in 2025. Bulk packaging supports manufacturing operations along with Durable materials, which improve performance, and growing industrial output drives demand. This growth is driven by the need for durable, cost-effective, and versatile packaging to transport, store, and protect goods in sectors like agriculture, chemicals, and construction.
The healthcare segment held the fourth largest share of 10% in 2025 and is expected to have the fastest growth with a CAGR of 6.5% in the forecast period. Rising demand for sterile packaging drives the usage of polybags and also helps in the medical supply growth, supporting expansion. Regulatory compliance increases adoption. In the healthcare system, this increases the demand. Increased focus on infection control has accelerated the adoption of single-use plastic products.
Polybags Market Share, By End-Use Industry, 2025 (%)
| By End-Use Industry | Revenue Share, 2025 (%) |
| Retail & E-commerce | 32.00% |
| Food & Beverage | 26.00% |
| Healthcare | 10.00% |
| Industrial | 14.00% |
| Agriculture | 10.00% |
| Others | 8.00% |
Distribution Channel Insights
The Direct Sales (B2B) Segment Dominated The Market With 48% Market Share In 2025
The direct sales (b2b) segment dominated the market with 48% share in 2025. by fostering high-volume, long-term partnerships with industrial and retail clients, with direct sales. This segment allows manufacturers to provide customized, cost-effective packaging solutions directly to businesses, such as in food, electronics, and e-commerce, ensuring steady demand, personalized service, and reduced intermediary costs.
The distributors & wholesalers segment held the second largest share of 32% in 2025. Serving as the critical link between manufacturers and the rapidly expanding retail, e-commerce, and food services sectors supports demand. Wholesalers enable manufacturers to reach smaller retailers, local grocery stores, and food outlets that are too numerous for direct sales teams to manage, thereby expanding the overall market footprint.
The online retail segment held the third largest share of 20% in 2025 and is expected to have the fastest growth with a CAGR of 7.2% in the forecast period, by creating high demand for durable, lightweight, and cost-effective protective packaging, which fuels the growth. The exponential rise in online transactions means every shipment replaces traditional consolidated store delivery, requiring individual protective packaging for each item.
Polybags Market Share, By Distribution Channel, 2025 (%)
| By Distribution Channel | Revenue Share, 2025 (%) |
| Direct Sales (B2B) | 48.00% |
| Distributors & Wholesalers | 32.00% |
| Online Retail | 20.00% |
Regional Insights
How did Asia Pacific Dominate the Polybags Market in 2025?
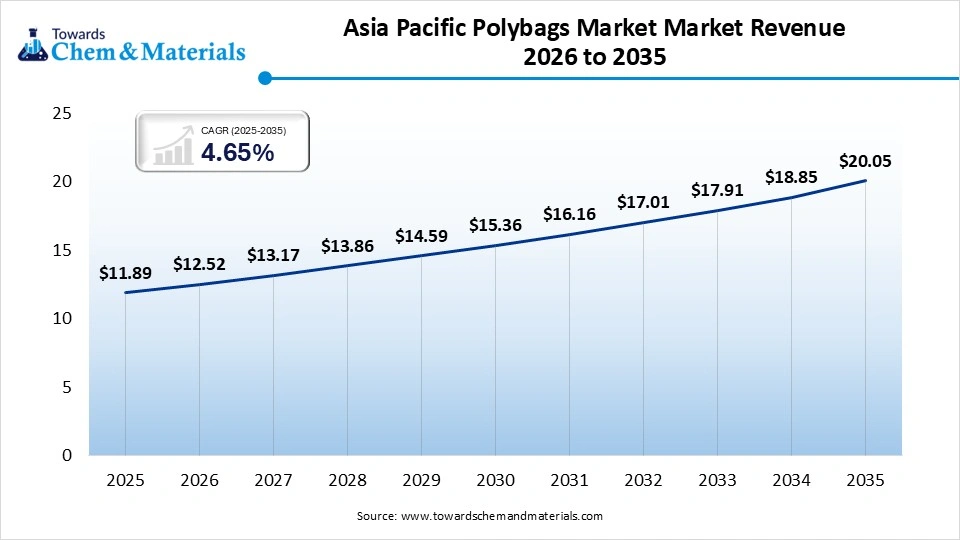
The Asia Pacific Polybags market size was estimated at USD 11.89 billion in 2025 and is projected to reach USD 20.05 billion by 2035, growing at a CAGR of 4.56% from 2026 to 2035. Asia Pacific dominated the market with a share of 46% in 2025 ,Rapid urbanization increases packaging demand, and A strong manufacturing base supports production. Growing e-commerce drives consumption, fueling the growth of the market. Food, beverage, and consumer goods industries maintained a high reliance on flexible plastic packaging for packing, accounting for a high share of the market, particularly with pouches and sachets.
India Polybags Market Growth Factor
The market is experiencing robust growth, projected to expand significantly due to rising demand from the retail, e-commerce, and food packaging sectors. Growth in India's pharmaceutical sector is fueling the need for specialized packaging bags. Innovations in manufacturing have increased the popularity of biodegradable plastics, allowing manufacturers to adapt to stricter environmental regulations. Strict government regulations regarding single-use plastics are driving a transition toward eco-friendly and compostable materials.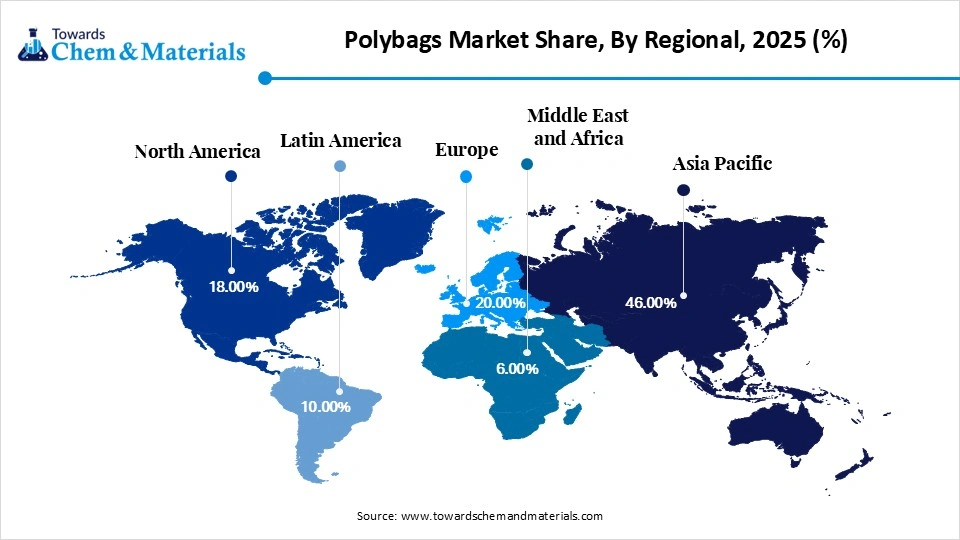
Europe Polybags Market Growth Factor
Europe held the second largest share of 20% in 2025, as sustainability regulations drive biodegradable adoption. The strong retail sector supports demand, and recycling initiatives boost the growth of the market, fueling demand. Shifting consumer lifestyles have spurred demand for frozen food, increasing the need for specialized flexible pouch packaging. While plastic is under scrutiny, there is intense investment in and demand for "eco-enhanced" plastics, recyclable mono-materials, and bio-based plastics.
Germany Polybags Market Growth Factor
The polybags market in Germany is experiencing steady growth, driven by a combination of high e-commerce demand, the need for sustainable and recyclable materials, and the rapid expansion of flexible packaging in the food and pharmaceutical industries. Stringent European and national regulations, such as the EU Packaging and Packaging Waste Regulation and the German Packaging Act (VerpackG), are forcing a shift towards circular economy principles. Demand is increasing for mono-material, recyclable, and bio-based plastics to meet these mandates.
Recent Developments
- In February 2026, Ethiopia enacted a nationwide ban on the production, sale, and use of single-use plastic bags under the Solid Waste Management Law (Proclamation 1383/2025). The Ethiopian Environmental Protection Authority (EPA) oversees compliance, with violations by individuals and businesses subjected to heavy fines and potential imprisonment.
Polybags Market Competitive Landscape Analysis
Tier 1 Companies
|
Rank
|
Company Name | Headquarters | Country | Why Relevant to This Market | Key Products / Material Portfolio |
| 1 | Berry Global Group, Inc. | Evansville, Indiana | United States | Global leader in polyethylene bags and flexible packaging with extensive manufacturing operations worldwide | Polyethylene polybags, retail bags, industrial bags, food packaging bags, recycled-content bags |
| 2 | Novolex Holdings, LLC | Hartsville, South Carolina | United States | One of North America's largest manufacturers of plastic bags and packaging products | Shopping bags, produce bags, trash bags, industrial polybags, food service bags |
| 3 | Inteplast Group Corporation | Livingston, New Jersey | United States | Leading producer of polybags, films, and industrial packaging products | Polybags, stretch films, merchandise bags, industrial packaging films |
| 4 | Amcor plc | Zürich | Switzerland | Major supplier of flexible plastic packaging and sustainable polybag solutions | Flexible polybags, recyclable packaging bags, barrier bags, specialty packaging films |
| 5 | Sealed Air Corporation | Charlotte, North Carolina | United States | Global leader in protective and food packaging with strong presence in polyethylene bag solutions | Protective polybags, food packaging bags, industrial packaging films |
Tier 2 Companies
|
Rank
|
Company Name | Headquarters | Country | Why Relevant to This Market | Key Products / Material Portfolio |
| 1 | Coveris Management GmbH | Vienna | Austria | Major producer of flexible packaging films and polybags for food and industrial applications | PE bags, barrier bags, industrial polybags, flexible packaging |
| 2 | Mondi plc | Weybridge, England | United Kingdom | Strong portfolio of sustainable flexible packaging, including recyclable plastic bag solutions | Flexible polybags, recyclable packaging bags, industrial bags |
| 3 | ProAmpac Holdings, Inc. | Cincinnati, Ohio | United States | Supplier of customized polybags for food, healthcare, and industrial packaging | Polybags, stand-up pouches, barrier bags, specialty flexible packaging |
| 4 | UFlex Limited | Noida, Uttar Pradesh | India | Integrated manufacturer of flexible packaging films and polybags serving global markets | PE bags, laminated bags, packaging films, specialty polybags |
| 5 | Sigma Plastics Group | Lyndhurst, New Jersey | United States | Major manufacturer of polyethylene films and industrial polybags | Industrial polybags, liner bags, agricultural films, stretch films |
Tier 3 Companies
|
Rank
|
Company Name | Headquarters | Country | Why Relevant to This Market | Key Products / Material Portfolio |
| 1 | International Plastics Inc. | Greenville, South Carolina | United States | Specialist in industrial polyethylene bags and packaging materials | Industrial polybags, reclosable bags, anti-static bags, liner bags |
| 2 | Poly-America, L.P. | Grand Prairie, Texas | United States | Major North American producer of polyethylene films and bags | Trash bags, industrial polybags, construction films, agricultural bags |
| 3 | Aalmir Plastic Industries LLC | Dubai | United Arab Emirates | Regional manufacturer supplying custom polyethylene bags for industrial and retail sectors | LDPE bags, HDPE bags, garbage bags, custom polybags |
| 4 | Cosmoplast Industrial Company LLC | Sharjah | United Arab Emirates | Producer of plastic bags and flexible packaging products across the Middle East | Shopping bags, garbage bags, polyethylene bags, packaging films |
| 5 | Command Packaging | Vernon, California | United States | Manufacturer focused on retail and reusable plastic bag solutions with recycled content | T-shirt bags, merchandise bags, recycled polybags, retail packaging |
Top players in the Polybags Market & Their Offerings:
- Sealed Air Corporation: Sealed Air produces polybags and flexible packaging products used in protective packaging, food storage, and e-commerce applications. Its solutions are widely used in logistics and industrial packaging.
- UFlex Limited: UFlex manufactures polybags and flexible packaging solutions for food, FMCG, and pharmaceutical sectors. The company is known for advanced packaging technologies and a strong presence in emerging markets.
- Cosmo Films Ltd.: Cosmo Films supplies BOPP films used in polybag production for packaging, labeling, and lamination applications. The company focuses on high-performance and sustainable film solutions.
- ProAmpac: ProAmpac produces polybags for food packaging, medical applications, and industrial use. The company emphasizes innovation in barrier films and sustainable packaging materials.
- Coveris Holdings S.A.: Coveris manufactures polybags and flexible plastic packaging for industrial, agricultural, and consumer applications. The company invests in recycling technologies and sustainable packaging innovations.
Polybags Market Top Players
- Mondi plc
- ALPLA Group
- Huhtamaki Oyj
- Amcor plc
- Berry Global Inc.
- Amcor Plc
- Novolex
- Inteplast Group
- Huhtamaki Group
- Printpack, Inc.
- Winpak Ltd.
- A-Pac Manufacturing Co., Inc.
- Arihant Packers
- PPC Flex
Polybags Market Segments List
By Material Type
- Polyethylene (PE)
- Low-Density Polyethylene (LDPE)
- High-Density Polyethylene (HDPE)
- Linear Low-Density Polyethylene (LLDPE)
- Polypropylene (PP)
- Biodegradable Plastics
- PLA (Polylactic Acid)
- PHA (Polyhydroxyalkanoates)
- Biodegradable Plastics
- Recycled Plastics
- Post-Consumer Recycled (PCR)
- Post-Industrial Recycled (PIR)
By Product Type
- Flat Polybags
- Gusseted Polybags
- Side Gusseted
- Bottom Gusseted
- Ziplock Bags
- Wicketed Bags
- Garbage Bags
- Others
- Anti-static Bags
- Vacuum Bags
By Thickness
- Less than 30 Microns
- 30–60 Microns
- Above 60 Microns
By End-Use Industry
- Retail & E-commerce
- Food & Beverage
- Healthcare
- Industrial
- Agriculture
- Others
By Distribution Channel
- Direct Sales (B2B)
- Distributors & Wholesalers
- Online Retail
By Regions
- North America:
- U.S.
- Canada
- Mexico
- Rest of North America
- Latin America:
- Brazil
- Argentina
- Rest of Latin America
- Europe:
- Western Europe
- Germany
- Italy
- France
- Netherlands
- Spain
- Portugal
- Belgium
- Ireland
- UK
- Iceland
- Switzerland
- Poland
- Rest of Western Europe
- Eastern Europe
- Austria
- Russia & Belarus
- Türkiye
- Albania
- Rest of Eastern Europe
- Asia Pacific:
- China
- Taiwan
- India
- Japan
- Australia and New Zealand
- ASEAN Countries (Singapore, Malaysia)
- South Korea
- Rest of APAC
- MEA:
- GCC Countries
- Saudi Arabia
- United Arab Emirates (UAE)
- Qatar
- Kuwait
- Oman
- Bahrain
- South Africa
- Egypt
- Rest of MEA
- GCC Countries
A Seven-Phase Framework
Our methodology is designed to be universally applicable across commodity chemicals, specialty chemicals, petrochemicals, construction chemicals, coatings, electronic chemicals, industrial gases, agrochemicals, water treatment chemicals, and performance materials. Each phase builds upon the last, creating a layered validation structure that minimizes estimation error and maximizes analytical confidence.
The framework ensures comprehensive market coverage, robust cross-validation, and reliable long-term forecasting — producing market estimates that withstand scrutiny from investors, regulators, and corporate strategy teams.

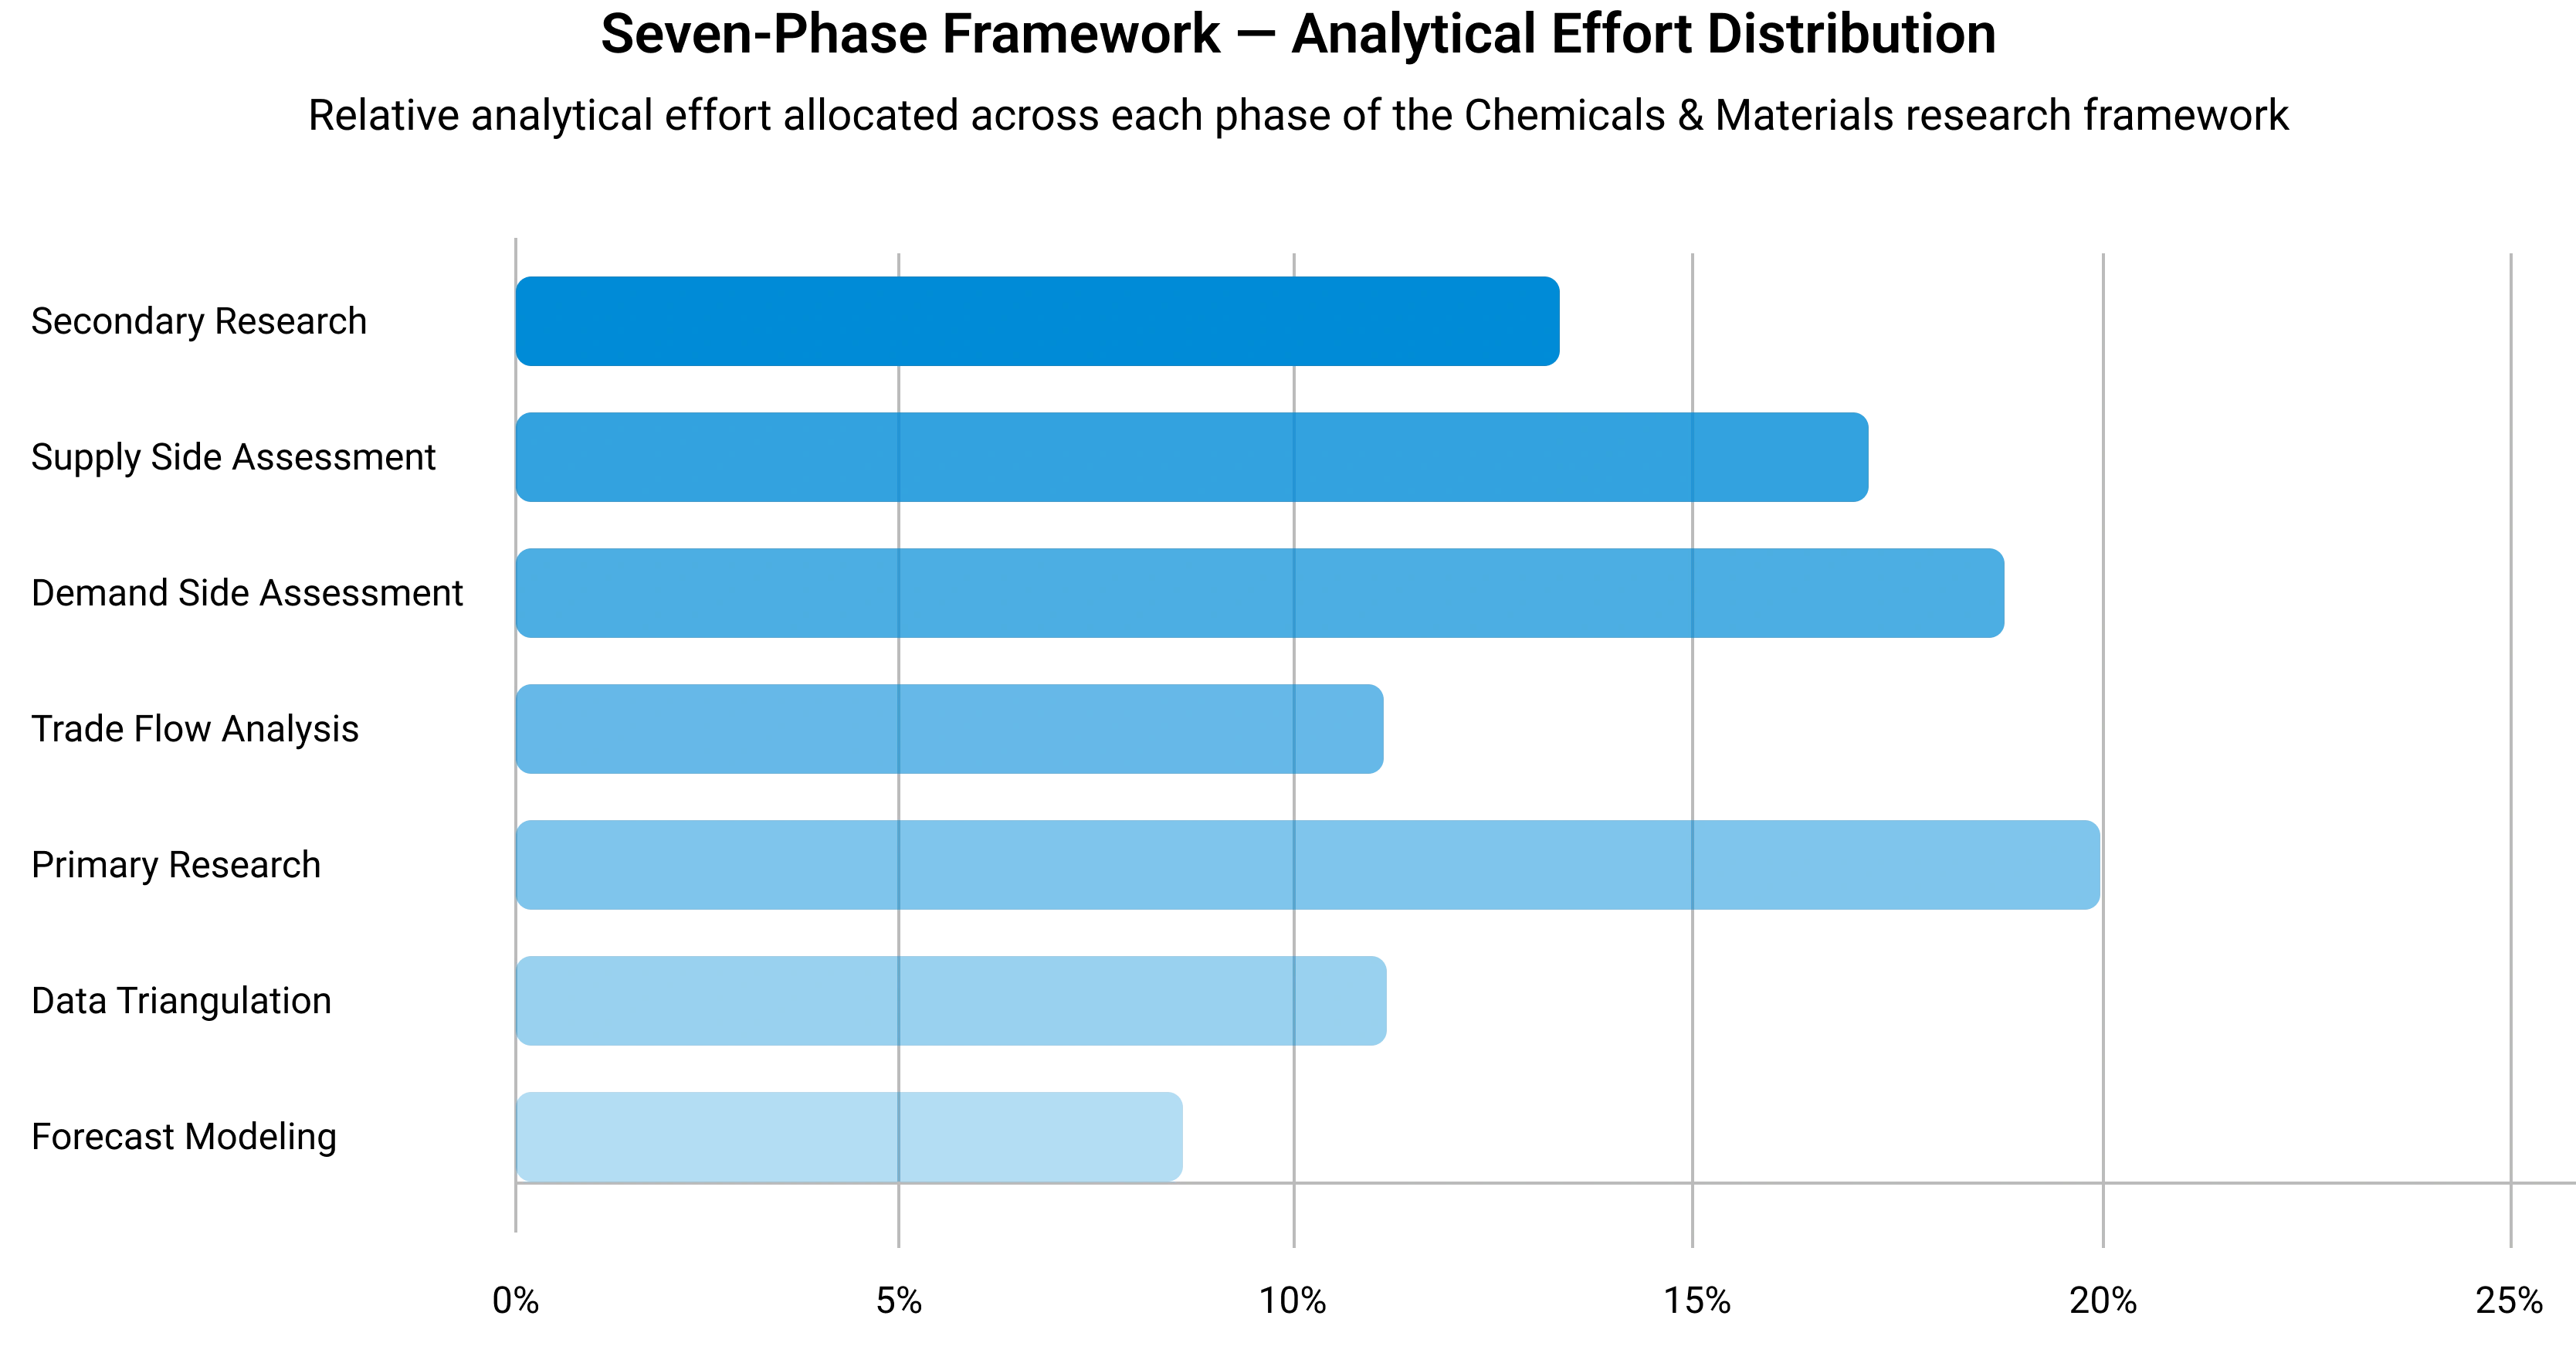
Seven-Phase Framework — Analytical Effort Distribution
Relative analytical effort allocated across each phase of the Chemicals & Materials research framework
Phase 1 - Secondary Research: Establishing the Foundation
Secondary research collects and evaluates publicly available information from authoritative sources, establishing the foundational understanding of market structure, value chain dynamics, competitive landscape, and end-use demand patterns. Every source is evaluated for credibility, recency, geographic relevance, and methodological soundness before inclusion.
Industry Associations
Sources include ACC, CEFIC, ICCA, JCIA, CPCIF, and SOCMA providing production volumes, consumption trends, capacity developments, and sustainability initiatives.
Company Disclosures
Annual reports, investor presentations, earnings transcripts, and regulatory filings reveal product portfolios, manufacturing footprints, capacity expansions, and revenue segmentation.
Government Databases
National statistical offices, customs authorities, environmental agencies, and industrial production databases provide verified statistics on output, trade flows, and regulatory compliance.
Trade Databases
UN Comtrade, ITC, Eurostat, and national customs authorities enable assessment of global product movement, import dependency, and export competitiveness across regions.
Our Secondary Research Sources
- Ministry of Chemicals and Fertilizers
- European Chemicals Agency
- United States Department of Energy
- Ministry of Industry and Information Technology
- Ministry of Economy Trade and Industry
- Ministry of Trade Industry and Energy
- National Institute of Standards and Technology
- Council of Scientific and Industrial Research
- Fraunhofer Society
- National Institute for Materials Science
Phase 2 — Supply-Side Assessment: Mapping Production Capabilities
Production Capacity Analysis
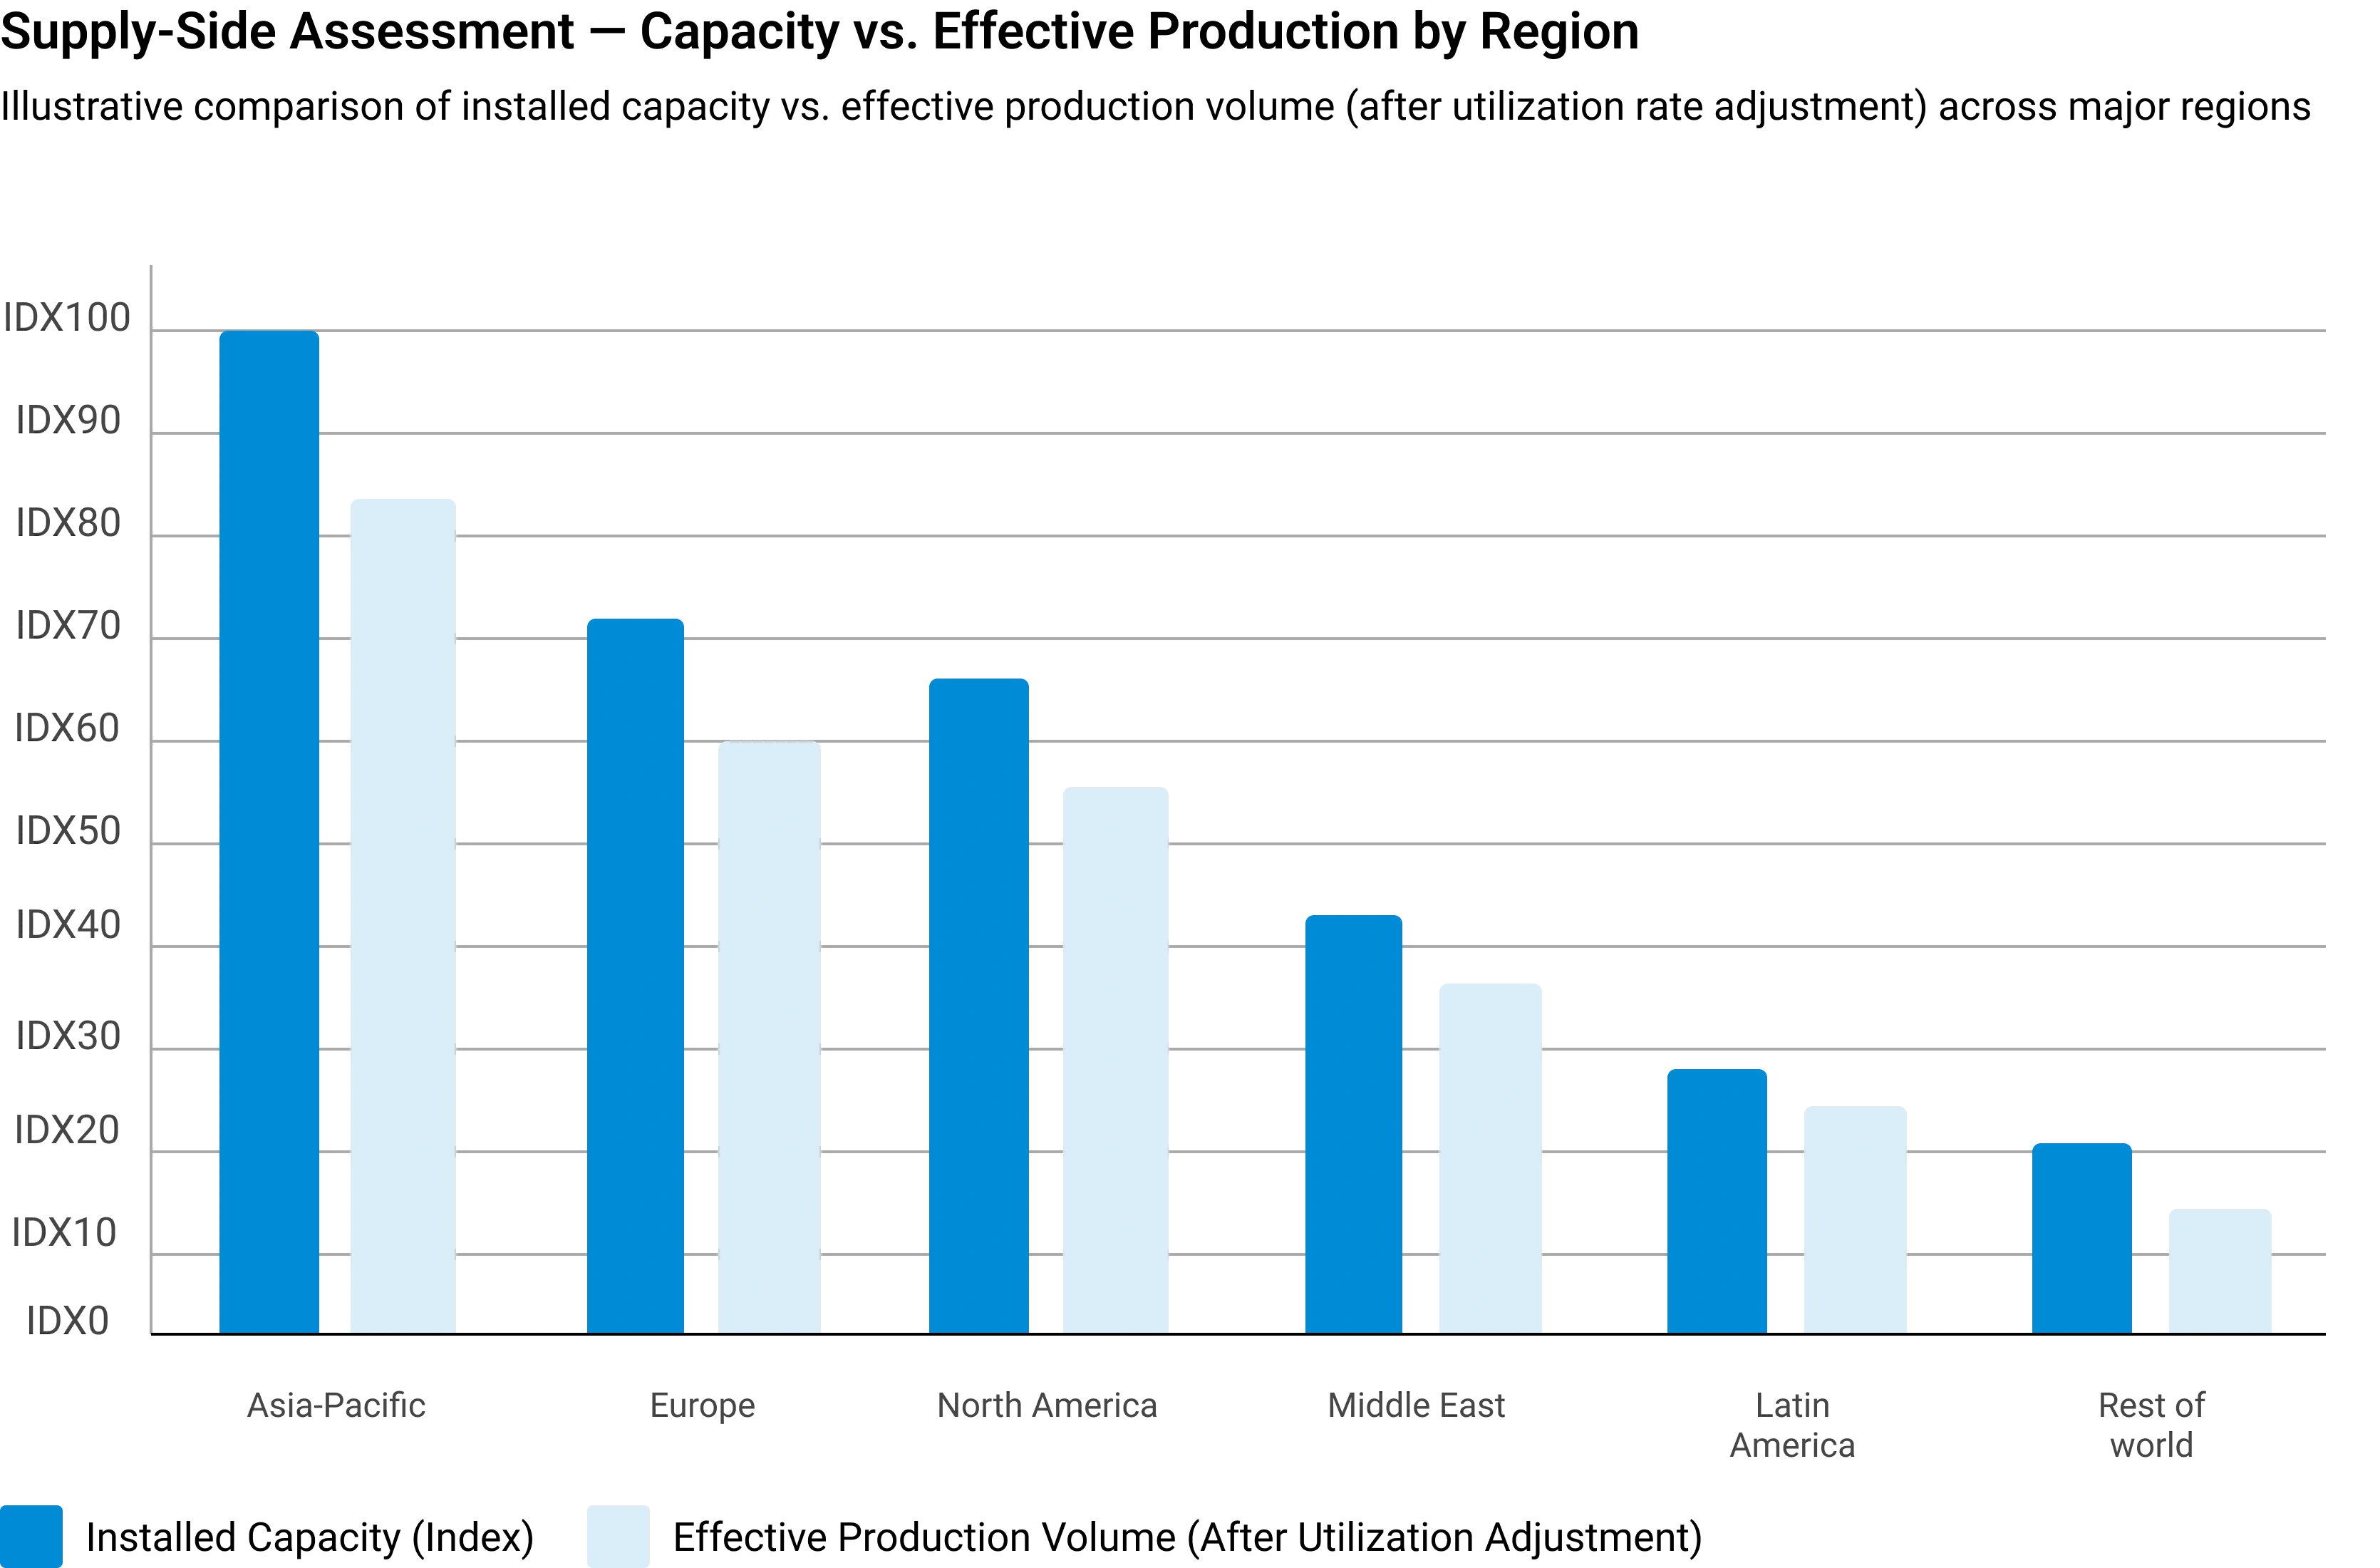
All major manufacturers are assessed for existing installed capacity, planned additions, expansions, new plant announcements, and technology adoption — mapped at global, regional, and country levels.
Capacity Utilization Adjustment
Installed capacity is adjusted using utilization rates based on demand conditions, feedstock availability, plant operating rates, maintenance schedules, and regulatory restrictions.
Manufacturer Revenue Analysis
Product-specific revenues, segment-level performance, regional distribution, average selling prices, and margin trends are evaluated to establish market value estimates.
Supply-Side Assessment — Capacity vs. Effective Production by Region
Illustrative comparison of installed capacity vs. effective production volume (after utilization rate adjustment) across major regions
Phase 3 — Demand-Side Assessment: Quantifying Chemical Consumption
Demand-side analysis quantifies chemical consumption across industries, applications, and geographies — identifying where and how chemicals are consumed throughout the value chain with precision.
End-Use Industry Analysis
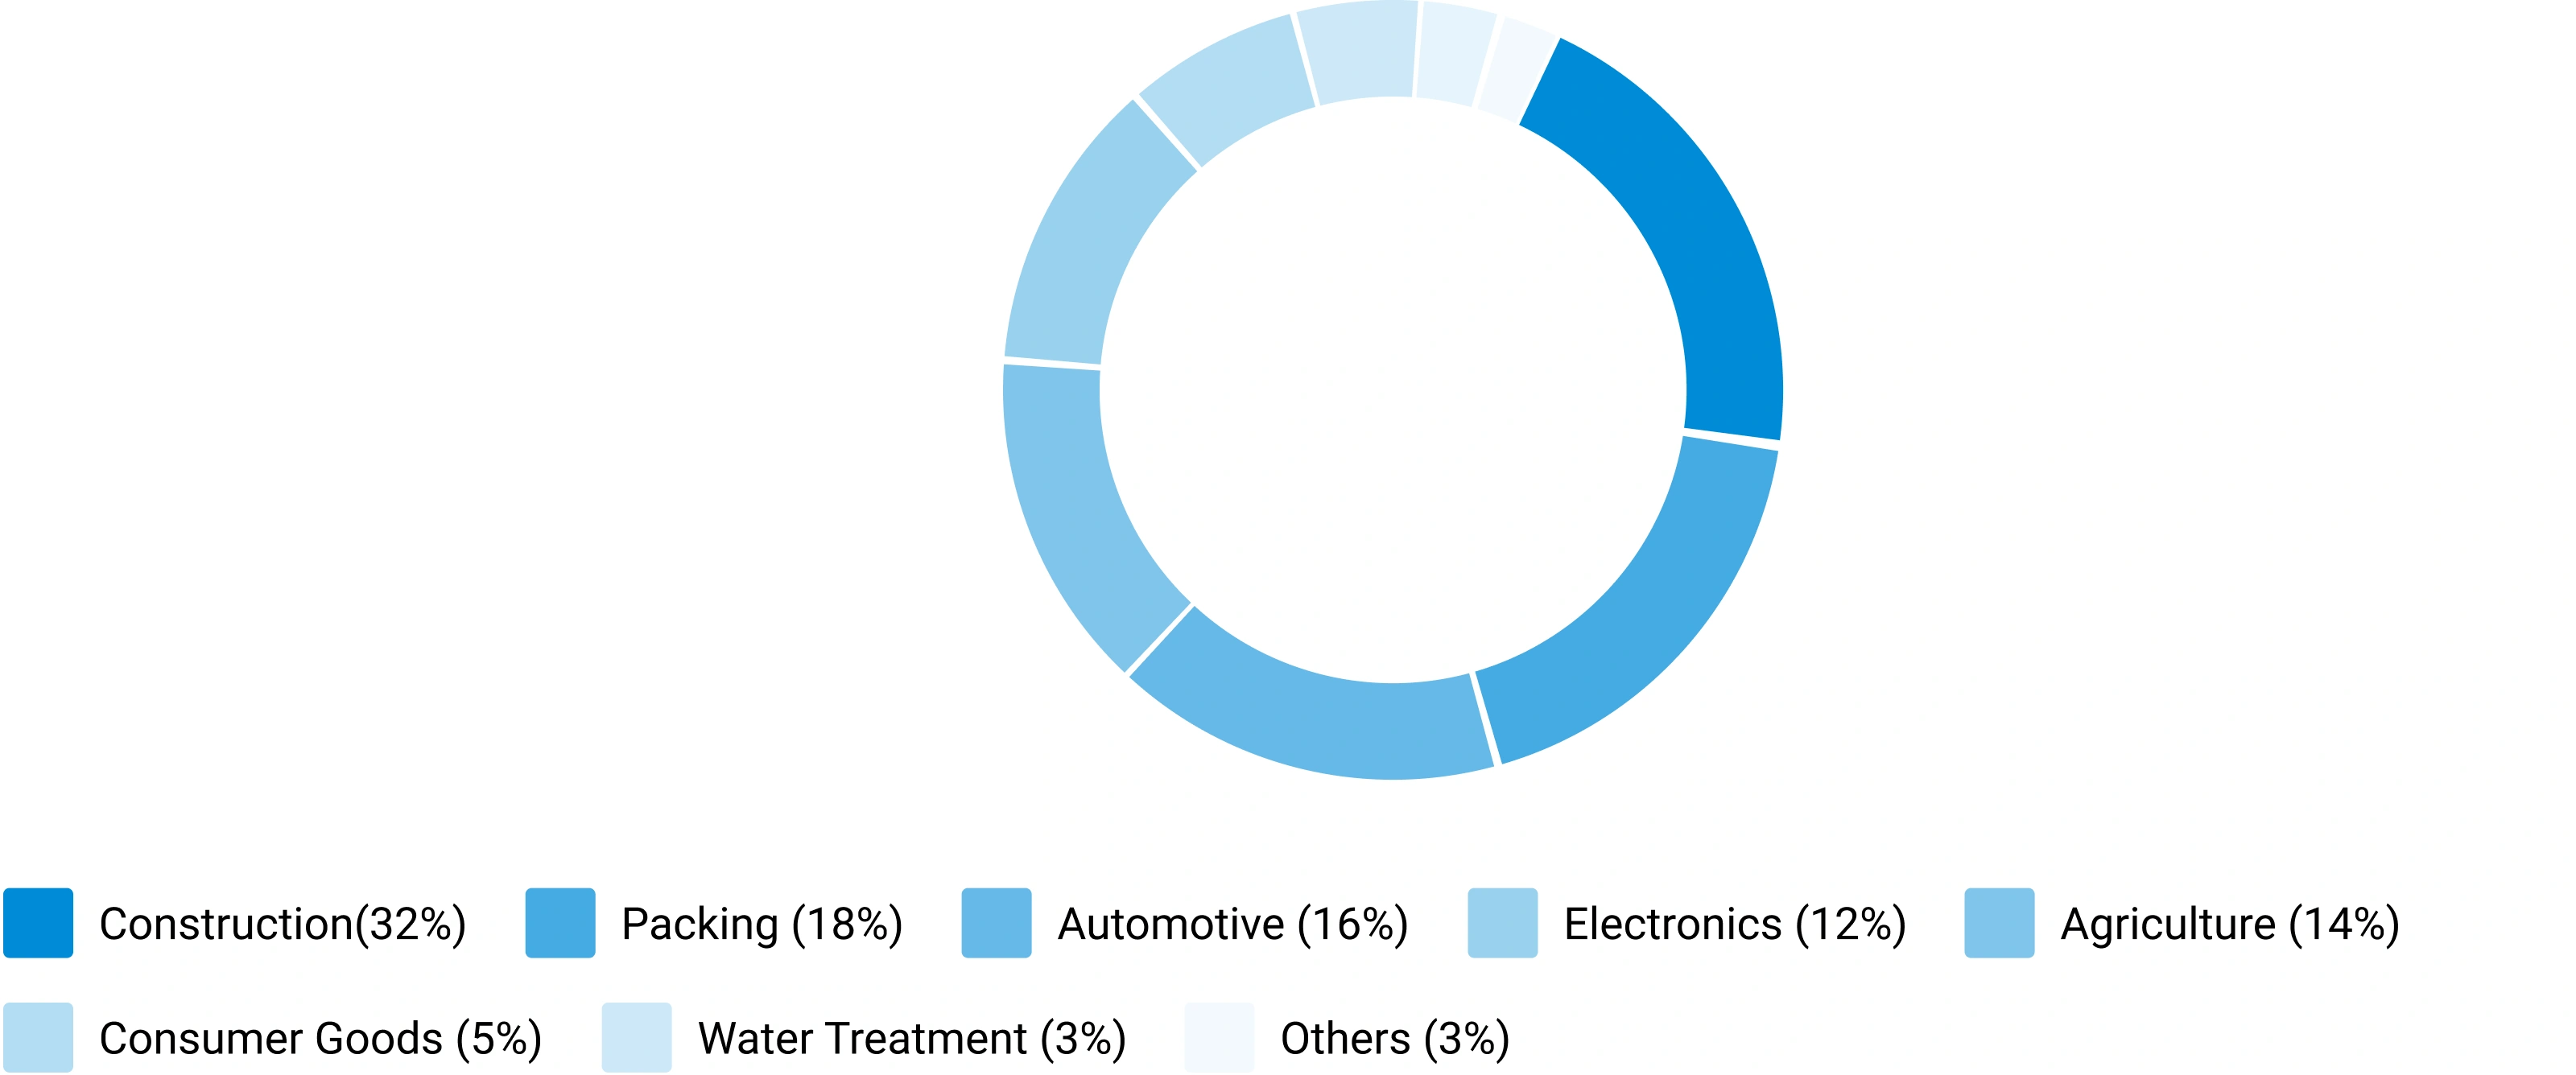
Chemical demand is evaluated across automotive, construction, packaging, electronics, agriculture, healthcare, consumer goods, industrial manufacturing, energy and utilities, and water treatment. Industry output, production trends, and consumption intensity are analyzed to determine demand patterns.
Consumption Modeling
Demand is estimated using measurable indicators: kilograms per vehicle, kilograms per square meter of construction, dosage per cubic meter of water treated, kilograms per hectare of agricultural land, and kilograms per ton of manufactured products. Consumption factors are validated through industry publications and primary interviews.
Application Analysis
The market is segmented by application area to understand product performance requirements, formulation trends, technology adoption, customer preferences, and regulatory requirements improving demand accuracy and segmentation granularity.
Demand-Side Assessment — End-Use Industry Demand Distribution
Illustrative distribution of chemical & materials demand across key end-use industries
Phase 4 - Trade Flow Analysis: Balancing Regional Supply and Demand
Trade flow analysis reconciles regional supply and demand estimates through import and export data, identifying net supply positions, regional dependencies, and market imbalances. It serves as an independent validation layer that tests the consistency of supply-side and demand-side estimates.
Import Analysis
Import data is evaluated to determine volumes, source countries, product dependency, regional supply gaps, and pricing trends — identifying markets that rely heavily on external supply and where domestic production is insufficient to meet demand.
Export Analysis
Export assessments reveal production surplus, export competitiveness, regional manufacturing strength, and global market participation. Export patterns also help validate domestic production estimates and identify net exporting regions.
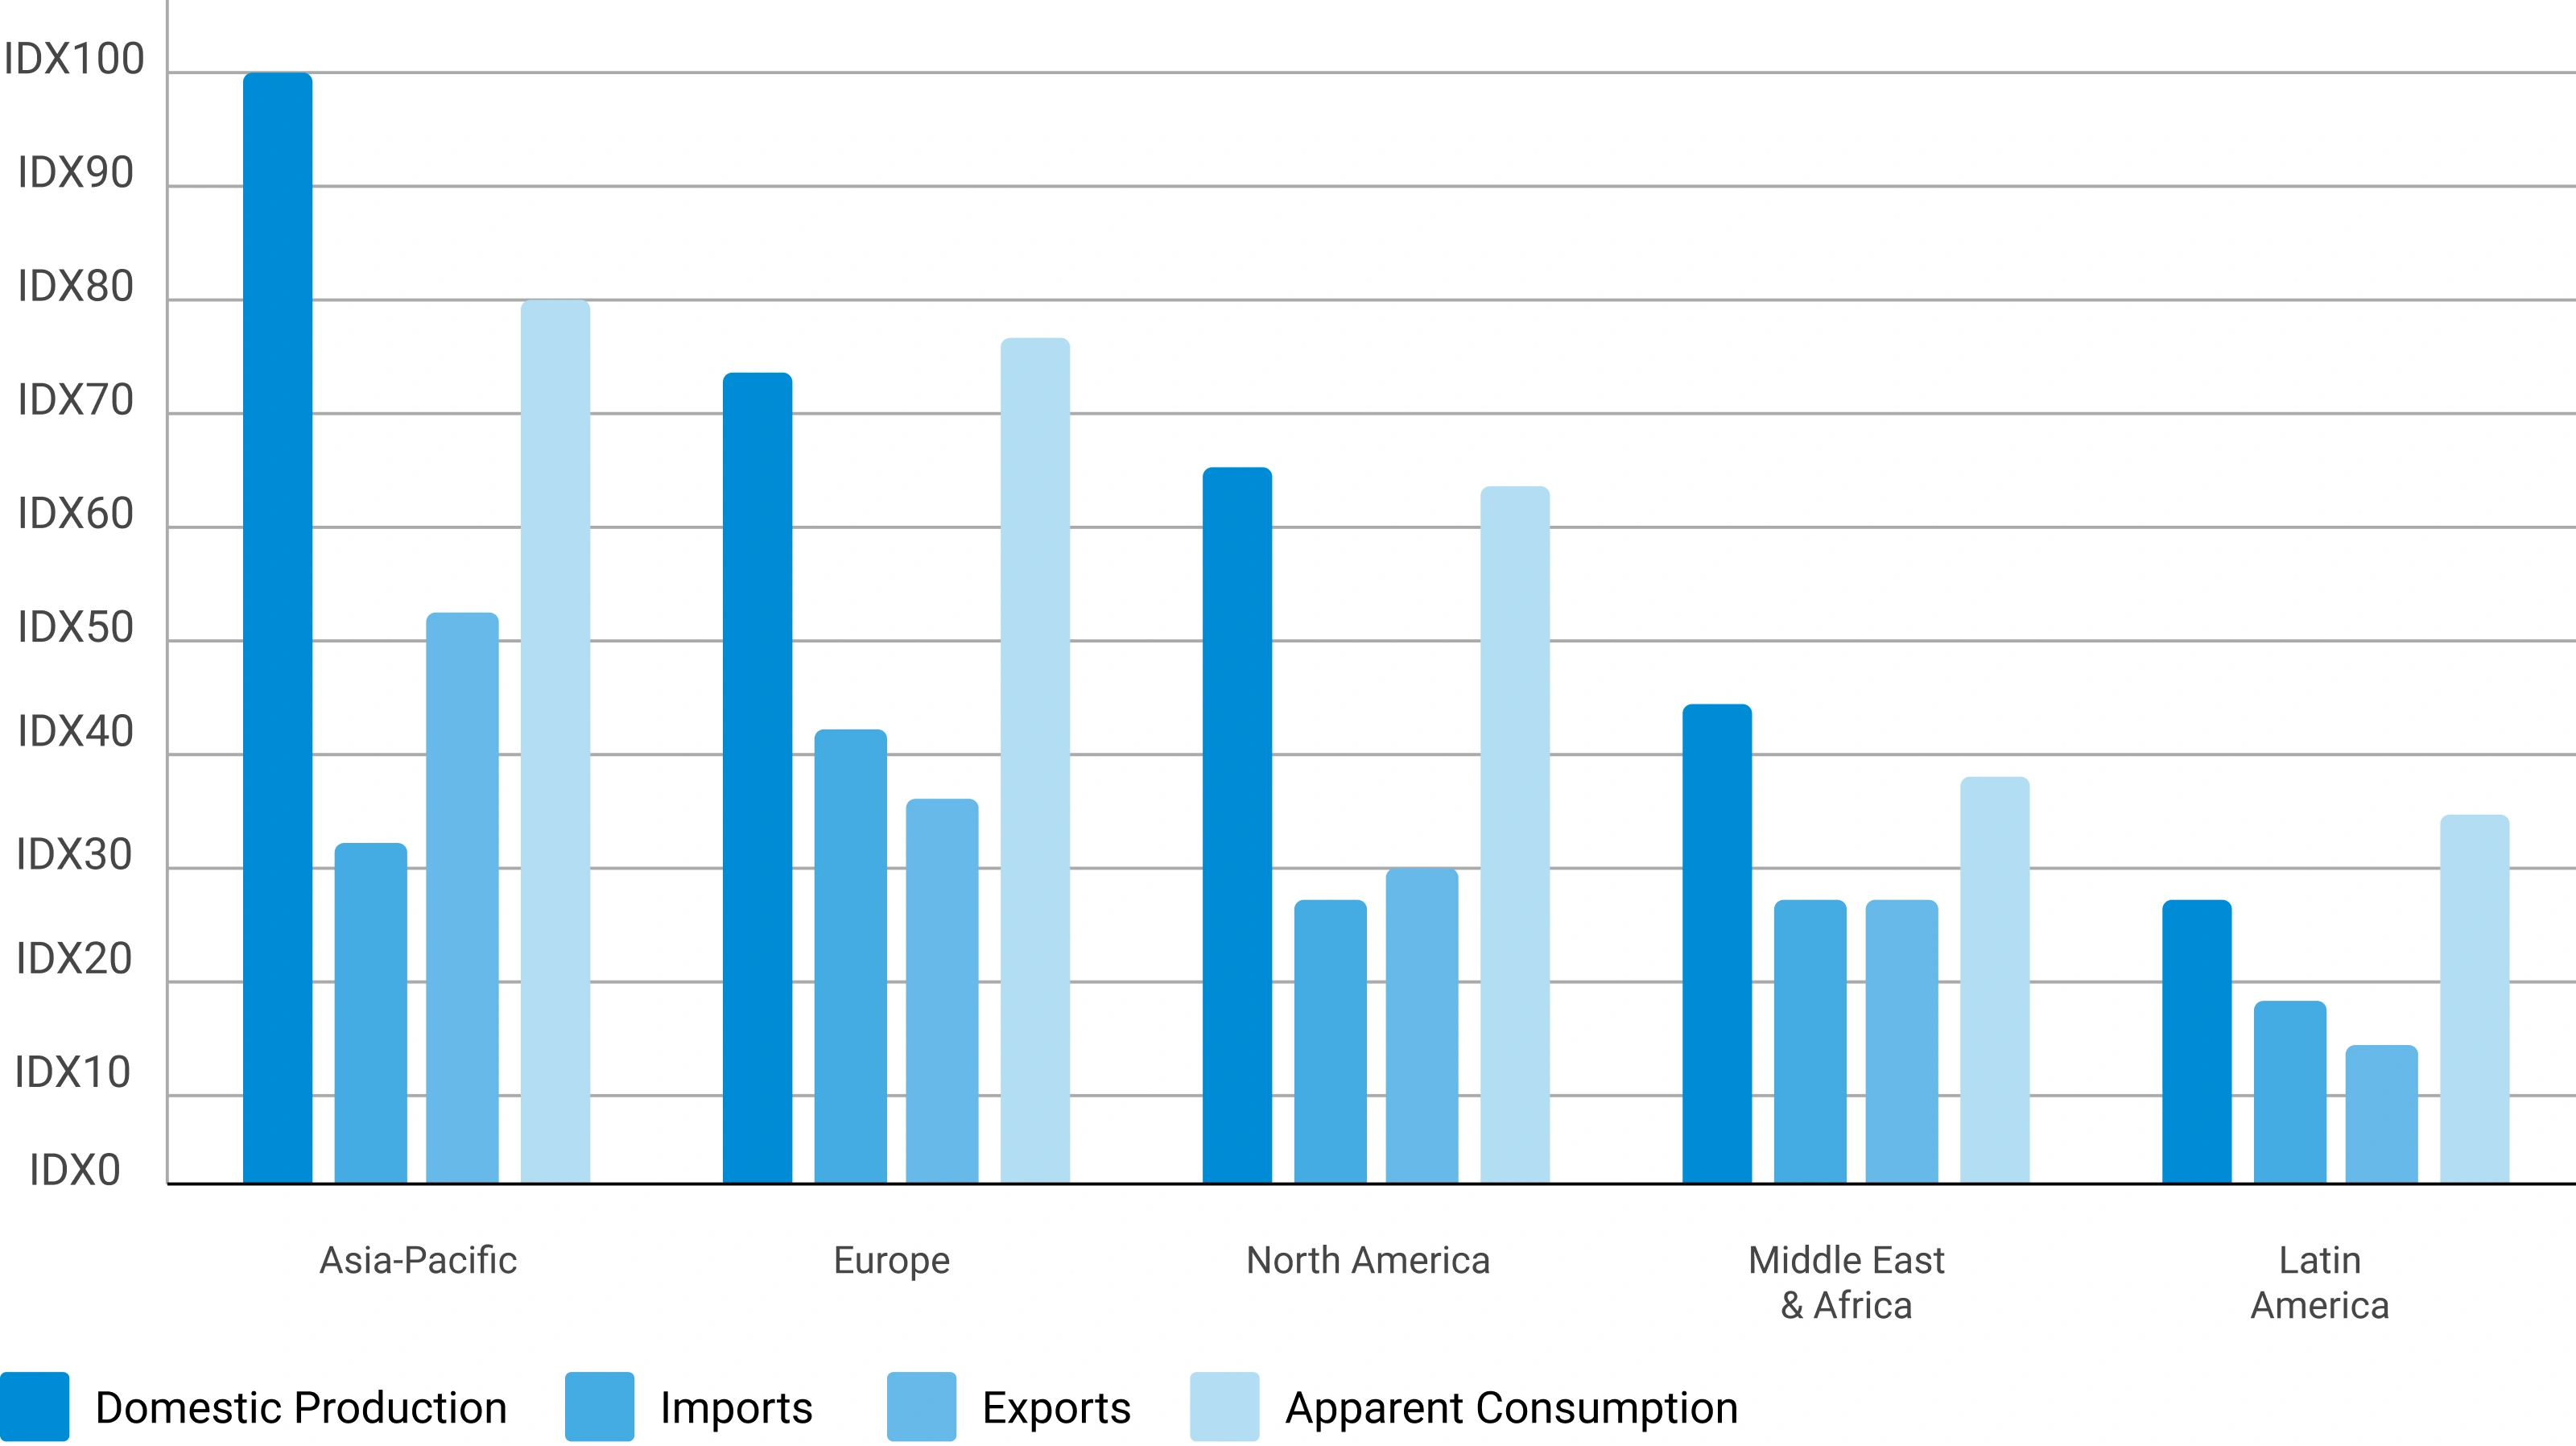
Apparent Consumption Model
Regional consumption is assessed using the standard apparent consumption formula:
Results identify net importing regions, net exporting regions, regional deficits, and surpluses — serving as an independent validation of supply and demand estimates.
Trade Flow Analysis — Net Supply Position by Region
Illustrative apparent consumption vs. domestic production across major regions — positive gap indicates net import dependency
Phase 5 — Primary Research: The Critical Validation Layer
Primary research tests and refines findings from secondary research through direct engagement with industry participants across the supply chain, demand side, and expert community. It captures intelligence that no database or published report can provide — the real-world experience of manufacturers, buyers, and specialists operating in the market.

Supply-Side Interviews
Conversations with chemical manufacturers, raw material suppliers, contract manufacturers, technology providers, and plant operators cover production trends, capacity utilization, pricing developments, technology shifts, and competitive dynamics.

Demand-Side Interviews
Engagement with OEMs, industrial consumers, procurement managers, distributors, formulators, and end-use manufacturers focuses on consumption trends, purchasing behavior, product substitution, demand outlook, and emerging applications.

Industry Expert Consultations
Additional interviews with industry consultants, independent experts, regulatory specialists, technical professionals, and research institutions provide deeper market context and validate key analytical assumptions.
Focus Areas of Primary Research:
Market Size & Forecast Validation
Revenue estimates, volume consumption, growth rates, forecast assumptions, regional demand.Supply Chain & Value Chain Assessment
Raw material sourcing, supply chain challenges, distribution networks, procurement practices.Production & Capacity Analysis
Manufacturing capacity, utilization rates, expansion projects, plant investments.Pricing & Cost Structure Analysis
Product pricing trends, feedstock costs, energy costs, margin pressures, pricing outlook.Competitive Landscape Assessment
Volume and value estimates confirmed to be fully consistent with one another before publicationInterview Volume by Market Scope
| Study Scope | Number of Interviews |
|---|---|
| Niche Market | 20 – 30 |
| Mid-Sized Market | 30 – 50 |
| Global Market | 50 – 80 |
| Highly Fragmented Market | 80 – 120 |
Interview Details:
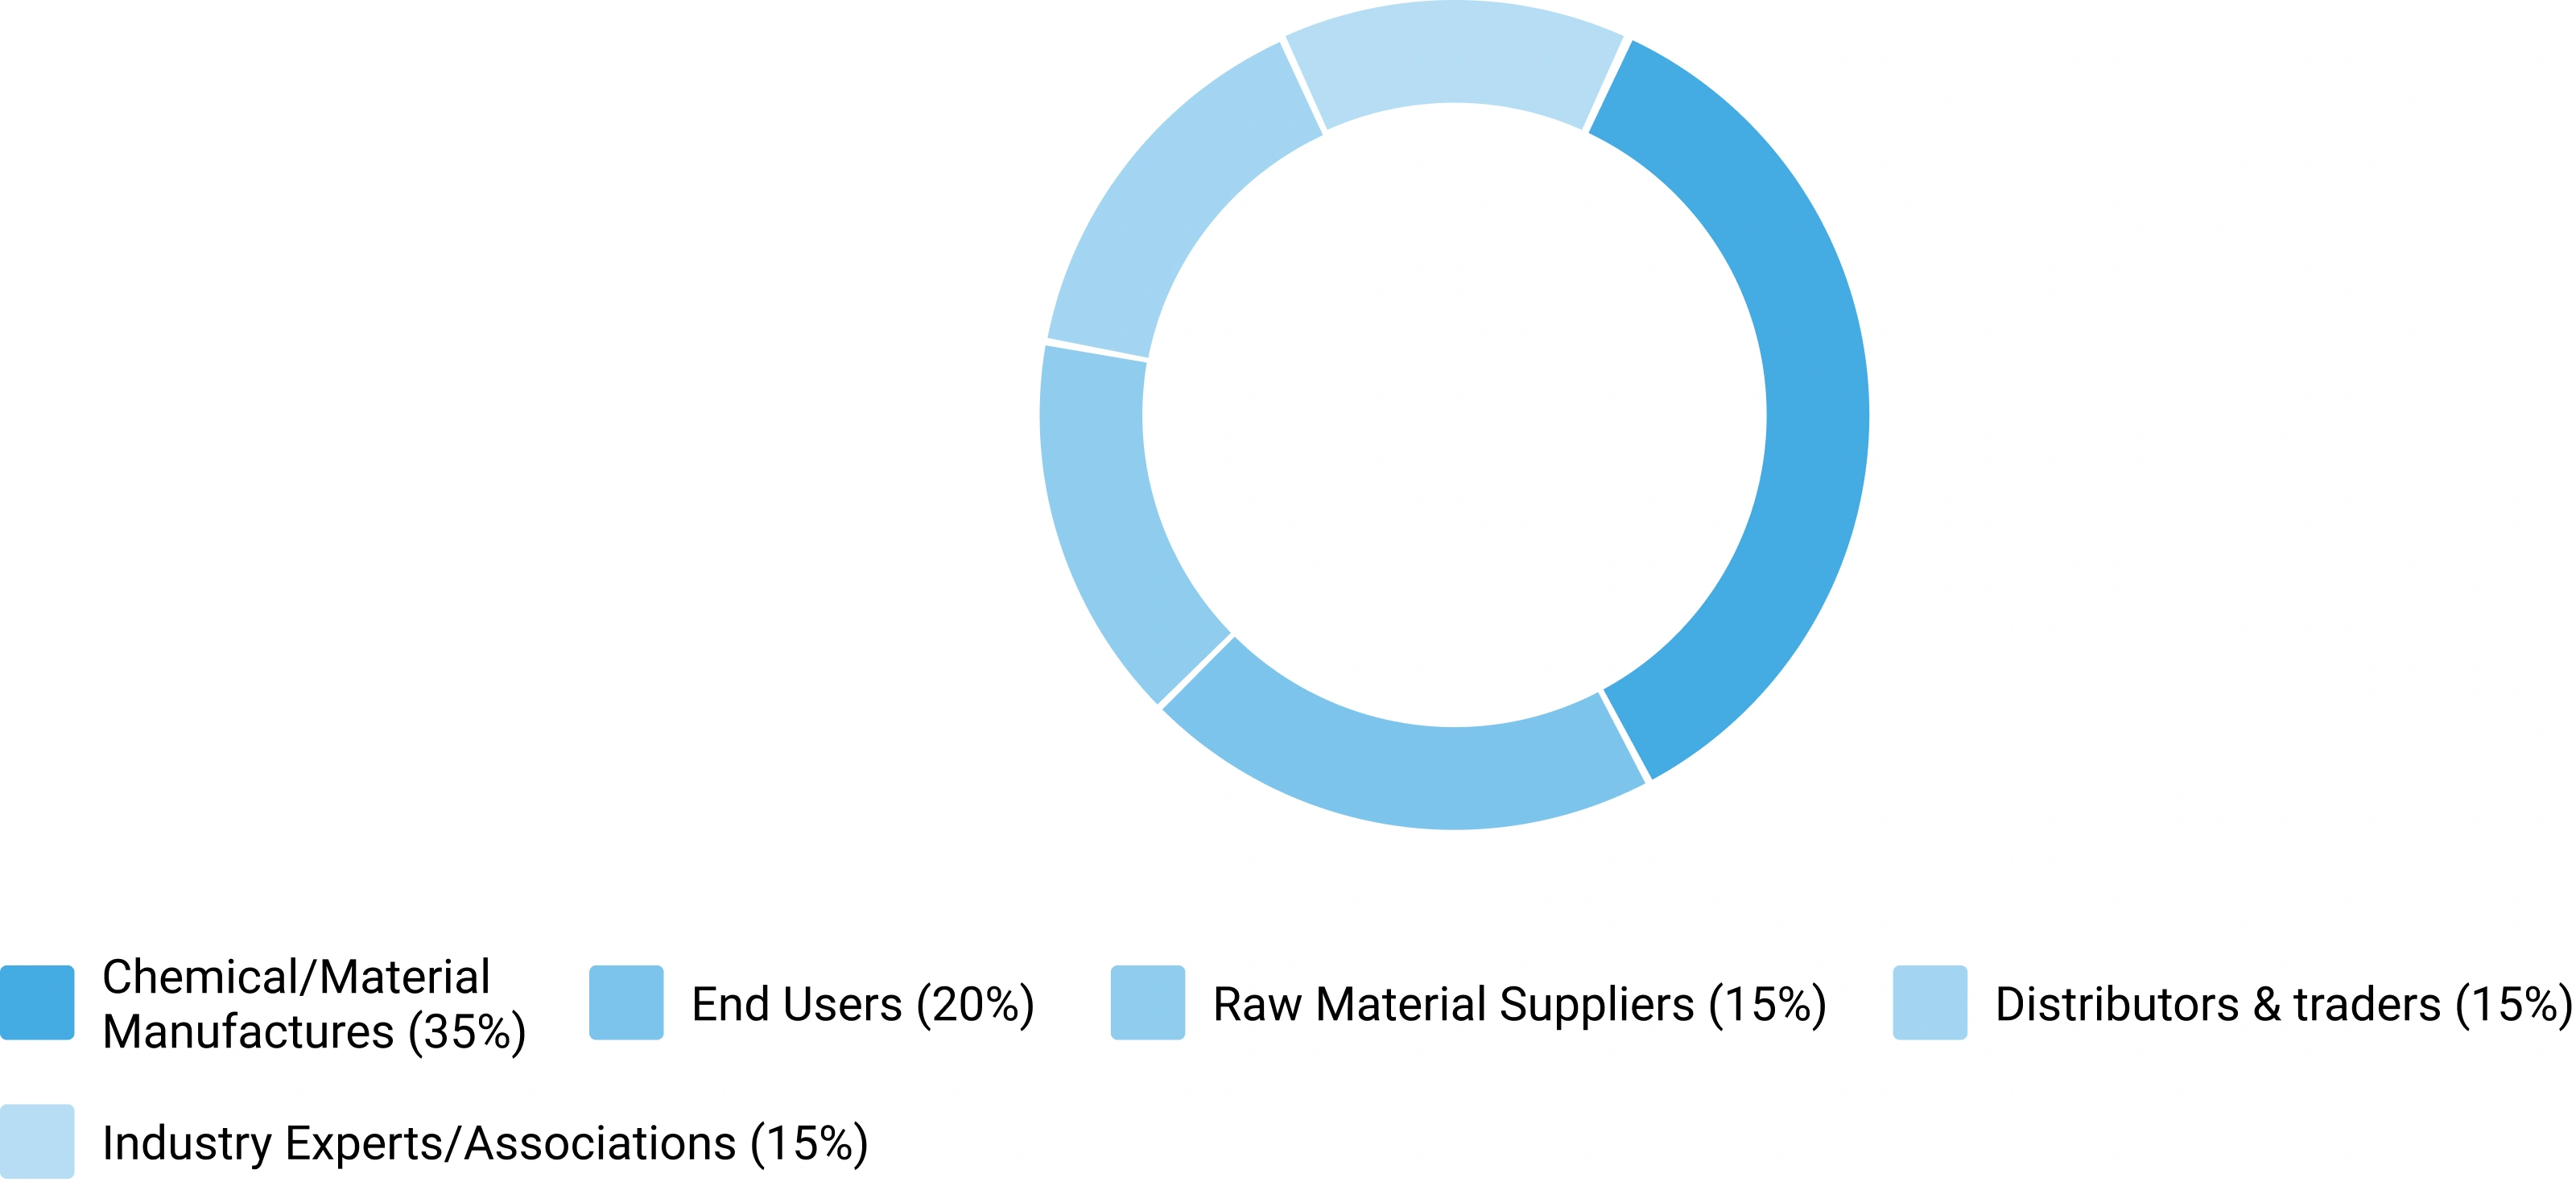
Category : Manufacturers, Suppliers, Distributors, End Users, Experts/Associations
Average Duration : 30–60 Minutes
Interview Mode : Video calls, telephonic interviews, expert consultations
Interview Format : Structured / Semi-Structured questionnaire
Focus Areas of Primary Research:
Market Size & Forecast Validation :
Revenue estimates, volume consumption, growth rates, forecast assumptions, regional demand.
Supply Chain & Value Chain Assessment :
Raw material sourcing, supply chain challenges, distribution networks, procurement practices.
Production & Capacity Analysis :
Manufacturing capacity, utilization rates, expansion projects, plant investments.
Pricing & Cost Structure Analysis :
Product pricing trends, feedstock costs, energy costs, margin pressures, pricing outlook.
Competitive Landscape Assessment :
Market share, competitor positioning, strategic initiatives, partnerships, acquisitions.
Primary Research — Stakeholder Coverage by Category
Distribution of interview respondents across stakeholder categories (% share from PPT data)
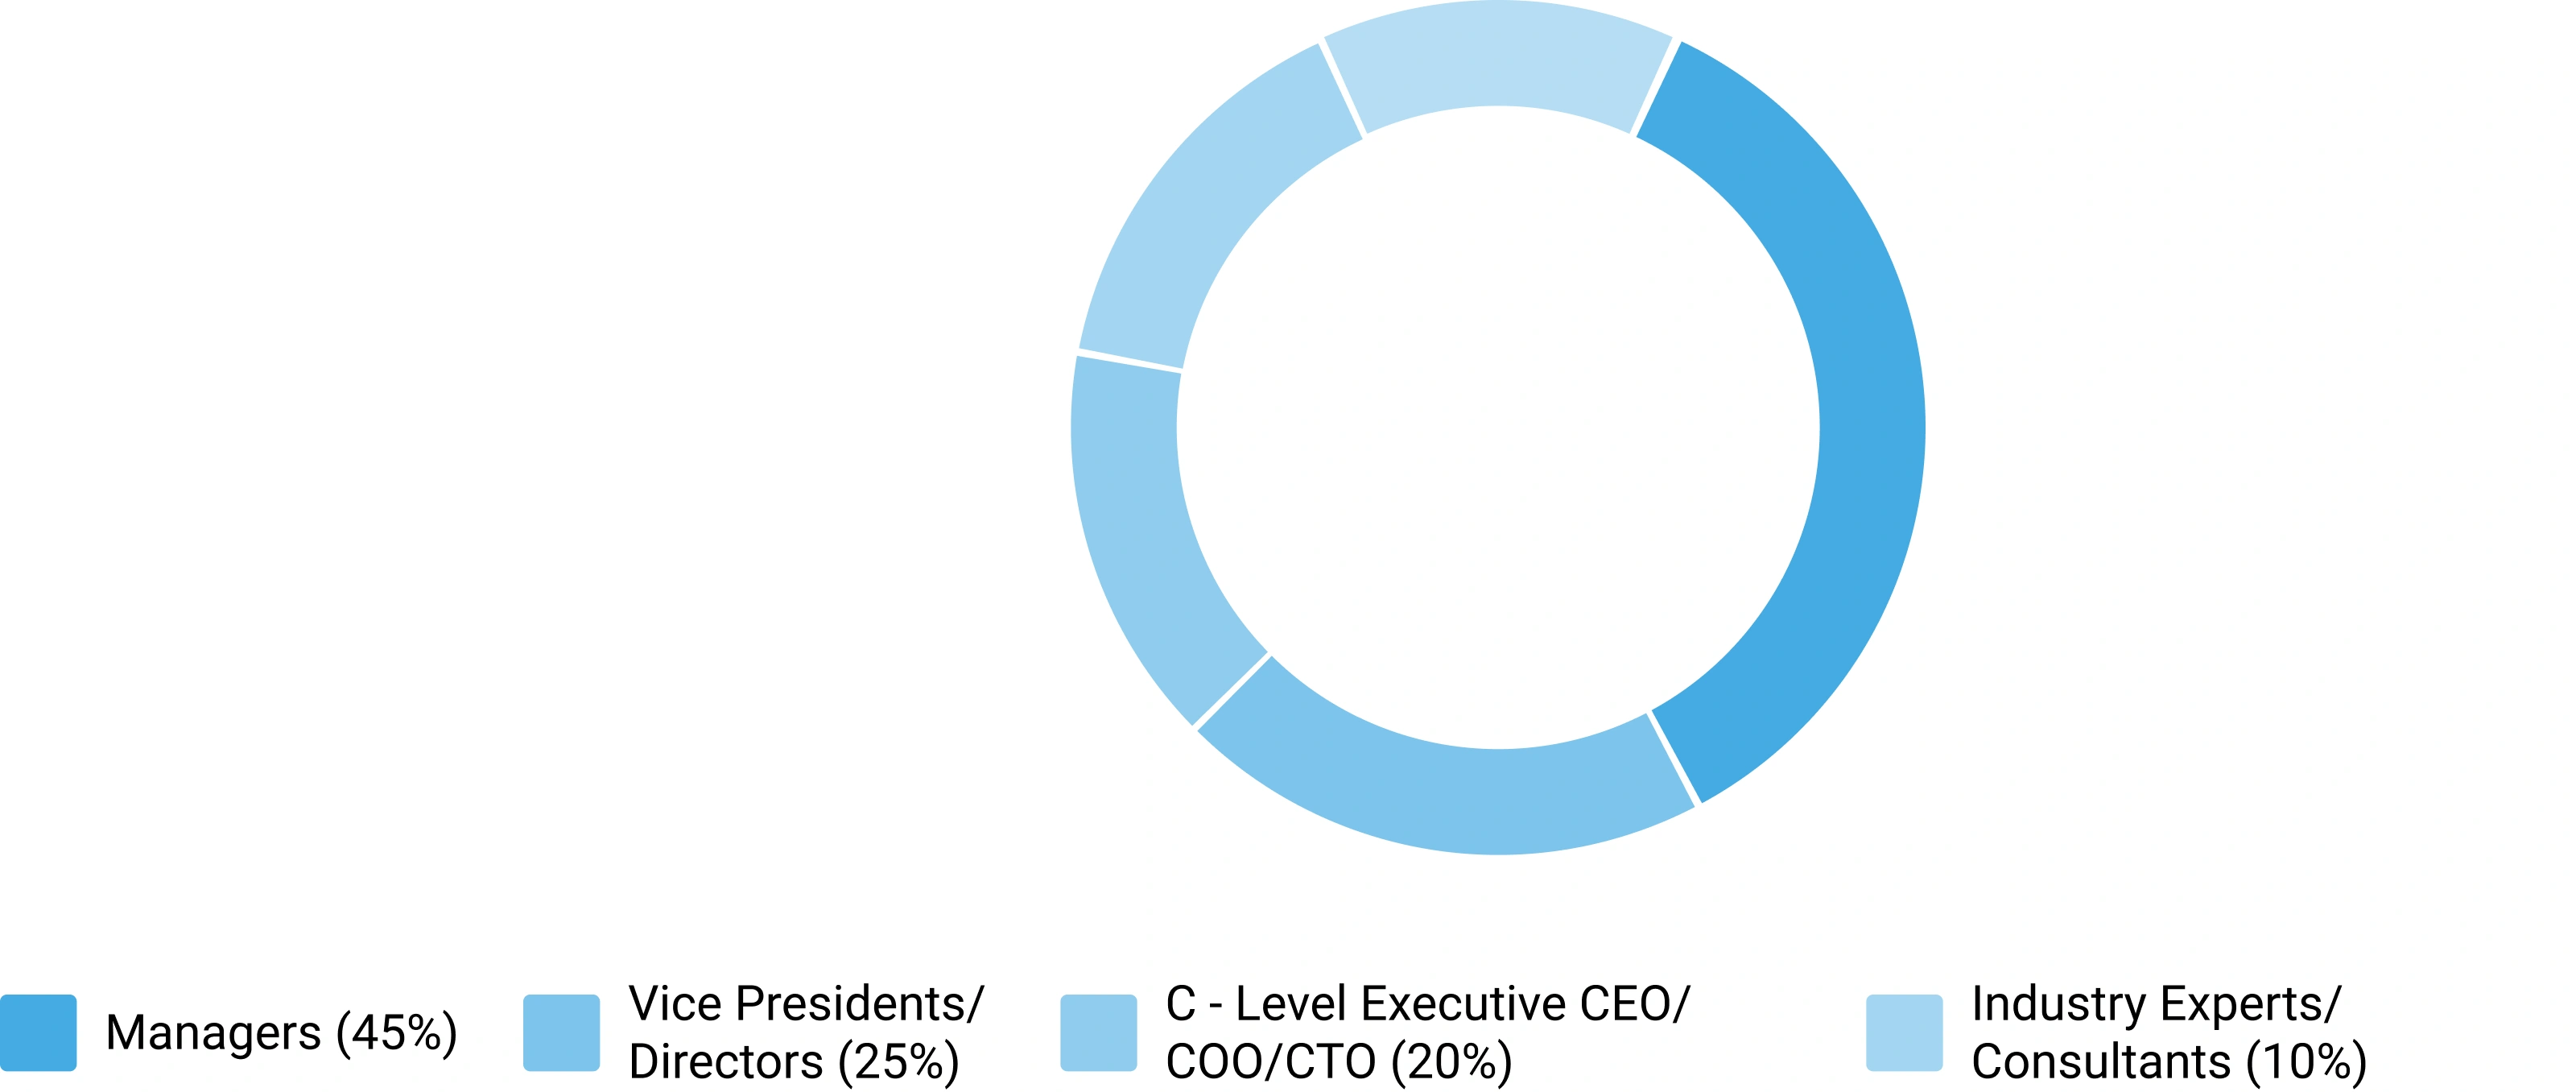
Primary Research — Respondent Designation Profile
Seniority breakdown of interview respondents (% share from PPT data)
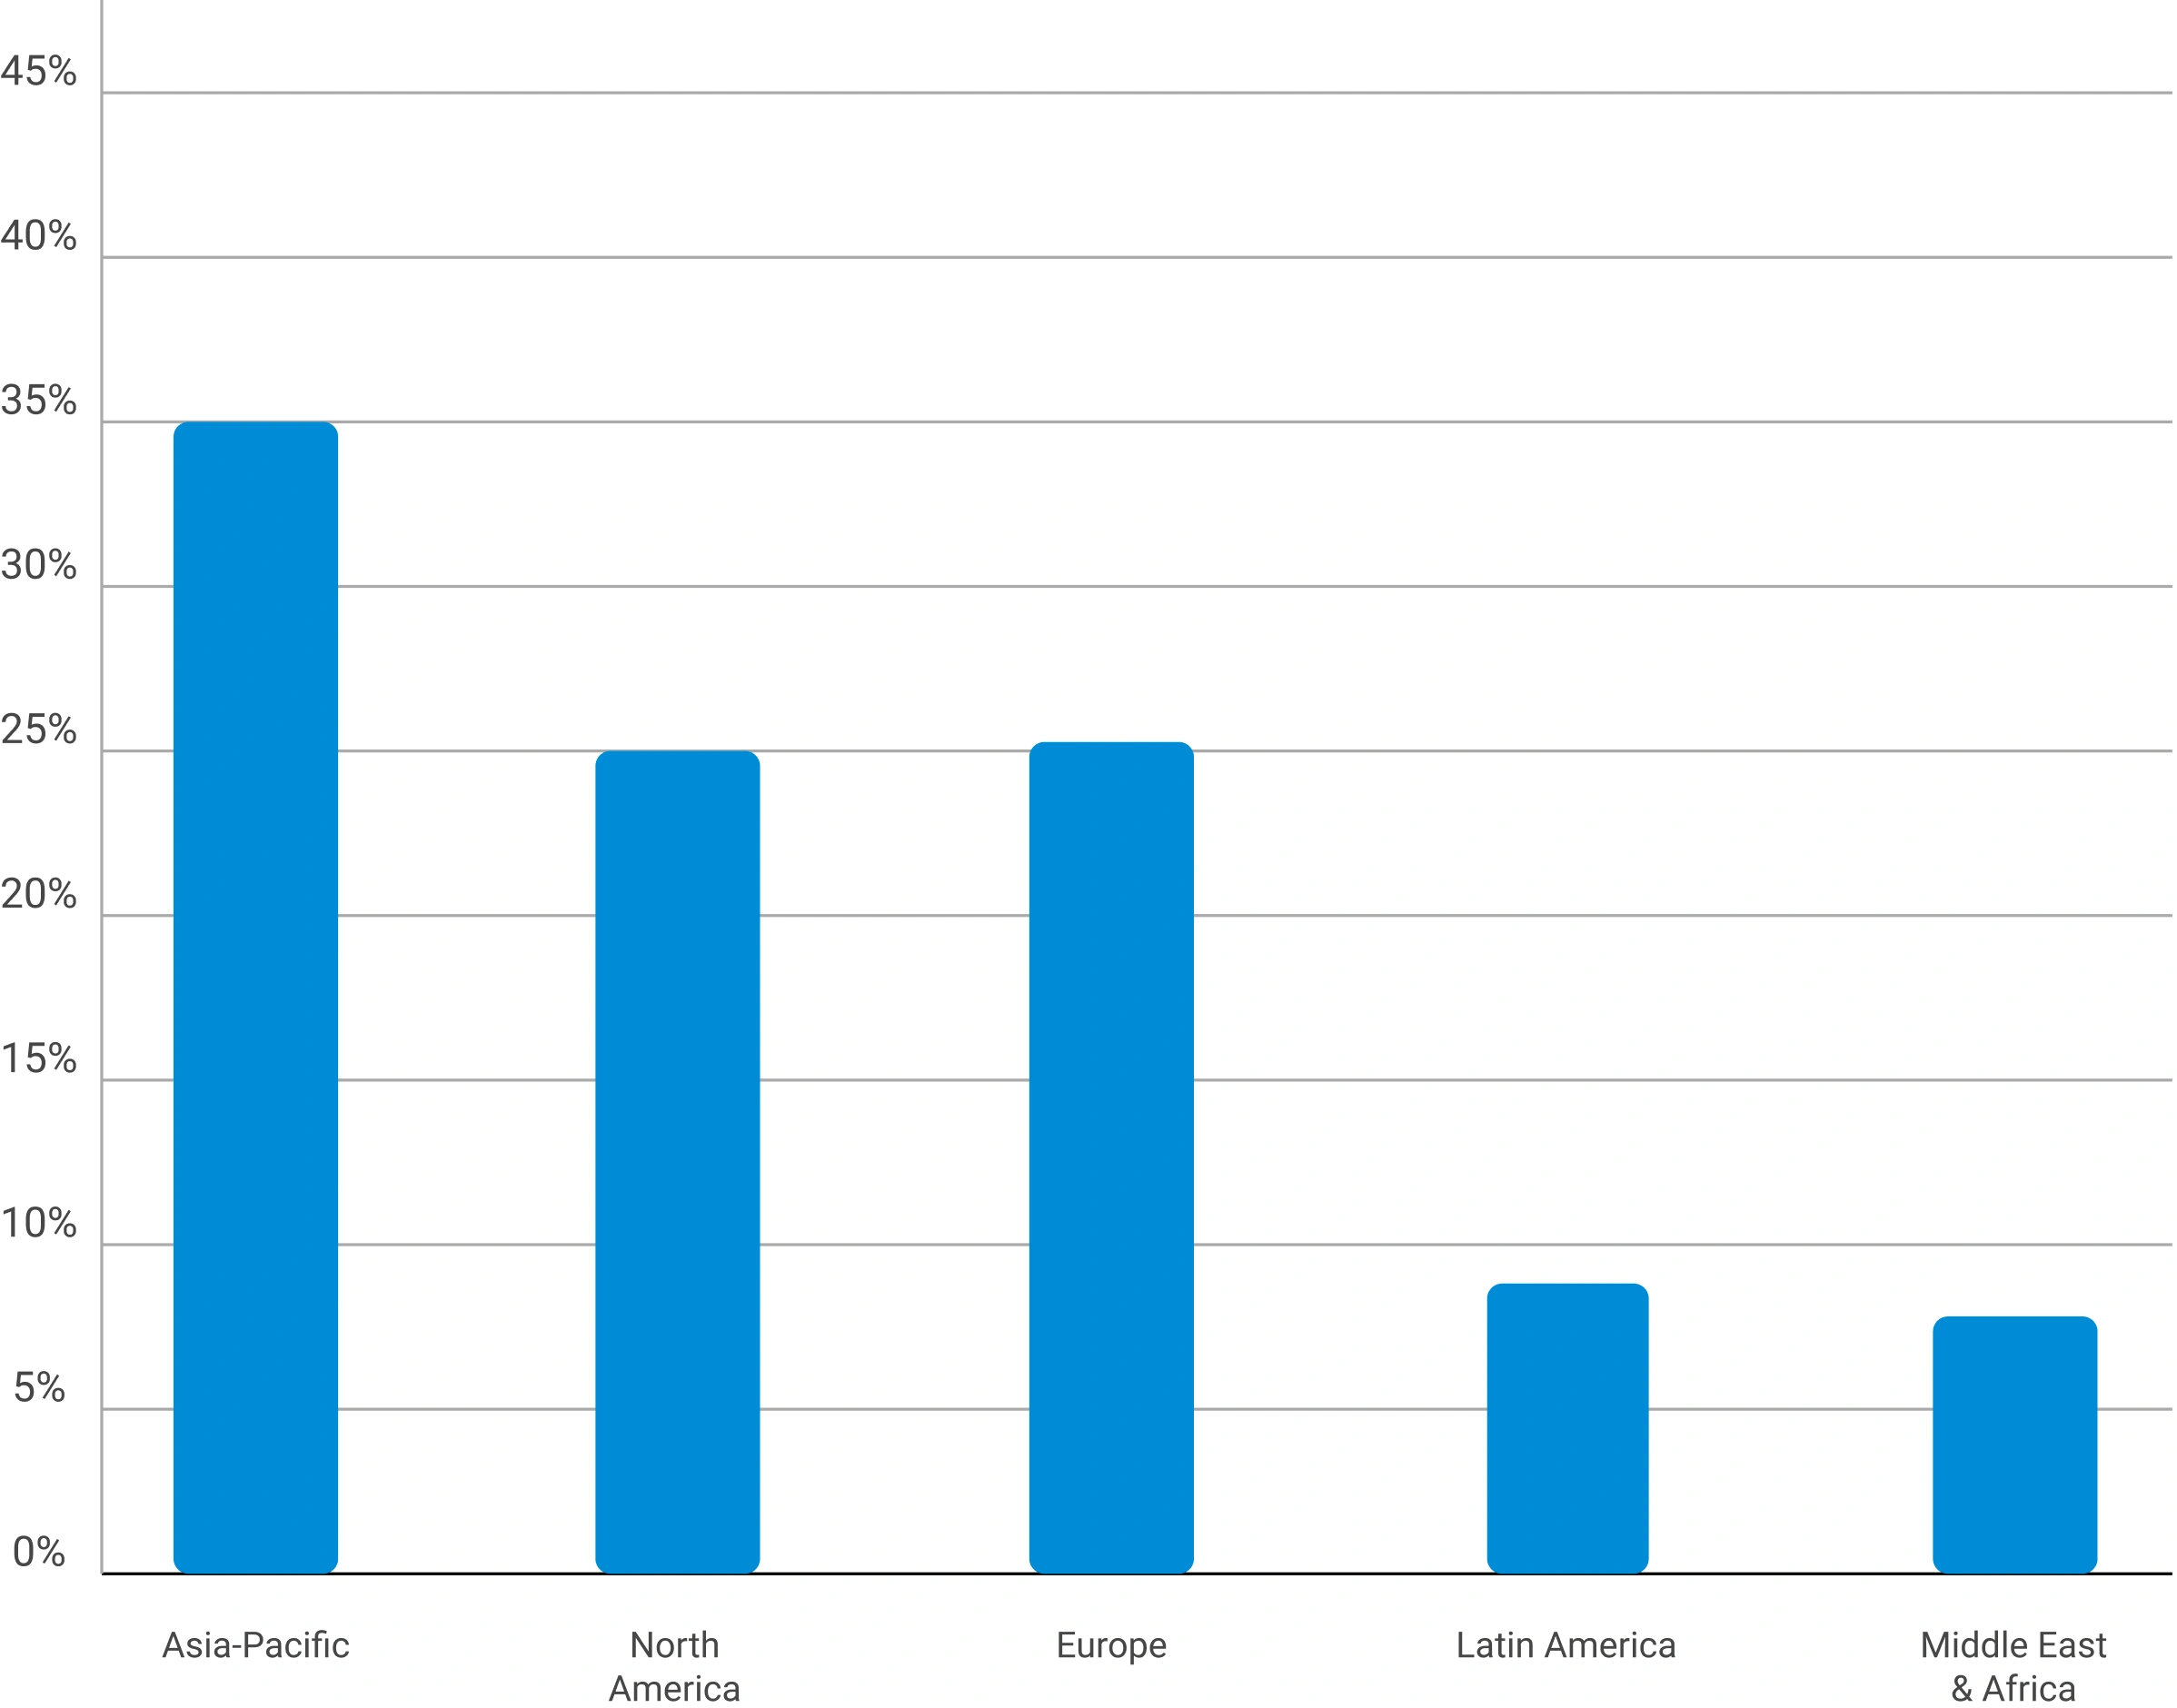
Primary Research — Geographic Coverage of Interviews
Regional distribution of primary research engagement (% share from PPT data)
Phase 6 — Data Triangulation and Market Validation
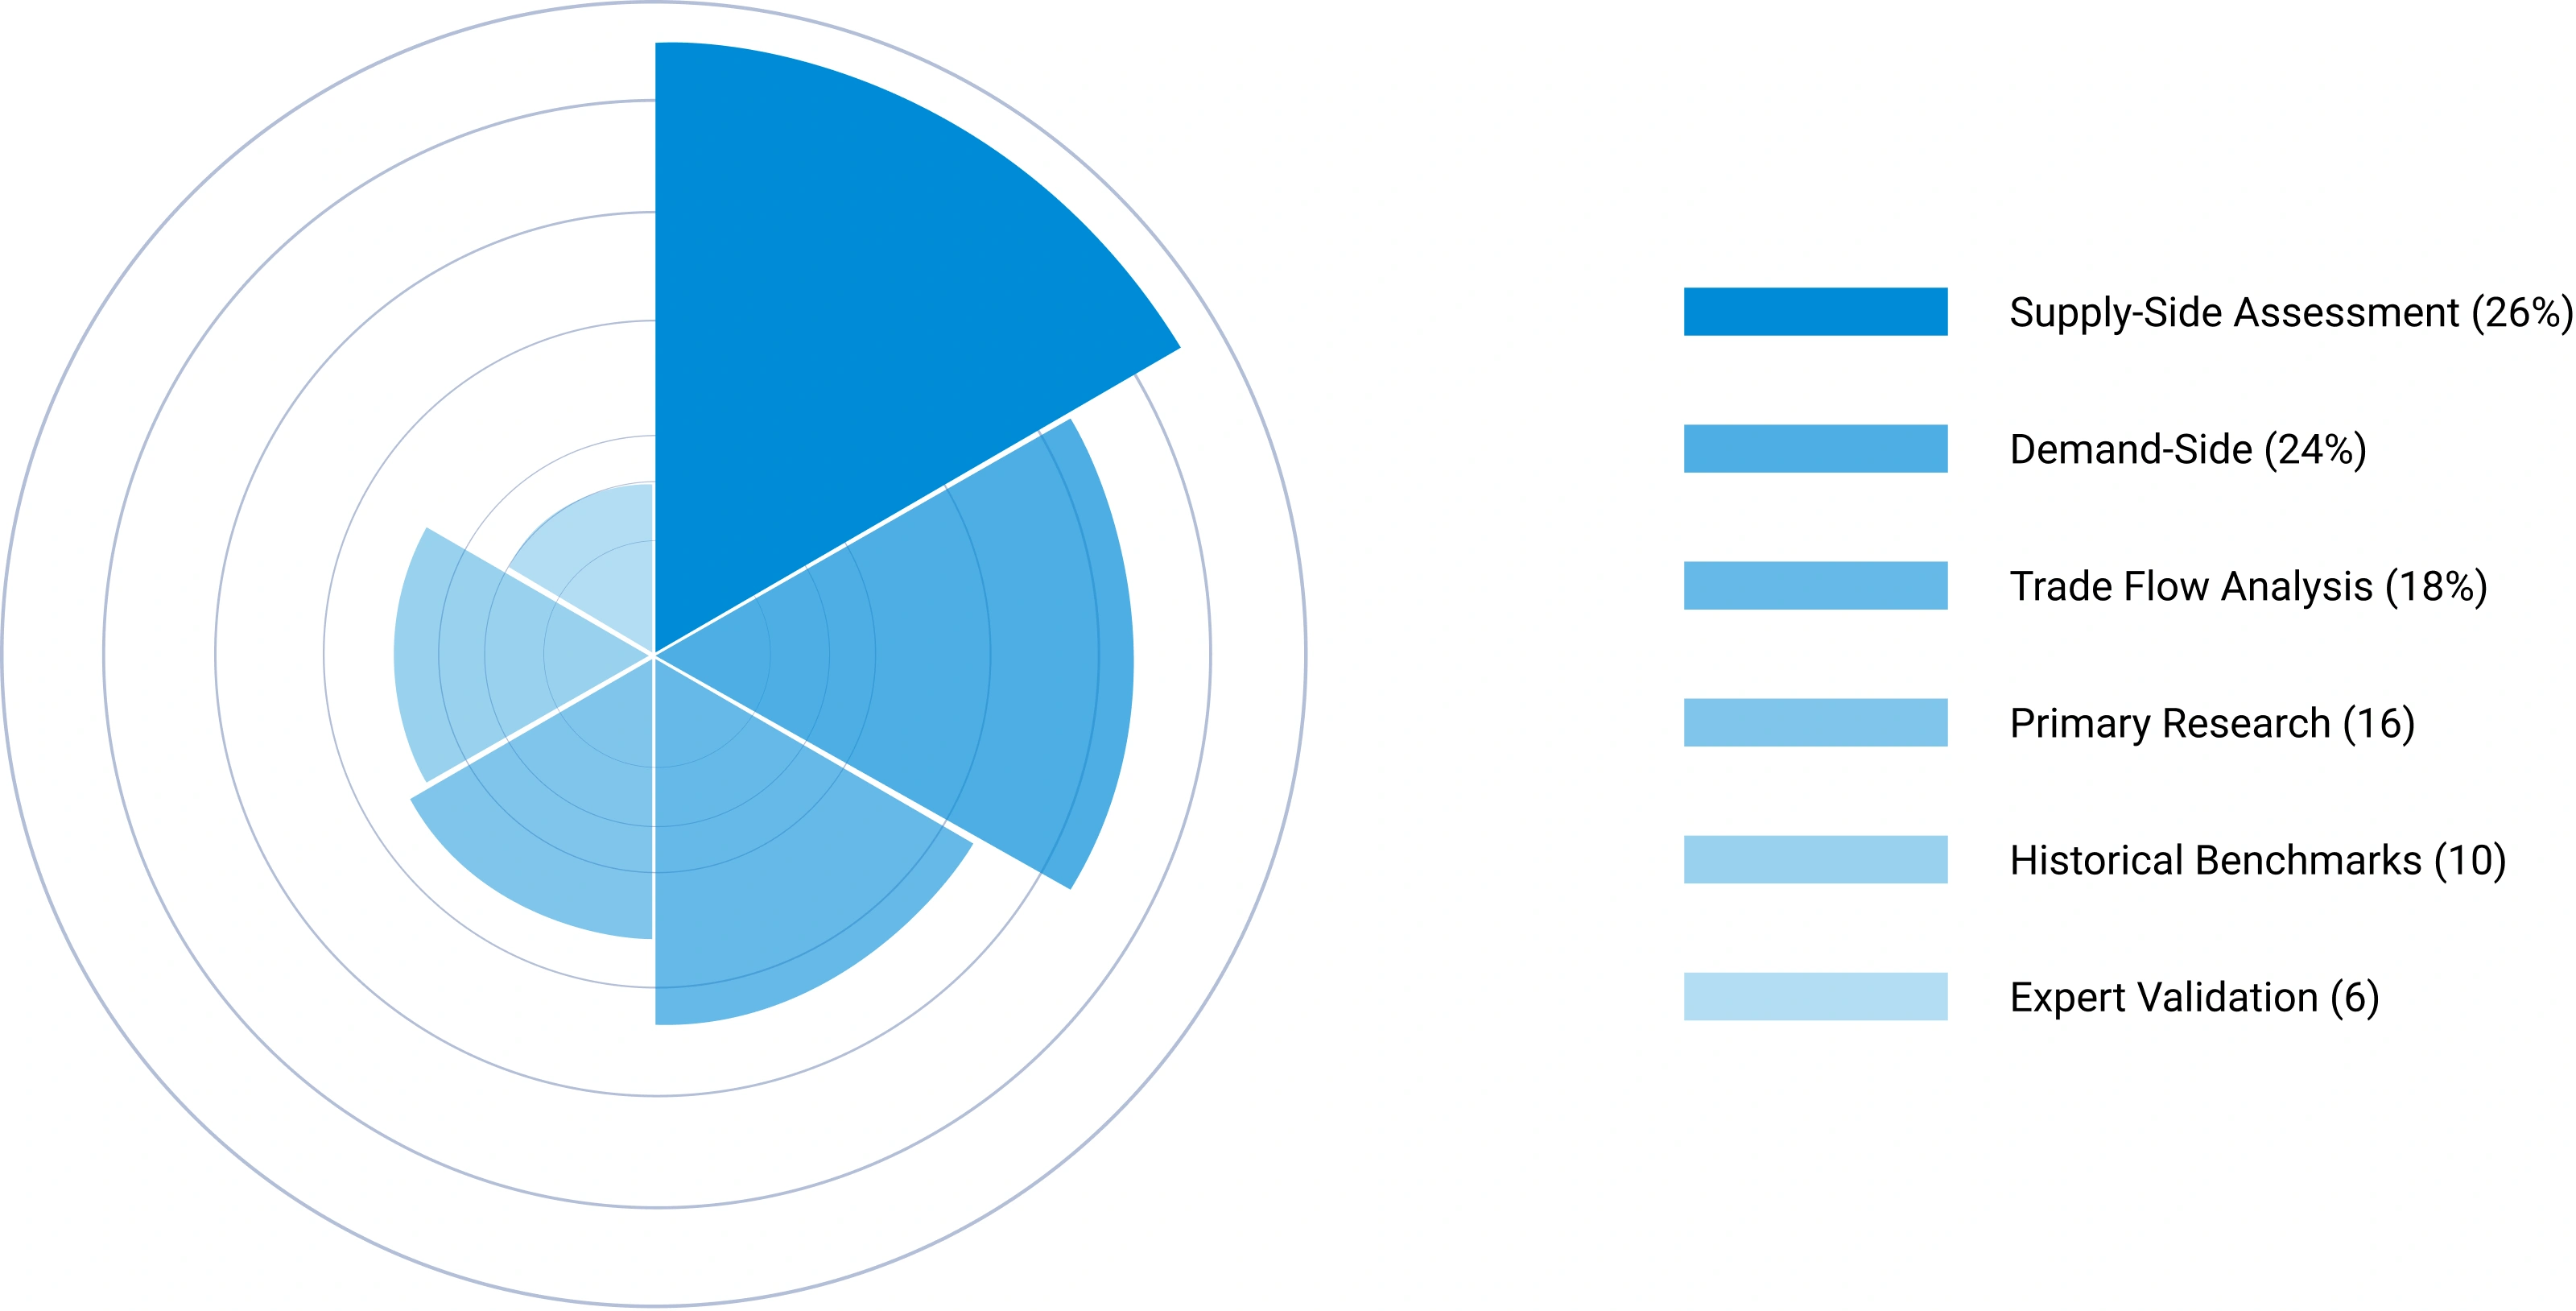
No single methodology is relied upon in isolation. Multiple independent estimation approaches are combined and reconciled to ensure consistency, accuracy, and analytical defensibility. Any material deviations between approaches are investigated and adjusted through additional validation cycles.
The final market size is derived through weighted triangulation of all validated methodologies. Any material deviations between approaches are investigated and adjusted through additional validation cycles. The outcome represents the most realistic assessment of the market based on available evidence and expert confirmation ensuring that volume and value estimates are fully consistent with one another.
Triangulation Framework — Input Contribution Weight
Relative weight each sizing input contributes to the final reconciled market estimate
Phase 7 — Forecast Modeling: Projecting Future Market Evolution
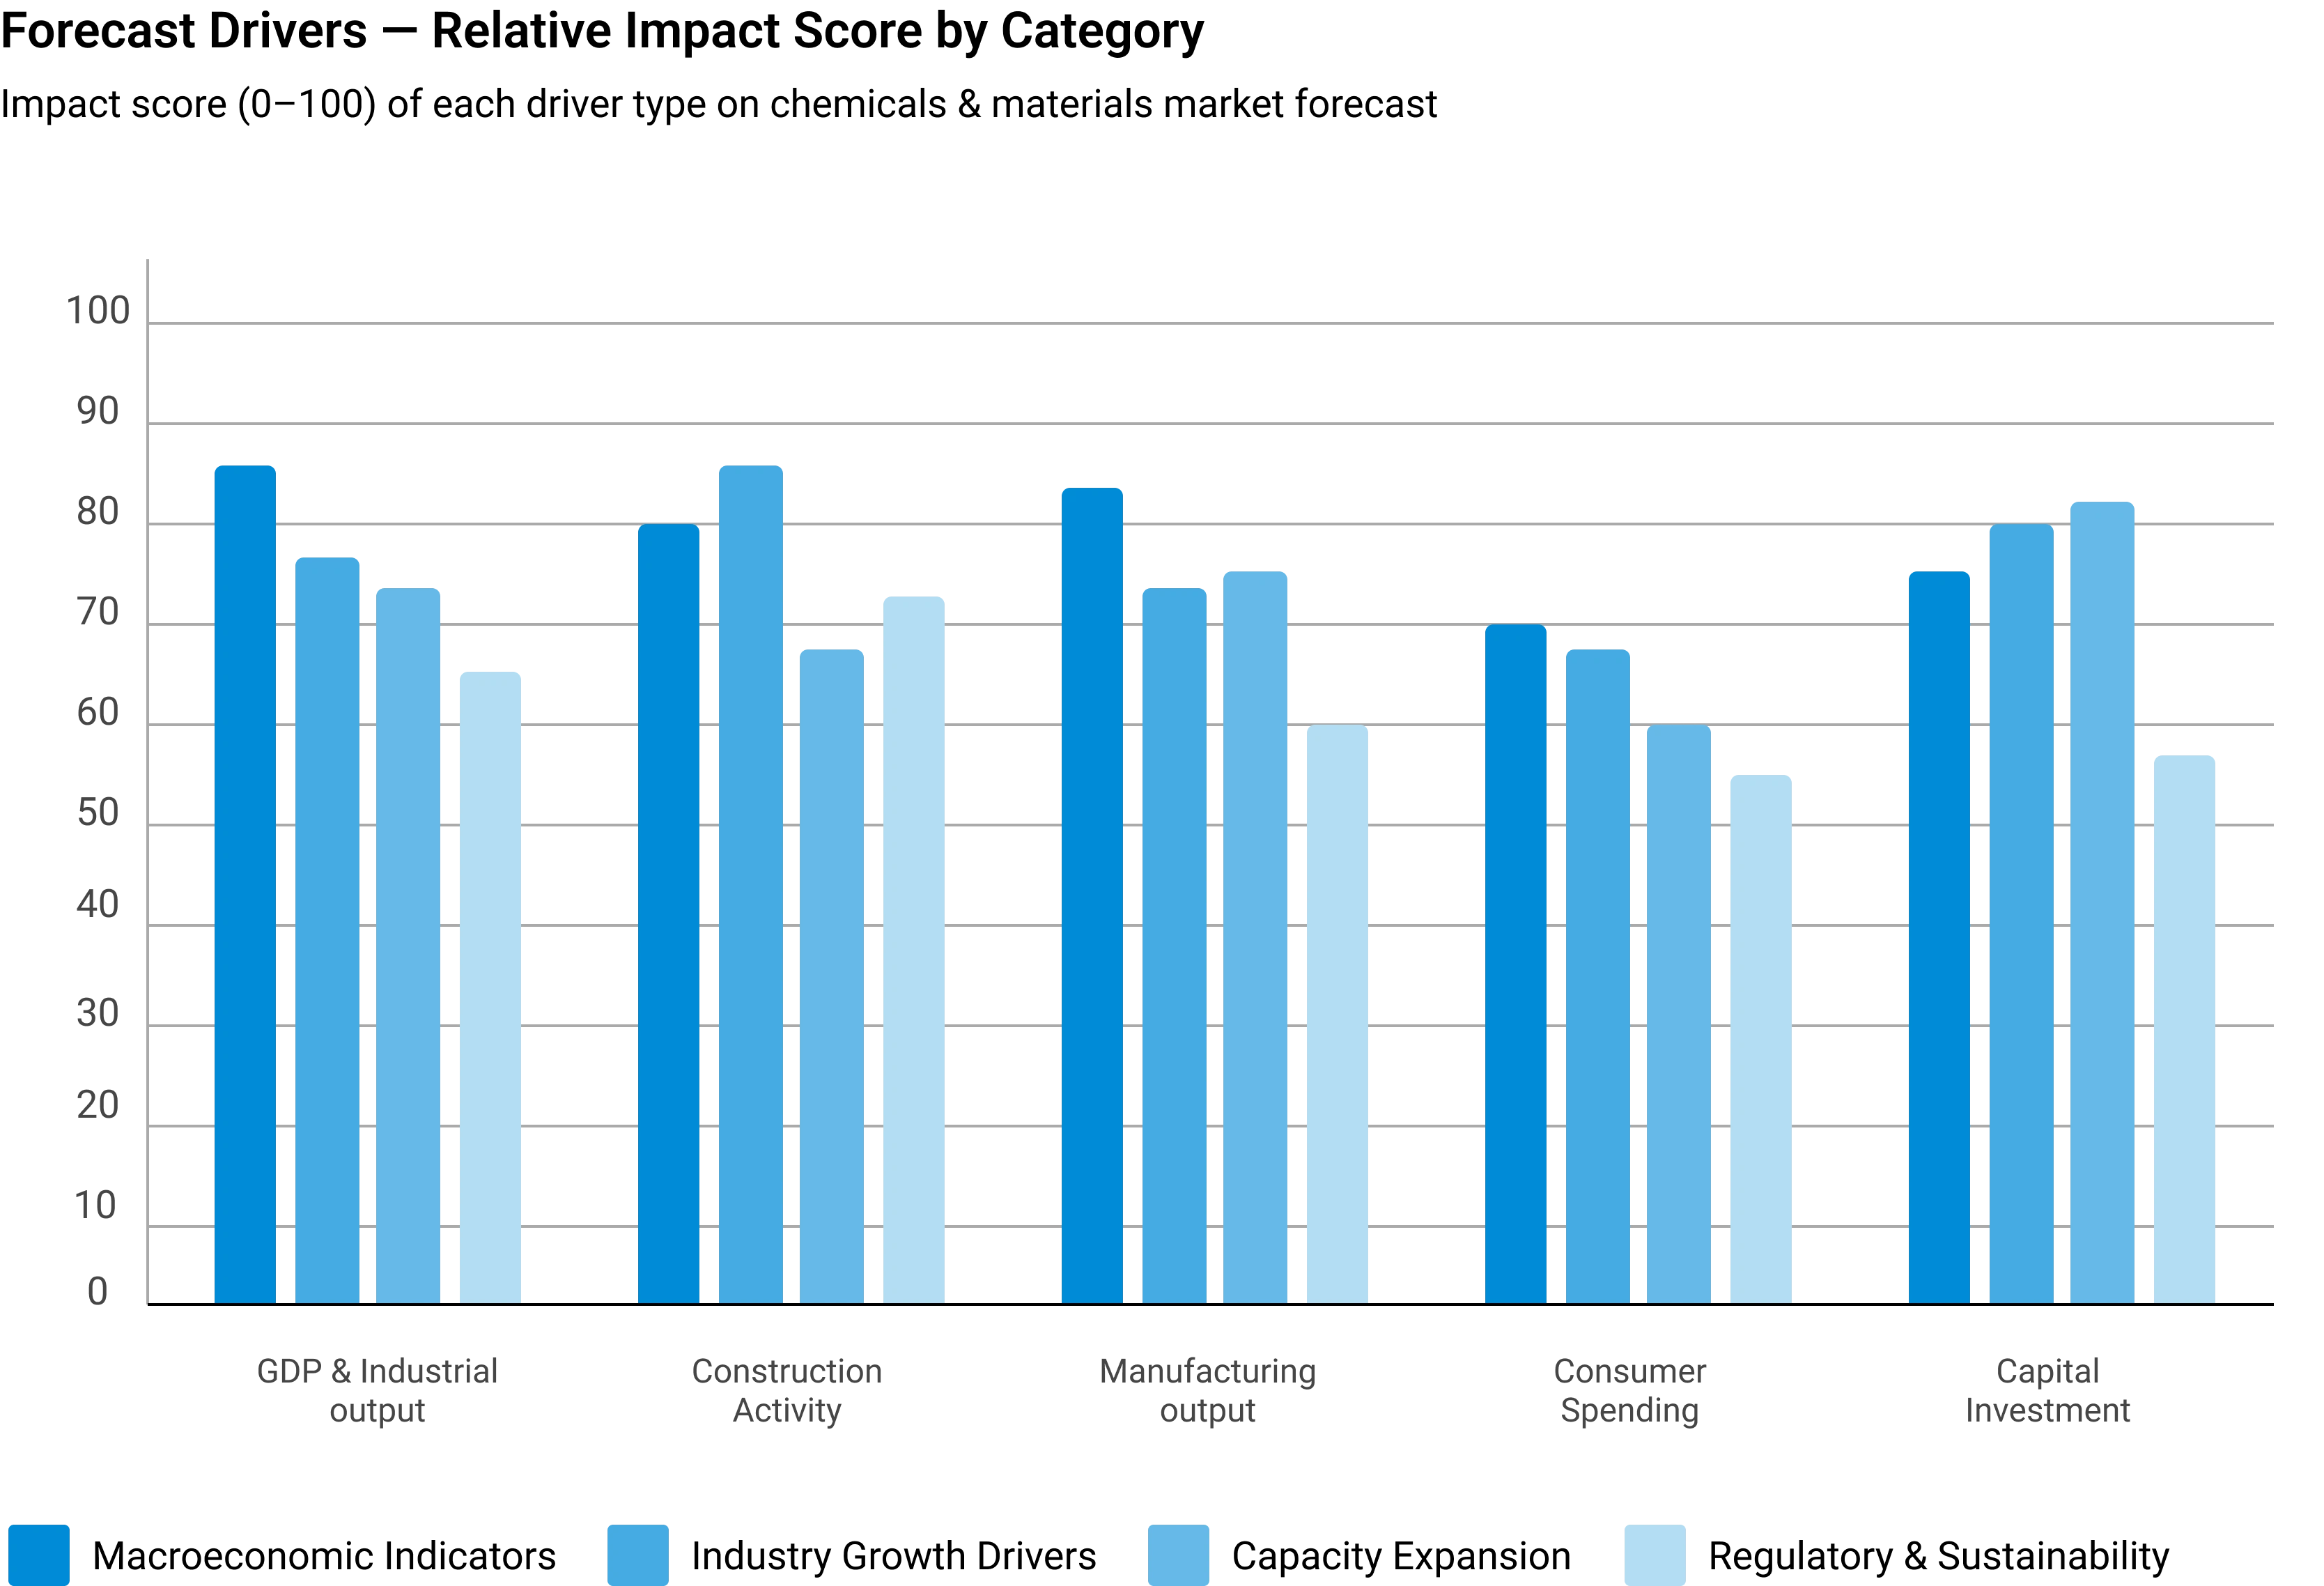
Forecasting evaluates the future trajectory of the market using a combination of quantitative indicators and qualitative assessments across economic, industry, and regulatory dimensions. Rather than simple extrapolation, each driver is independently modeled and integrated into a composite forecast.
Macroeconomic Indicators
GDP growth, industrial production, manufacturing output, construction activity, consumer spending, and capital investment form the quantitative foundation of long-term demand projections. These are applied at country, regional, and global levels.
Industry Growth Drivers
Urbanization, infrastructure development, industrialization, technological innovation, sustainability initiatives, and evolving product performance requirements are assessed at regional and industry levels — capturing both structural and cyclical demand drivers.
Capacity Expansion Analysis
Announced plant expansions, new manufacturing facilities, technology upgrades, and strategic investments are evaluated to determine future supply-demand dynamics and potential market tightness or oversupply situations.
Regulatory & Sustainability
Environmental regulations, chemical safety standards, emission reduction targets, circular economy initiatives, and sustainability requirements are incorporated as they often influence product adoption rates and market growth trajectories.
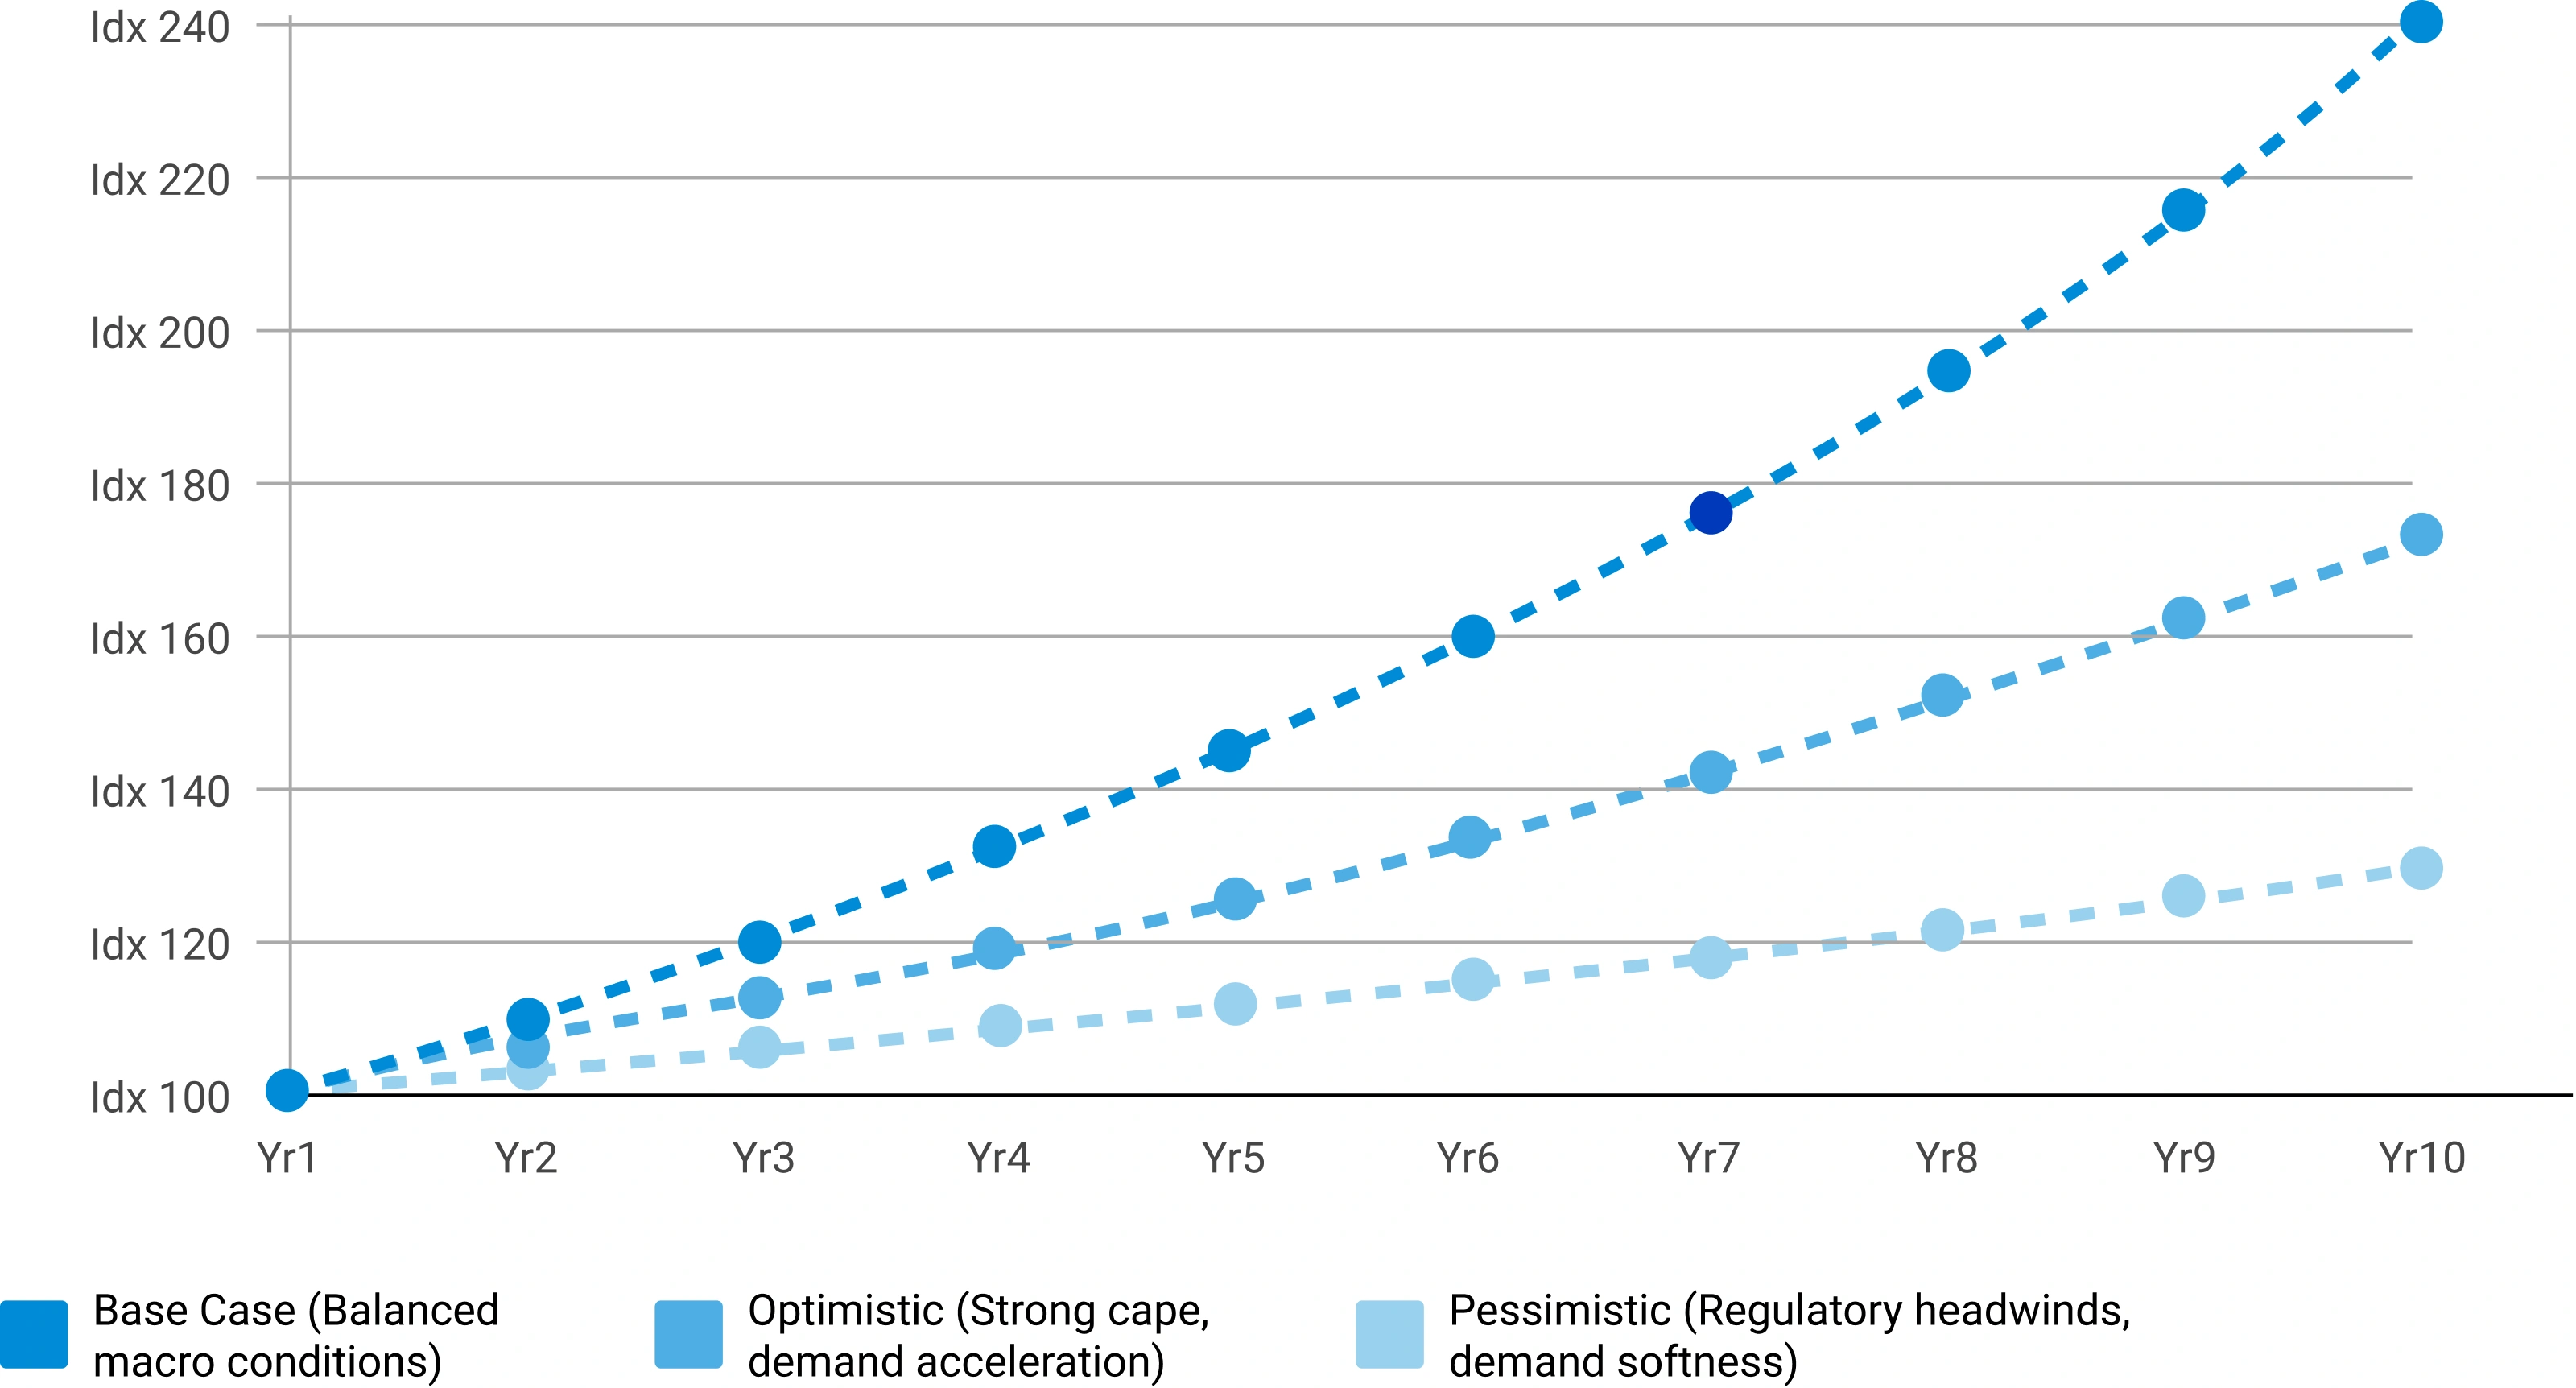
Scenario Forecast Range — Indexed Market Growth (Year 1–10)
Illustrative indexed growth trajectories across Base, Optimistic, and Pessimistic scenarios over a 10-year forecast horizon
Forecast Drivers — Relative Impact Score by Category
Impact score (0–100) of each driver type on chemicals & materials market forecast



Comments
Share your thoughts, ask a question, or provide feedback about this report.