
Point Of Entry Water Treatment Systems Market Size, Competitive Landscape Analysis Report 2035
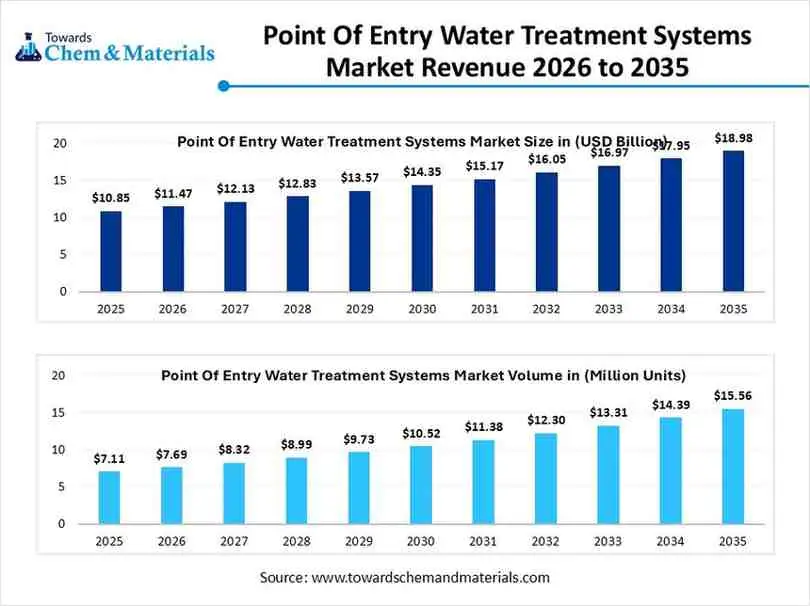
The global point of entry water treatment systems market size was estimated at USD 10.85 billion in 2025 and is expected to increase from USD 11.47 billion in 2026 to USD 18.98 billion by 2035, growing at a CAGR of 5.75% from 2026 to 2035. In terms of volume, the market is projected to grow from 7.11 million units in 2025 to 15.56 million units by 2035. growing at a CAGR of 8.15% from 2026 to 2035. North America dominated the point of entry water treatment systems market with the largest volume share of 33% in 2025.The increasing demand for whole-house filtration is the key factor driving market growth. Also, the ongoing integration of smart technology coupled with the stringent water safety regulations can fuel market growth further.
Market Highlights
- By region, North America dominated the market with 33% share in 2025. The dominance of the region can be attributed to the surge in residential and industrial construction.
By region, Asia Pacific held the second largest share of 29% in 2025. The growth of the region can be credited to rising health consciousness. - By technology, the filtration systems segment dominated the market with 33% share in 2025. The dominance of the segment can be attributed to the growing demand for whole house.
- By system type, the whole-house system segment dominated the market with 45% share in 2025. The dominance of the segment is owed to rising concerns regarding water contamination.
- By application, the residential segment dominated the market with 47% share in 2025. The dominance of the segment can be credited to the surge in demand for soft water.
- By distribution channel, the retail sales segment dominated the market with 36% share in 2025. The dominance of the segment is owing to the surge in awareness of contaminants.
What are Point of Entry Water Treatment Systems Market?
The market encompasses the technologies installed at the primary water supply line to treat all water entering a commercial or residential building. The market emphasises whole-house filtration, softening, and disinfection to effectively remove all contaminants to ensure safe and convenient access at every tap. Increasing concerns over water contamination and a surge in health awareness are driving market expansion.
Recent Market Trends
- The ongoing shift towards home automation is the latest trend in the market, shaping positive market growth. As many individuals are increasingly adopting smart home technologies, the demand for automated and integrated systems that improve convenience and operational efficiency is leading to the utilisation of water purification solutions.
- Increasing worries regarding contamination, water shortages, and environmental harm, both companies and individuals are rapidly adopting sustainable practices to reduce their overall environmental impact. Also, this system optimizes the reuse and recycling of water in businesses and homes.
- Technological innovations can fuel productivity and enhance efficiency, as technology can effectively process and automate various tasks. Techniques such as thermal hydrolysis can help in sorting and processing steps in waste management, while IoT sensors provide the necessary data for the process to carry out efficiently.
How Cutting-Edge Technologies Are Revolutionizing the Point Of Entry Water Treatment Systems Market?
Advanced technologies such as advanced membrane filtration, nanotechnology, and molecular adsorption techniques are transforming the market by providing higher efficiency, real-time monitoring, and smooth removal of contaminants. Furthermore, AI is being used to automate regeneration cycles and chemical dosing, substantially removing energy and water waste.
Trade Analysis of the Point Of Entry Water Treatment Systems Market: Import & Export Statistics
Based on Global Export Data for the twelve months (TTM) of July 2024 to June 2025, the world exported 762 shipments of Thymol, facilitated by 220 verified exporters and 313 buyers.
India, the U.S., and Indonesia are the world's primary importers of Thymol. On the export side, India with 2,250 shipments, followed by Germany with 714 shipments and the U.S. with 224 shipments are the top exporters.
In 2024, the major exporters of Disinfectants were China ($434M), Germany ($422M), and the United States ($422M). The leading importers were the United States ($292M), Germany ($280M), and France ($216M).
Exports
- In 2024, India ranked as the world's 20th largest exporter of hydrogen peroxide, with export values reaching $12.1 million.
- In 2024, the major destinations of India's Hydrogen peroxide exports were: Russia ($2.24M), United Arab Emirates ($2.11M), South Africa ($2M), Ghana ($1.11M), and Nigeria ($807k).
Imports
- India imported $15.8M of Hydrogen peroxide in 2024, making it the 21st largest importer globally.
- In 2024, India imported Hydrogen peroxide primarily from Bangladesh ($12.7M), Thailand ($2.24M), China ($298k), Belgium ($194k), and the United States ($161k).
Point Of Entry Water Treatment Systems Market Supply Chain Analysis
Feedstock Procurement
- It refers to the strategic sourcing and supply chain management of essential raw materials and components needed to produce, install, and maintain whole-house water purification units.
- Major Players: DuPont,3M
Chemical Synthesis and Processing
- It includes a specialized industrial application where high-grade water is crucial for chemical reactions, production efficiency, and regulatory compliance.
- Major Players: Veolia Water Technologies, Pentair plc
Packaging and Labelling
- It includes the standardized needs for the containment and detection of whole-house water treatment units, along with their replacement components.
- Major Players: DuPont Water Solutions, Culligan International
Regulatory Compliance and Safety Monitoring
- It involves adhering to stringent water quality standards to ensure contaminant removal, along with deploying smart IoT/SCADA sensors for real-time monitoring.
- Major Players: Coway Co., Ltd, Eureka Forbes
Point Of Entry Water Treatment Systems Market's Regulatory Landscape: Global Regulations
| Country/Region | Key Regulations |
| United States | The Environmental Protection Agency (EPA) sets legal limits for over 90 contaminants under the Safe Drinking Water Act (SDWA). While the EPA regulates public water systems. |
| European Union | The DWD introduced stricter limits for pollutants (e.g., lead, PFAS, microplastics) and established new hygienic requirements for materials in contact with drinking water. |
| China | Regulatory requirements are governed by the Standards for Drinking Water Quality (SDWQ), with the 2022 edition (GB 5749-2022) setting mandatory limits for 152 indices. |
Segmental Insights
Technology Insights
The Filtration Systems Segment Dominated The Market With 33% Share In 2025.
The filtration systems segment dominated the market with 33% share in 2025. The dominance of the segment can be attributed to the growing demand for whole-house and comprehensive filtration to address issues like chemical and heavy metal contamination. There is also a robust shift towards innovative membrane technologies.
The reverse osmosis (RO) segment held the second largest share of 23% in 2025. The growth of the segment can be credited to the rapid technological innovations in membrane efficiency and surges in awareness regarding waterborne diseases.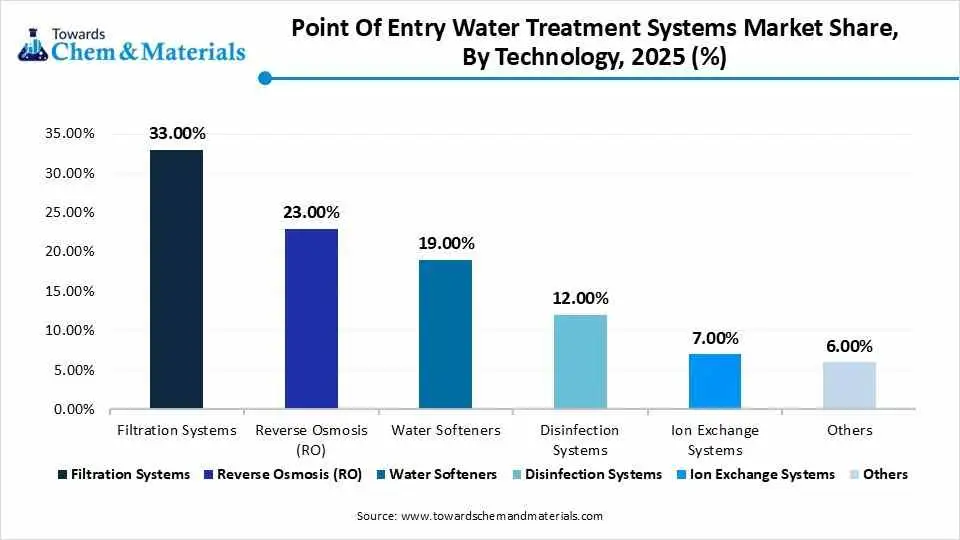
The water softeners segment held the third-largest share of 19% in 2025. The growth of the segment can be linked to the growing demand for treated water in commercial and residential applications, along with the strict water quality standards. Moreover, rapid infrastructure growth is also driving positive market growth.
The disinfection systems segment held the fourth largest share of 12% in 2025. The growth of the segment can be driven by growing awareness of health hazards and increasing demand for treated water in the food service and hospitality sectors for reliable and safe water supplies.
Point Of Entry Water Treatment Systems Market Share, By Technology, 2025 (%)
| By Technology | Revenue Share, 2025 (%) |
| Filtration Systems | 33.00% |
| Reverse Osmosis (RO) | 23.00% |
| Water Softeners | 19.00% |
| Disinfection Systems | 12.00% |
| Ion Exchange Systems | 7.00% |
| Others | 6.00% |
- Filtration systems lead the point of entry water treatment systems market with a 33.00% share in 2025, driven by their effectiveness in removing sediments, chlorine, and impurities from water. Their wide adoption in residential and commercial applications supports their dominant position.
- Reverse osmosis accounts for 23.00% of the market share in 2025, supported by its ability to remove dissolved solids, contaminants, and harmful substances at a high efficiency level. It is widely used where high-purity water is required.
- Water softeners hold a 19.00% share of the market in 2025, driven by their role in removing hardness-causing minerals such as calcium and magnesium. Increasing concerns about scaling and appliance efficiency are boosting demand.
- Disinfection systems capture 12.00% of the market share in 2025, supported by their ability to eliminate bacteria, viruses, and other microorganisms. Growing awareness of waterborne diseases is driving adoption in this segment.
- Ion exchange systems represent 7.00% of the market in 2025, as they are used for selective removal of ions and purification of water. These systems are commonly applied in industrial and specialized water treatment processes.
- Others account for 6.00% of the market share in 2025, covering emerging and niche technologies in water treatment. This segment includes advanced and hybrid solutions with growing but limited adoption.
System Type Insights
The Whole House System Segment Dominated The Market With 45% Share In 2025
The whole house system segment dominated the market with 45% share in 2025. The dominance of the segment is owing to rising concerns regarding water contamination, coupled with the growing construction of commercial spaces, smart buildings, and residential homes across the globe.The commercial system segment held the second largest share of 33% in 2025. The growth of the segment is due to the increasing need for safe and high-value water for sanitization, along with the rising concerns regarding PFAS exposure risks.
The industrial segment held the third largest share of 22% in 2025. The dominance of the segment can be attributed to the rise in demand for high-grade process water in the pharmaceuticals and manufacturing sectors. Major industrial operators are also heavily investing in POE technologies to prevent corrosion.
Point Of Entry Water Treatment Systems Market Share, By System Type, 2025 (%)
| By System Type | Revenue Share, 2025 (%) |
| Whole House Systems | 45.00% |
| Commercial Systems | 33.00% |
| Industrial Systems | 22.00% |
- Whole house systems lead the point of entry water treatment systems market with a 45.00% share in 2025, driven by increasing demand for clean and safe water across entire residential properties. These systems provide comprehensive filtration and treatment at the entry point, ensuring water quality throughout the household.
- Commercial systems account for 33.00% of the market share in 2025, supported by the need for reliable water treatment solutions in establishments such as hotels, offices, and healthcare facilities. Growing awareness of water quality standards is driving adoption in this segment.
- Industrial systems hold a 22.00% share of the market in 2025, driven by the requirement for large-scale water treatment in manufacturing and processing industries. These systems are essential for maintaining operational efficiency and meeting regulatory standards.
Application Insights
The Residential Segment Dominated The Market With 47% Share In 2025
The residential segment dominated the market with 47% share in 2025. The dominance of the segment can be credited to the surge in demand for soft water and increasing awareness regarding waterborne diseases. The incorporation of smart home technologies and IoT allows predictive maintenance.
The commercial segment held the second largest share of 31% in 2025. The growth of the segment can be linked to the increasing popularity of smart water treatment solutions that provide predictive maintenance and real-time monitoring.
The industrial segment held the third largest share of 22% in 2025. The growth of the segment can be driven by increasing demand to safeguard production infrastructure from hard water damage, along with the rising integration of smart monitoring and energy-efficient systems.
Point Of Entry Water Treatment Systems Market Share, By Application 2025 (%)
| By Application | Revenue Share, 2025 (%) |
| Residential | 47.00% |
| Commercial | 31.00% |
| Industrial | 22.00% |
- Residential applications lead the point of entry water treatment systems market with a 47.00% share in 2025, driven by rising awareness about water quality and health concerns among households. Increasing adoption of whole-house filtration systems is supporting strong demand in this segment.
- Commercial applications account for 31.00% of the market share in 2025, supported by the need for safe and treated water in establishments such as hotels, offices, and healthcare facilities. Compliance with water quality standards is a key factor driving growth.
- Industrial applications hold a 22.00% share of the market in 2025, driven by the requirement for large-scale water treatment in manufacturing and processing industries. These systems help ensure operational efficiency and adherence to regulatory requirements.
Distribution Channel Insights
The Retail Sales Segment Dominated The Market With 36% Share In 2025
The retail sales segment dominated the market with 36% share in 2025. The dominance of the segment is owed to the surge in awareness of contaminants such as PFAS and the rapid adoption of smart technology. Also, there is an increasing consumer preference for sustainable water treatment technologies.The direct sales segment held the second-largest share of 35% in 2025. The growth of the segment is due to growing demand for smart, tailored, and sustainable water solutions, coupled with the surge in online sales channels.
The distributors & dealers segment held the third largest share of 29% in 2025. The growth of the segment can be attributed to the surge in demand for whole-house treatment and increasing groundwater contamination. POE systems need whole-house plumbing installations for setup.
Point Of Entry Water Treatment Systems Market Share, By Distribution Channel 2025 (%)
| By Distribution Channel | Revenue Share, 2025 (%) |
| Direct Sales | 35.00% |
| Retail Sales | 36.00% |
| Distributors & Dealers | 29.00% |
- Retail sales lead the point of entry water treatment systems market with a 36.00% share in 2025, driven by easy product availability through stores and growing consumer preference for direct purchasing. The expansion of organized retail and e-commerce platforms further supports this segment.
- Direct sales account for 35.00% of the market share in 2025, supported by customized solutions and direct engagement between manufacturers and customers. This channel is widely used for large-scale residential and commercial installations.
- Distributors & dealers hold a 29.00% share of the market in 2025, driven by their strong network and ability to reach a wide customer base. They play a key role in product availability, after-sales service, and regional market penetration.
By Contaminant Removal
The point of entry (POE) water treatment systems market, segmented by contaminant removal, is led by hardness removal, accounting for approximately 25% share, making it the dominant segment. This is primarily driven by widespread issues related to hard water especially in regions relying on groundwater which increases demand for water softeners to prevent scaling, protect plumbing systems, and improve appliance efficiency . The chemical removal segment follows with around 23% share and represents the fastest-growing segment, supported by rising concerns over chemical contaminants such as chlorine, heavy metals, and industrial pollutants, along with stricter water quality regulations and increasing health awareness.
The biological removal segment holds a significant share, driven by the need to eliminate bacteria, viruses, and other pathogens, particularly in regions facing waterborne disease risks. Sediment removal is also widely adopted as a primary filtration step to remove suspended particles like sand, rust, and silt, ensuring the efficiency of downstream treatment systems. Meanwhile, the others category, including advanced and multi-stage filtration technologies, is gradually expanding as consumers and industries seek comprehensive, all-in-one water purification solutions. Overall, while hardness removal dominates due to its universal necessity, growth momentum is increasingly shifting toward chemical and biological treatment solutions amid rising water contamination concerns globally.
Point Of Entry Water Treatment Systems Market Share, By Distribution Channel 2025 (%)
| By Distribution Channel | Revenue Share, 2025 (%) |
| Direct Sales | 35.00% |
| Retail Sales | 36.00% |
| Distributors & Dealers | 29.00% |
- Retail sales hold the largest share of the point of entry water treatment systems market at 36.00% in 2025, driven by widespread availability of products through physical stores and online platforms. Increasing consumer preference for convenient and quick purchasing options is supporting this segment.
- Direct sales account for 35.00% of the market share in 2025, supported by personalized solutions and direct interaction between manufacturers and end users. This channel is particularly important for customized installations in residential and commercial settings.
- Distributors & dealers represent 29.00% of the market in 2025, driven by their extensive distribution networks and strong regional presence. They play a crucial role in product accessibility, customer support, and after-sales services.
Regional Insights
How did North America Dominate the Point Of Entry Water Treatment Systems Market in 2025?
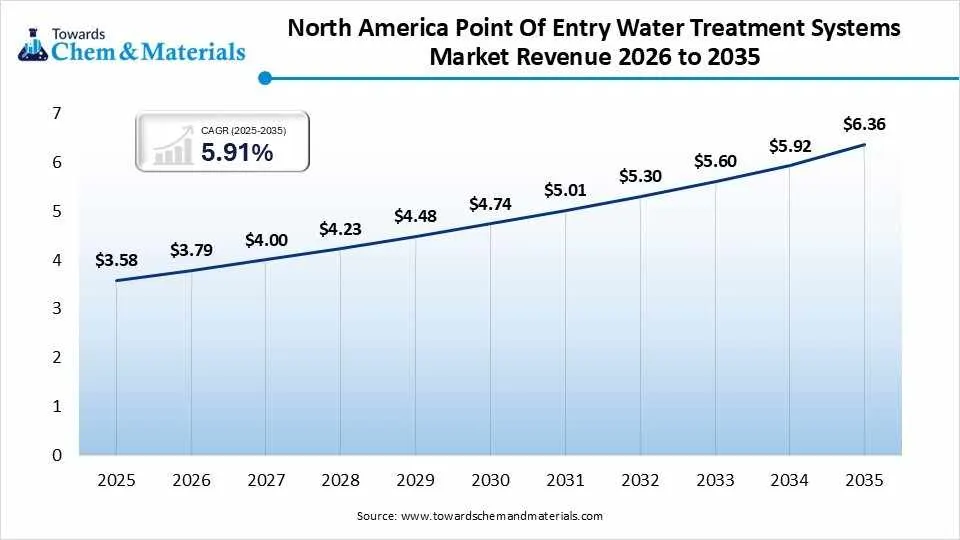
The North America Point Of Entry Water Treatment Systems Market size was valued at USD 3.58 billion in 2025 and is expected to be worth around USD 6.36 billion by 2035, exhibiting at a compound annual growth rate (CAGR) of 5.91% over the forecast period from 2026 to 2035.North America dominated the market with 33% share in 2025. The dominance of the region can be attributed to the surge in residential and industrial construction and the growing adoption of smart filtration technology. In addition, stringent regulations by major government agencies regarding water safety and quality standards are boosting the adoption of compliant and advanced POE systems.
U.S. Point Of Entry Water Treatment Systems Market Trends
The growth of the market in the country is due to rising concerns over water contamination, a surge in health awareness, and aging infrastructure. Also, increasing awareness about the adverse effects of hard water on health, appliances, and plumbing fuels the adoption of filtration systems and water softeners, leading to market growth soon.
Asia Pacific Point Of Entry Water Treatment Systems Market Trends
Asia Pacific held the second largest share of 29% in 2025. The growth of the region can be credited to rising health consciousness, increasing water pollution, especially among emerging economies such as China and India. Furthermore, a surge in awareness regarding waterborne diseases and increasing disposable incomes has enabled consumers to invest heavily in household water quality.
Point Of Entry Water Treatment Systems Market Share, By Regional, 2025 (%)
| Regional | Revenue Share, 2025 (%) |
| North America | 33.00% |
| Asia-Pacific | 29.00% |
| Europe | 20.00% |
| Latin America | 10.00% |
| Middle East & Africa | 8.00% |
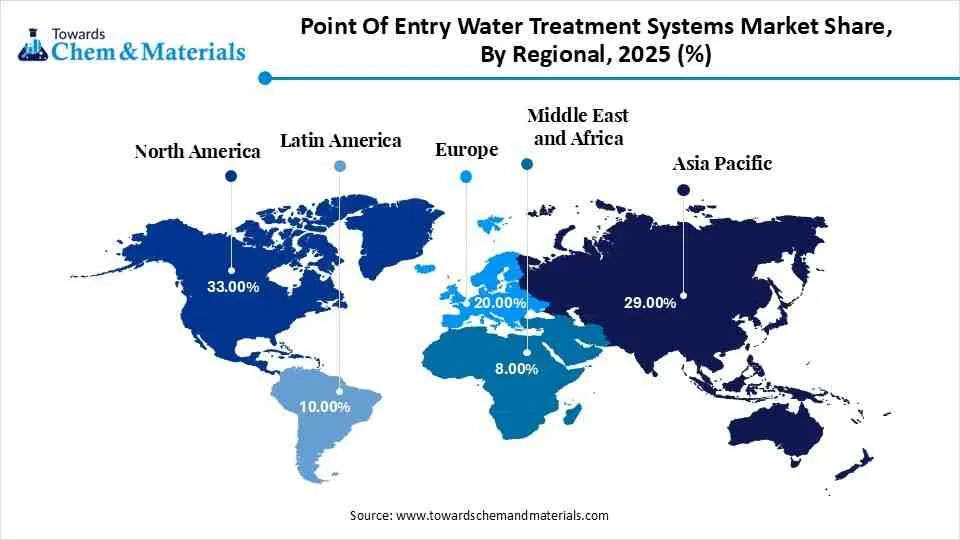
- North America leads the point of entry water treatment systems market with a 33.00% share in 2025, driven by high awareness of water quality and advanced infrastructure. Strong adoption across residential and commercial sectors supports continued market growth in the region.
- Asia-Pacific accounts for 29.00% of the market share in 2025, supported by rapid urbanization and increasing concerns over water contamination. Rising population and industrial activities are further driving demand for water treatment solutions.
- Europe holds a 20.00% share of the market in 2025, driven by strict environmental regulations and growing focus on sustainable water management. The region benefits from well-established infrastructure and increasing adoption of advanced treatment technologies.
- Latin America represents 10.00% of the market share in 2025, supported by improving access to clean water and growing investment in water infrastructure. The region is witnessing steady adoption across residential and commercial applications.
- Middle East & Africa capture 8.00% of the market in 2025, driven by water scarcity issues and increasing reliance on treatment systems. Growing infrastructure development and awareness are contributing to market expansion.
China Point Of Entry Water Treatment Systems Market Trends
In the Asia Pacific, China dominated the market owing to the ongoing urbanisation, growing disposable income for premium household appliances, and the surge in e-commerce sales. Moreover, sectors like semiconductor and electronics manufacturing necessitate ultra-pure water for production, propelling demand for innovative industrial-grade POE systems.
Recent Development
- In March 2026, VA Tech Wabag secured a "large" EPC contract to construct a 19 MLD Wastewater Treatment Plant (WWTP) in Kutaisi, Georgia. Funded by the European Investment Bank (EIB), this project involves developing a modern wastewater and sludge treatment facility, marking a significant entry into the Georgian market for the company.(Source:www.cnbctv18.com)
Point-of-Entry (POE) Water Treatment Systems Market Competitive Landscape Analysis
Tier 1 Companies
|
Rank
|
Company Name | Headquarters | Country | Why Relevant to This Market | Key Products / Material Portfolio |
| 1 | A. O. Smith Corporation | Milwaukee, Wisconsin | United States | Global leader in residential and commercial POE water treatment with an extensive distribution network | Whole-house water filters, water softeners, carbon filtration systems, UV treatment systems |
| 2 | Pentair plc | London, England | United Kingdom | One of the world's largest suppliers of whole-house water filtration and softening systems | POE filtration systems, water softeners, sediment filters, UV disinfection systems |
| 3 | Culligan International Company | Rosemont, Illinois | United States | Leading provider of residential and commercial point-of-entry water treatment solutions | Whole-house filtration systems, water softeners, iron filters, UV purification systems |
| 4 | 3M Company | Saint Paul, Minnesota | United States | Major supplier of advanced filtration technologies for residential and commercial water treatment | Whole-house filtration systems, sediment filters, activated carbon filters |
| 5 | Ecolab Inc. | Saint Paul, Minnesota | United States | Global provider of commercial and industrial water treatment technologies with strong POE offerings | Water filtration systems, scale control systems, commercial water treatment solutions |
Tier 2 Companies
|
Rank
|
Company Name | Headquarters | Country | Why Relevant to This Market | Key Products / Material Portfolio |
| 1 | Watts Water Technologies, Inc. | North Andover, Massachusetts | United States | Well-established supplier of residential and commercial whole-house water treatment systems | Water softeners, filtration systems, scale prevention systems |
| 2 | Veolia Water Technologies | Paris | France | Global provider of advanced water treatment systems for commercial and industrial facilities | Multimedia filtration, activated carbon systems, UV treatment systems |
| 3 | Xylem Inc. | Washington, D.C. | United States | Strong portfolio of water purification and treatment solutions for residential and commercial applications | Filtration systems, UV disinfection systems, water treatment technologies |
| 4 | Kinetico Incorporated | Newbury, Ohio | United States | Specialist in premium non-electric whole-house water treatment systems | Water softeners, whole-house filters, iron removal systems |
| 5 | Canature Health Technology Group Co., Ltd. | Tangshan, Hebei | China | Major manufacturer of residential and commercial POE water treatment systems | Water softeners, filtration systems, control valves, whole-house treatment units |
Tier 3 Companies
|
Rank
|
Company Name | Headquarters | Country | Why Relevant to This Market | Key Products / Material Portfolio |
| 1 | EcoWater Systems LLC | Woodbury, Minnesota | United States | Established manufacturer specializing in residential whole-house water treatment | Water softeners, whole-house filtration systems, reverse osmosis systems |
| 2 | SpringWell Water Filtration Systems | Orlando, Florida | United States | Fast-growing supplier focused on residential POE filtration solutions | Whole-house filters, salt-free water softeners, UV systems |
| 3 | Aquasana, Inc. | Austin, Texas | United States | Well-known provider of residential whole-house filtration and conditioning systems | Whole-house filtration systems, carbon filters, UV purification systems |
| 4 | BWT Holding GmbH | Mondsee, Upper Austria | Austria | European leader in residential and commercial water treatment technologies | Water softeners, filtration systems, mineralization systems |
| 5 | Hellenbrand, Inc. | Waunakee, Wisconsin | United States | Specialized manufacturer of residential and light commercial POE systems | Water softeners, iron filters, whole-house filtration systems |
Point Of Entry Water Treatment Systems Market Companies
- 3M:3M is a prominent, leading player in the global Point of Entry (POE) water treatment systems market, providing comprehensive whole-house filtration and softening solutions. Known for innovation, 3M focuses on reducing contaminants like chlorine, lead, and sediment.
- DuPont: DuPont Water Solutions is a market-leading provider in the Point Of Entry (POE) water treatment systems sector, offering a comprehensive portfolio of filtration, purification, and separation technologies.
- Pentair plc
- BWT Holding GmbH
- Culligan
- Watts
- Veolia
- Calgon Carbon Corporation
- EcoWater Systems LLC
- Watch Water
- O. Smith
- Haier Smart Home (GE Appliances)
- Xylem
- Newterra
- Filtrine
Point Of Entry Water Treatment Systems Market Segments List
By Technology
- Filtration Systems
- Reverse Osmosis RO
- Water Softeners
- Disinfection Systems
- Ion Exchange Systems
- Others
By System Type
- Whole House Systems
- Commercial Systems
- Industrial Systems
By Application
- Residential
- Commercial
- Industrial
By Contaminant Removal
- Hardness Removal
- Chemical Removal
- Biological Removal
- Sediment Removal
- Others
By Distribution Channel
- Direct Sales
- Retail Sales
- Distributors & Dealers
By Regions
- North America
- U.S.
- Canada
- Mexico
- Europe
- Germany
- UK
- France
- Italy
- Spain
- Asia Pacific
- China
- India
- Japan
- South Korea
- Latin America
- Brazil
- Argentina
- Middle East & Africa
- Saudi Arabia
- South Africa
A Seven-Phase Framework
Our methodology is designed to be universally applicable across commodity chemicals, specialty chemicals, petrochemicals, construction chemicals, coatings, electronic chemicals, industrial gases, agrochemicals, water treatment chemicals, and performance materials. Each phase builds upon the last, creating a layered validation structure that minimizes estimation error and maximizes analytical confidence.
The framework ensures comprehensive market coverage, robust cross-validation, and reliable long-term forecasting — producing market estimates that withstand scrutiny from investors, regulators, and corporate strategy teams.

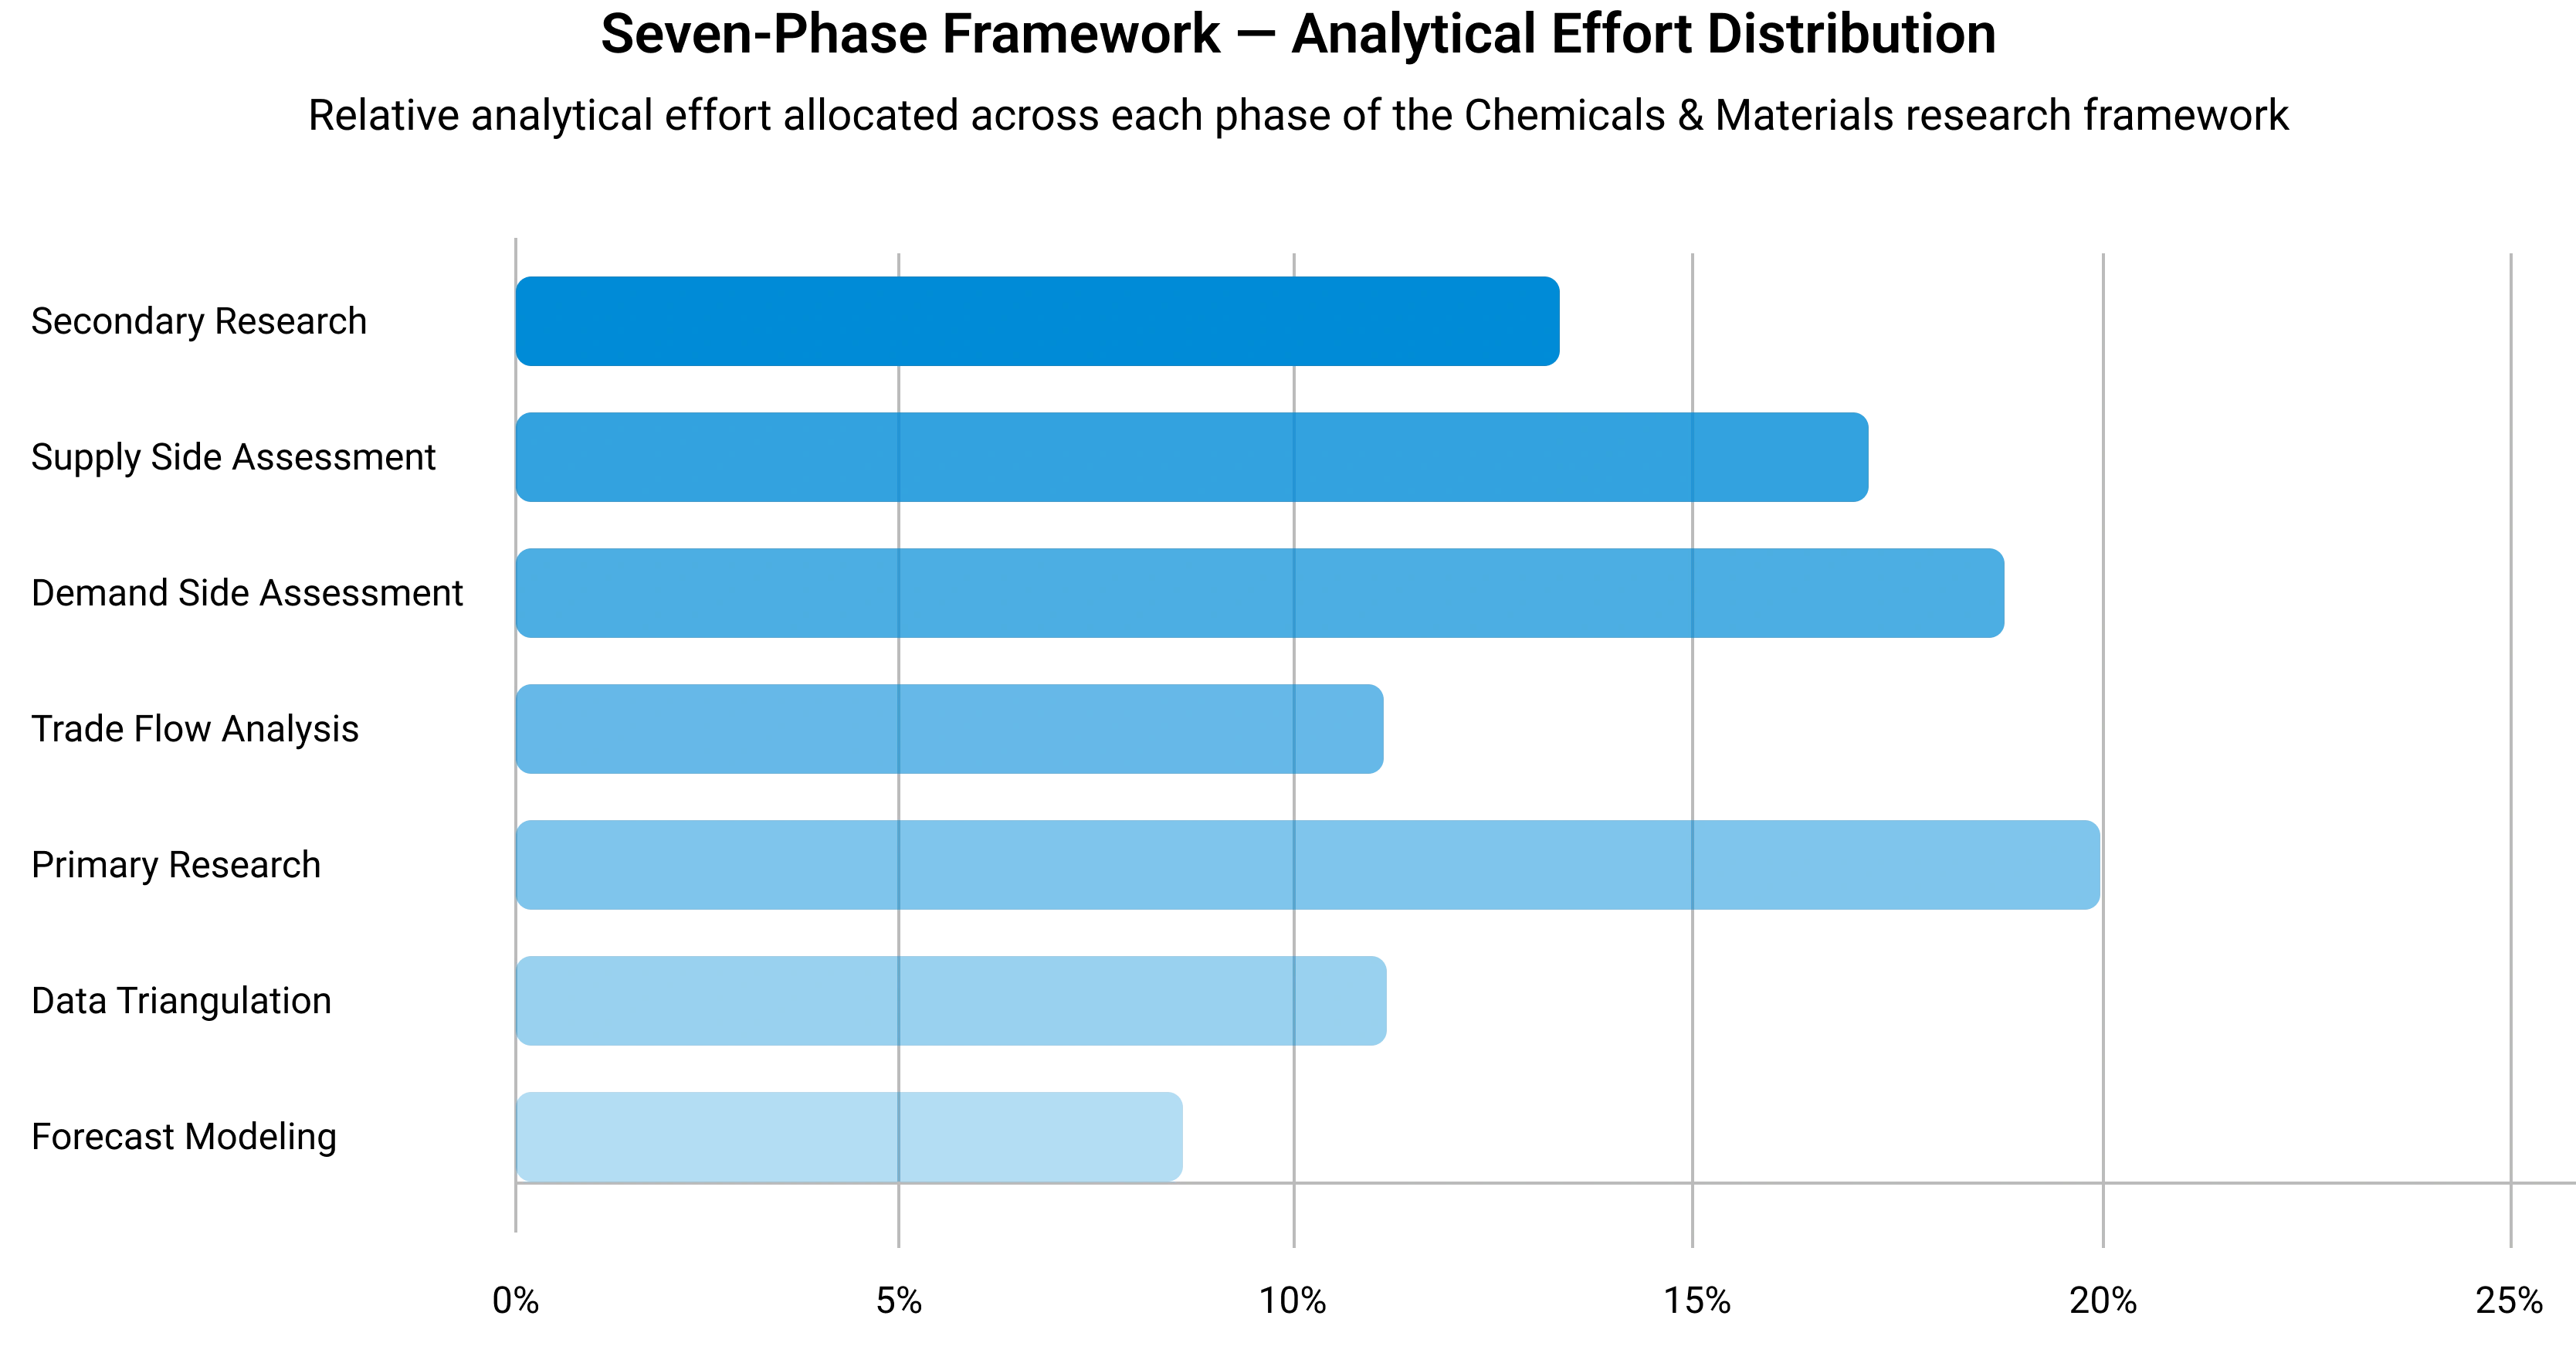
Seven-Phase Framework — Analytical Effort Distribution
Relative analytical effort allocated across each phase of the Chemicals & Materials research framework
Phase 1 - Secondary Research: Establishing the Foundation
Secondary research collects and evaluates publicly available information from authoritative sources, establishing the foundational understanding of market structure, value chain dynamics, competitive landscape, and end-use demand patterns. Every source is evaluated for credibility, recency, geographic relevance, and methodological soundness before inclusion.
Industry Associations
Sources include ACC, CEFIC, ICCA, JCIA, CPCIF, and SOCMA providing production volumes, consumption trends, capacity developments, and sustainability initiatives.
Company Disclosures
Annual reports, investor presentations, earnings transcripts, and regulatory filings reveal product portfolios, manufacturing footprints, capacity expansions, and revenue segmentation.
Government Databases
National statistical offices, customs authorities, environmental agencies, and industrial production databases provide verified statistics on output, trade flows, and regulatory compliance.
Trade Databases
UN Comtrade, ITC, Eurostat, and national customs authorities enable assessment of global product movement, import dependency, and export competitiveness across regions.
Our Secondary Research Sources
- Ministry of Chemicals and Fertilizers
- European Chemicals Agency
- United States Department of Energy
- Ministry of Industry and Information Technology
- Ministry of Economy Trade and Industry
- Ministry of Trade Industry and Energy
- National Institute of Standards and Technology
- Council of Scientific and Industrial Research
- Fraunhofer Society
- National Institute for Materials Science
Phase 2 — Supply-Side Assessment: Mapping Production Capabilities
Production Capacity Analysis
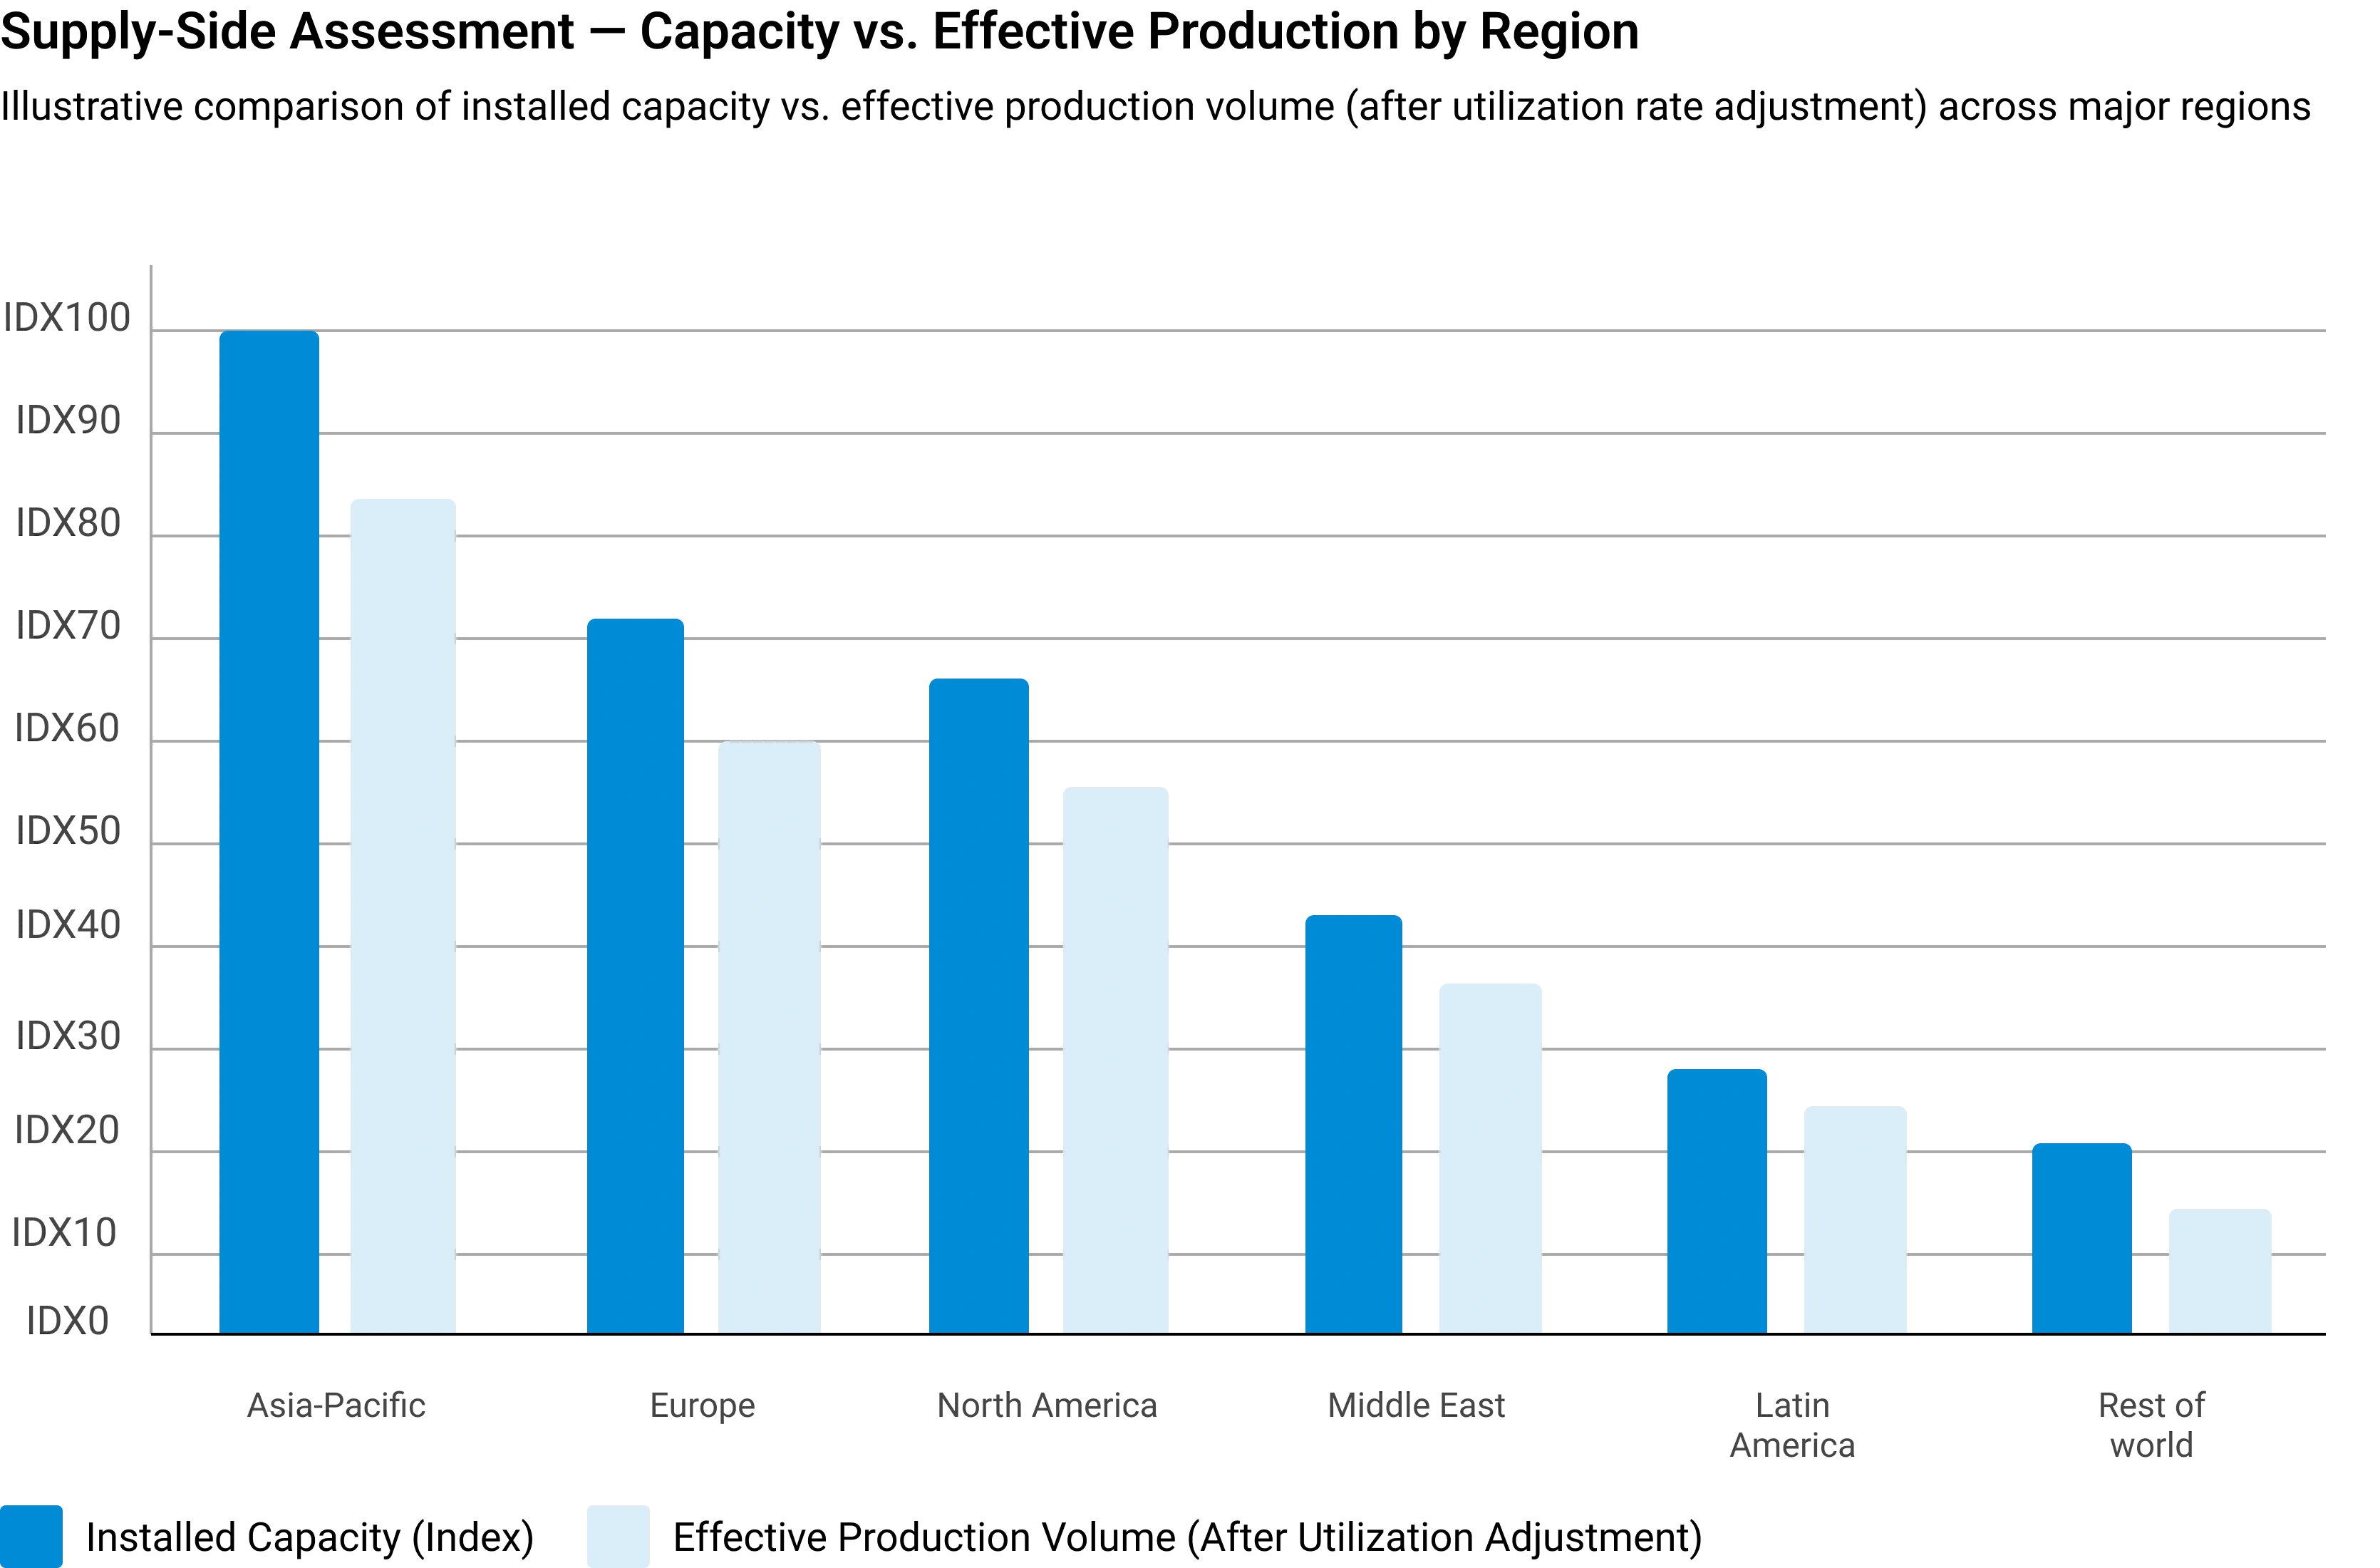
All major manufacturers are assessed for existing installed capacity, planned additions, expansions, new plant announcements, and technology adoption — mapped at global, regional, and country levels.
Capacity Utilization Adjustment
Installed capacity is adjusted using utilization rates based on demand conditions, feedstock availability, plant operating rates, maintenance schedules, and regulatory restrictions.
Manufacturer Revenue Analysis
Product-specific revenues, segment-level performance, regional distribution, average selling prices, and margin trends are evaluated to establish market value estimates.
Supply-Side Assessment — Capacity vs. Effective Production by Region
Illustrative comparison of installed capacity vs. effective production volume (after utilization rate adjustment) across major regions
Phase 3 — Demand-Side Assessment: Quantifying Chemical Consumption
Demand-side analysis quantifies chemical consumption across industries, applications, and geographies — identifying where and how chemicals are consumed throughout the value chain with precision.
End-Use Industry Analysis
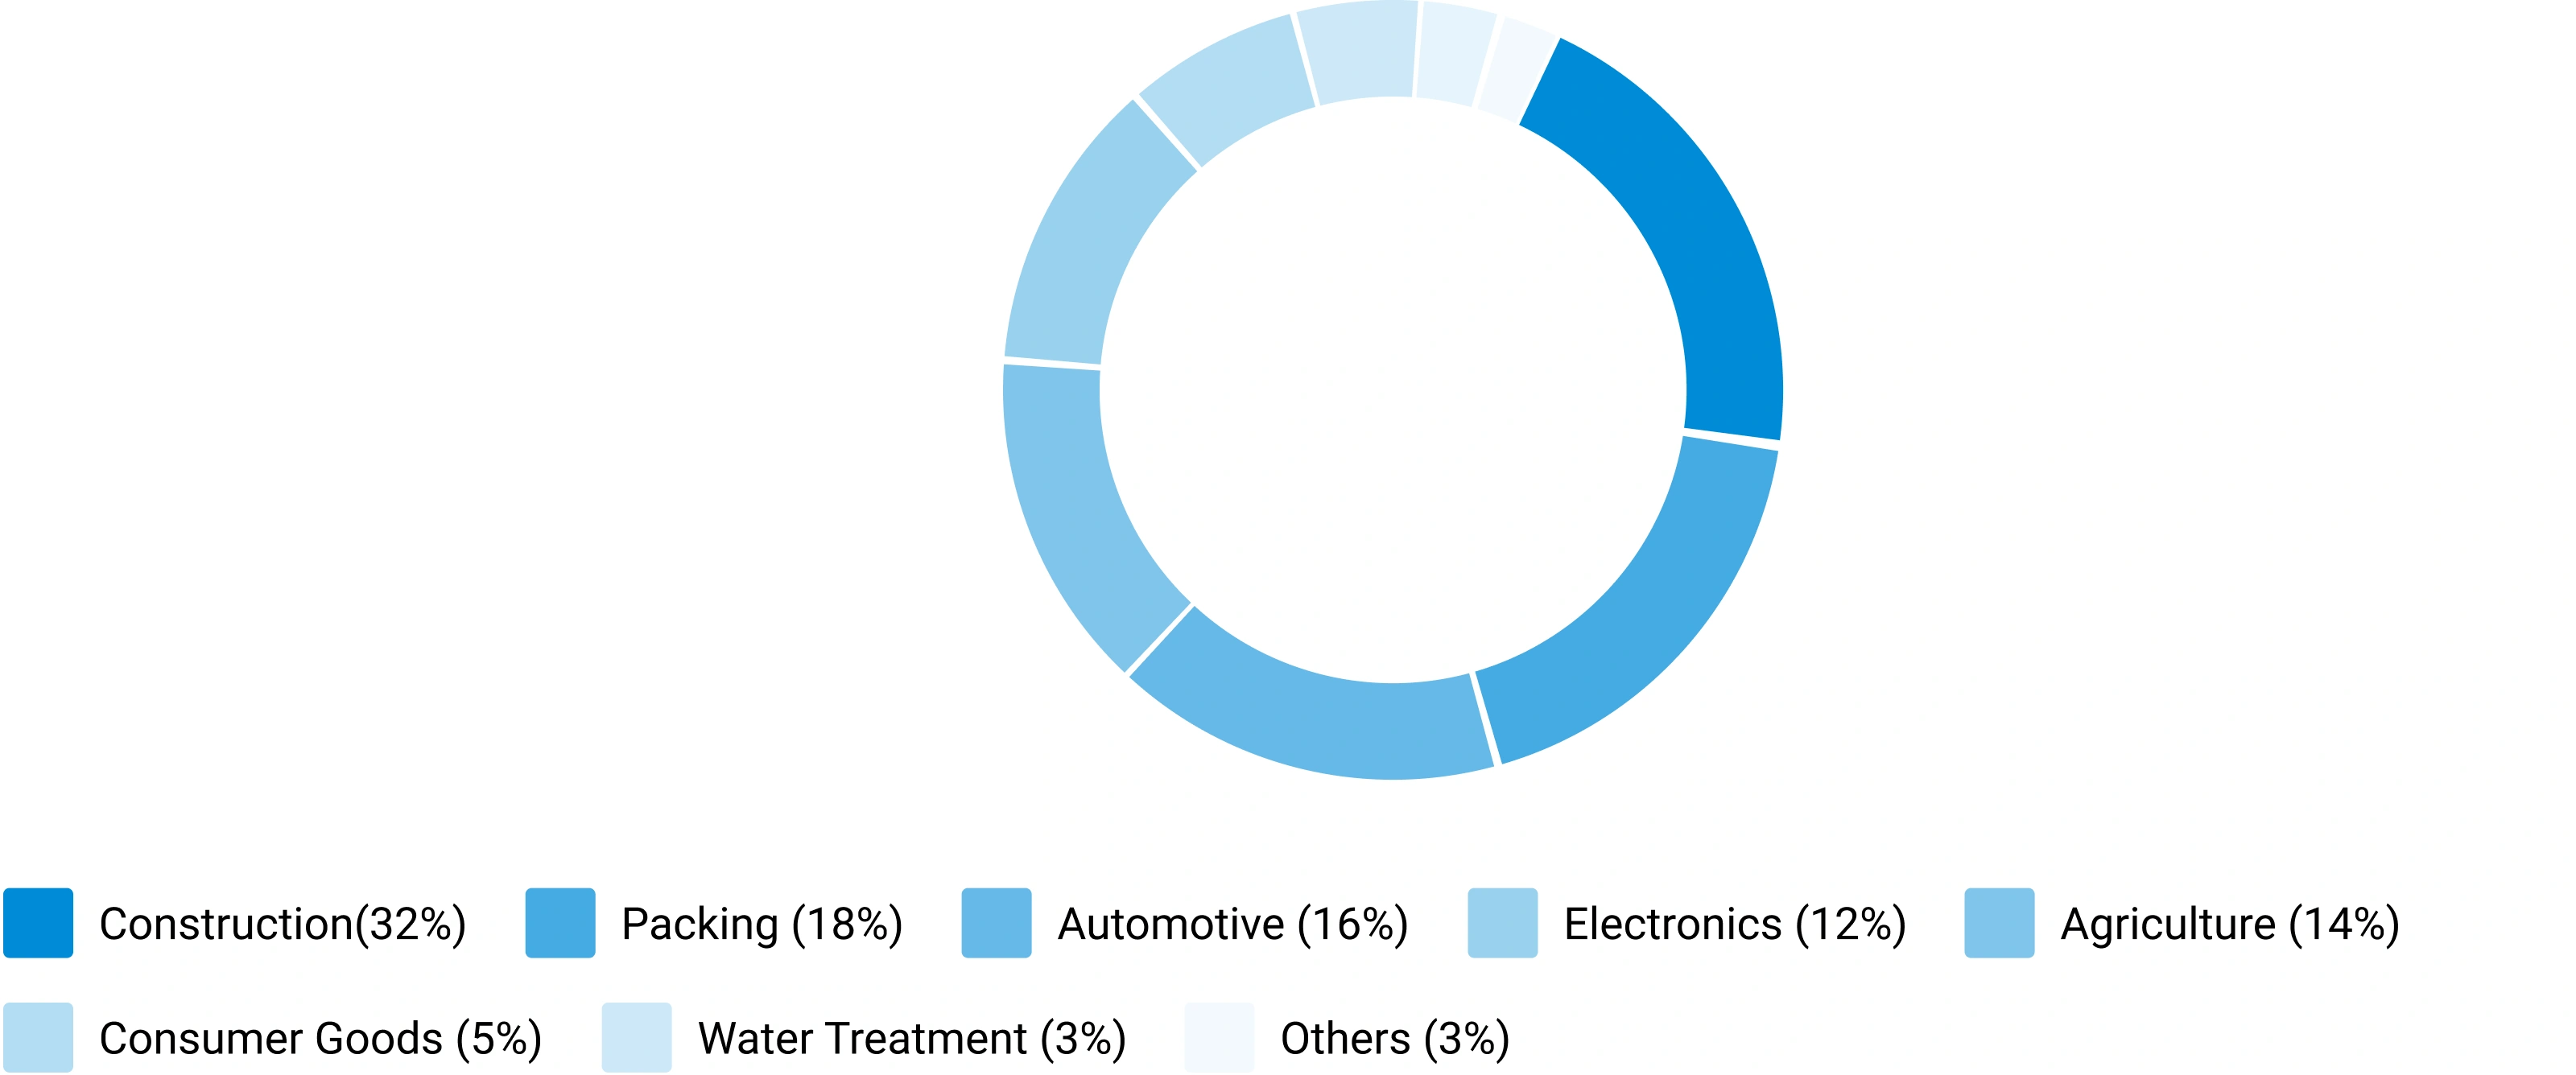
Chemical demand is evaluated across automotive, construction, packaging, electronics, agriculture, healthcare, consumer goods, industrial manufacturing, energy and utilities, and water treatment. Industry output, production trends, and consumption intensity are analyzed to determine demand patterns.
Consumption Modeling
Demand is estimated using measurable indicators: kilograms per vehicle, kilograms per square meter of construction, dosage per cubic meter of water treated, kilograms per hectare of agricultural land, and kilograms per ton of manufactured products. Consumption factors are validated through industry publications and primary interviews.
Application Analysis
The market is segmented by application area to understand product performance requirements, formulation trends, technology adoption, customer preferences, and regulatory requirements improving demand accuracy and segmentation granularity.
Demand-Side Assessment — End-Use Industry Demand Distribution
Illustrative distribution of chemical & materials demand across key end-use industries
Phase 4 - Trade Flow Analysis: Balancing Regional Supply and Demand
Trade flow analysis reconciles regional supply and demand estimates through import and export data, identifying net supply positions, regional dependencies, and market imbalances. It serves as an independent validation layer that tests the consistency of supply-side and demand-side estimates.
Import Analysis
Import data is evaluated to determine volumes, source countries, product dependency, regional supply gaps, and pricing trends — identifying markets that rely heavily on external supply and where domestic production is insufficient to meet demand.
Export Analysis
Export assessments reveal production surplus, export competitiveness, regional manufacturing strength, and global market participation. Export patterns also help validate domestic production estimates and identify net exporting regions.
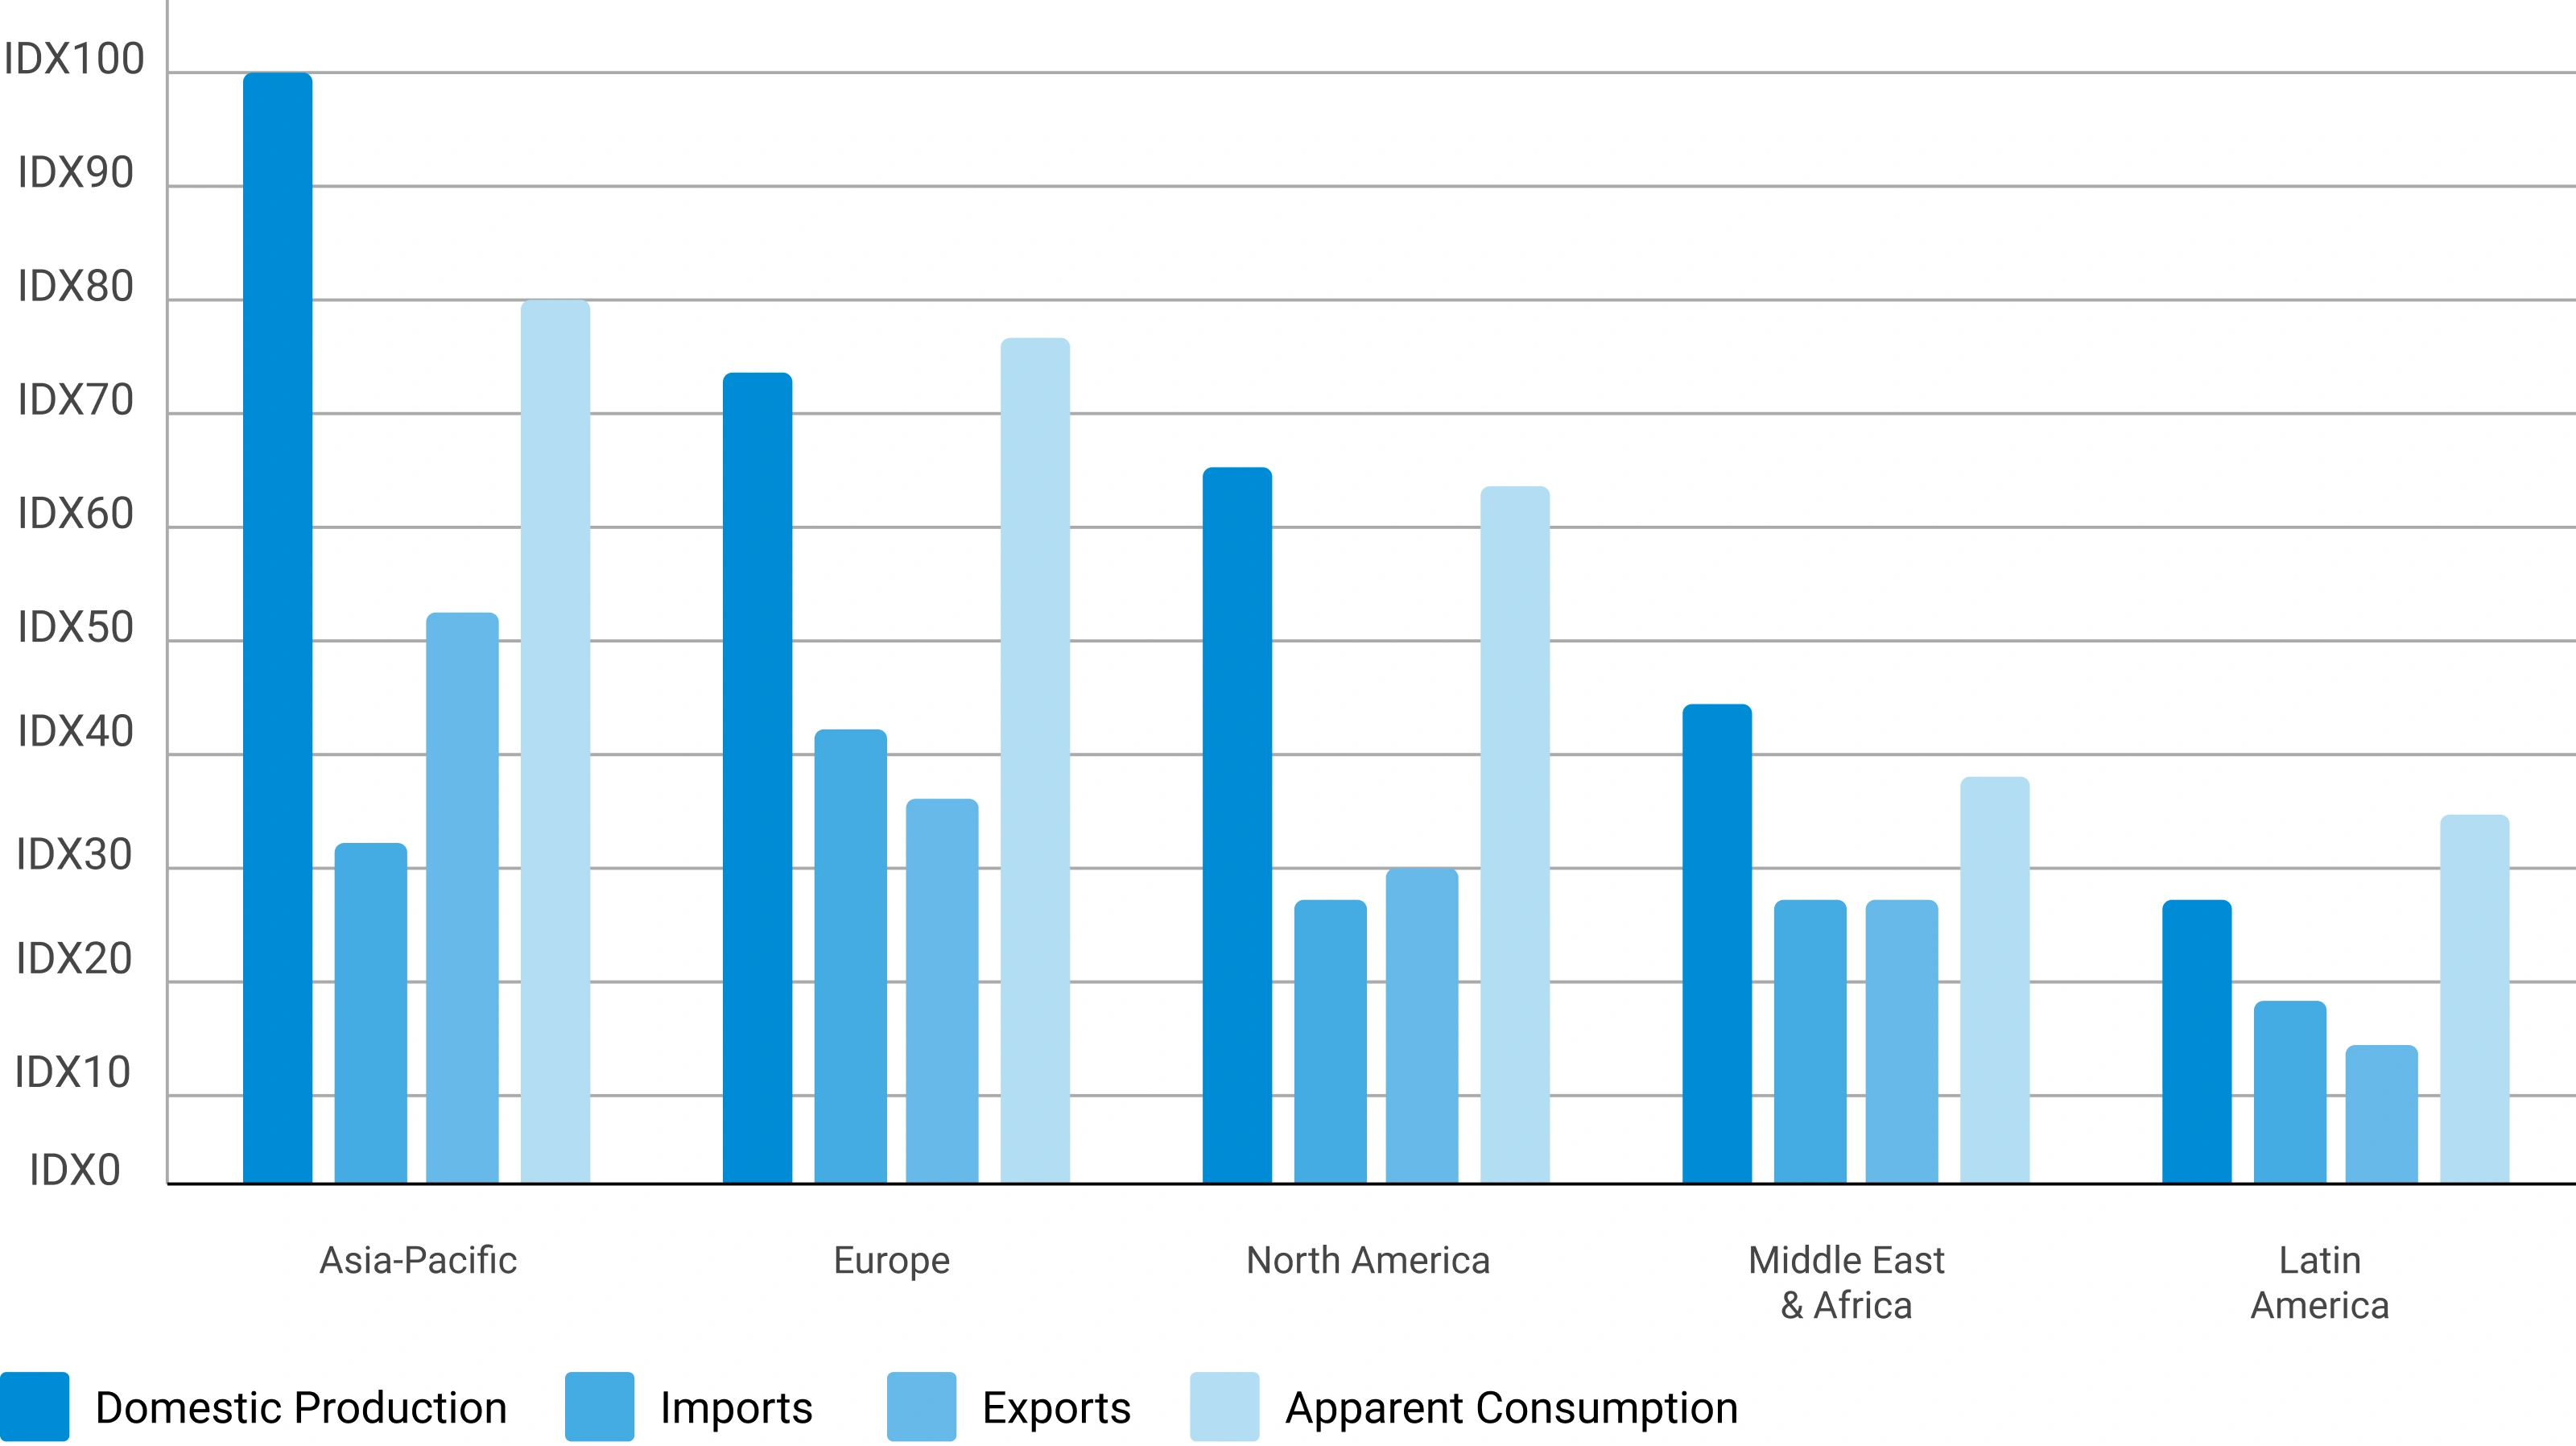
Apparent Consumption Model
Regional consumption is assessed using the standard apparent consumption formula:
Results identify net importing regions, net exporting regions, regional deficits, and surpluses — serving as an independent validation of supply and demand estimates.
Trade Flow Analysis — Net Supply Position by Region
Illustrative apparent consumption vs. domestic production across major regions — positive gap indicates net import dependency
Phase 5 — Primary Research: The Critical Validation Layer
Primary research tests and refines findings from secondary research through direct engagement with industry participants across the supply chain, demand side, and expert community. It captures intelligence that no database or published report can provide — the real-world experience of manufacturers, buyers, and specialists operating in the market.

Supply-Side Interviews
Conversations with chemical manufacturers, raw material suppliers, contract manufacturers, technology providers, and plant operators cover production trends, capacity utilization, pricing developments, technology shifts, and competitive dynamics.

Demand-Side Interviews
Engagement with OEMs, industrial consumers, procurement managers, distributors, formulators, and end-use manufacturers focuses on consumption trends, purchasing behavior, product substitution, demand outlook, and emerging applications.

Industry Expert Consultations
Additional interviews with industry consultants, independent experts, regulatory specialists, technical professionals, and research institutions provide deeper market context and validate key analytical assumptions.
Focus Areas of Primary Research:
Market Size & Forecast Validation
Revenue estimates, volume consumption, growth rates, forecast assumptions, regional demand.Supply Chain & Value Chain Assessment
Raw material sourcing, supply chain challenges, distribution networks, procurement practices.Production & Capacity Analysis
Manufacturing capacity, utilization rates, expansion projects, plant investments.Pricing & Cost Structure Analysis
Product pricing trends, feedstock costs, energy costs, margin pressures, pricing outlook.Competitive Landscape Assessment
Volume and value estimates confirmed to be fully consistent with one another before publicationInterview Volume by Market Scope
| Study Scope | Number of Interviews |
|---|---|
| Niche Market | 20 – 30 |
| Mid-Sized Market | 30 – 50 |
| Global Market | 50 – 80 |
| Highly Fragmented Market | 80 – 120 |
Interview Details:
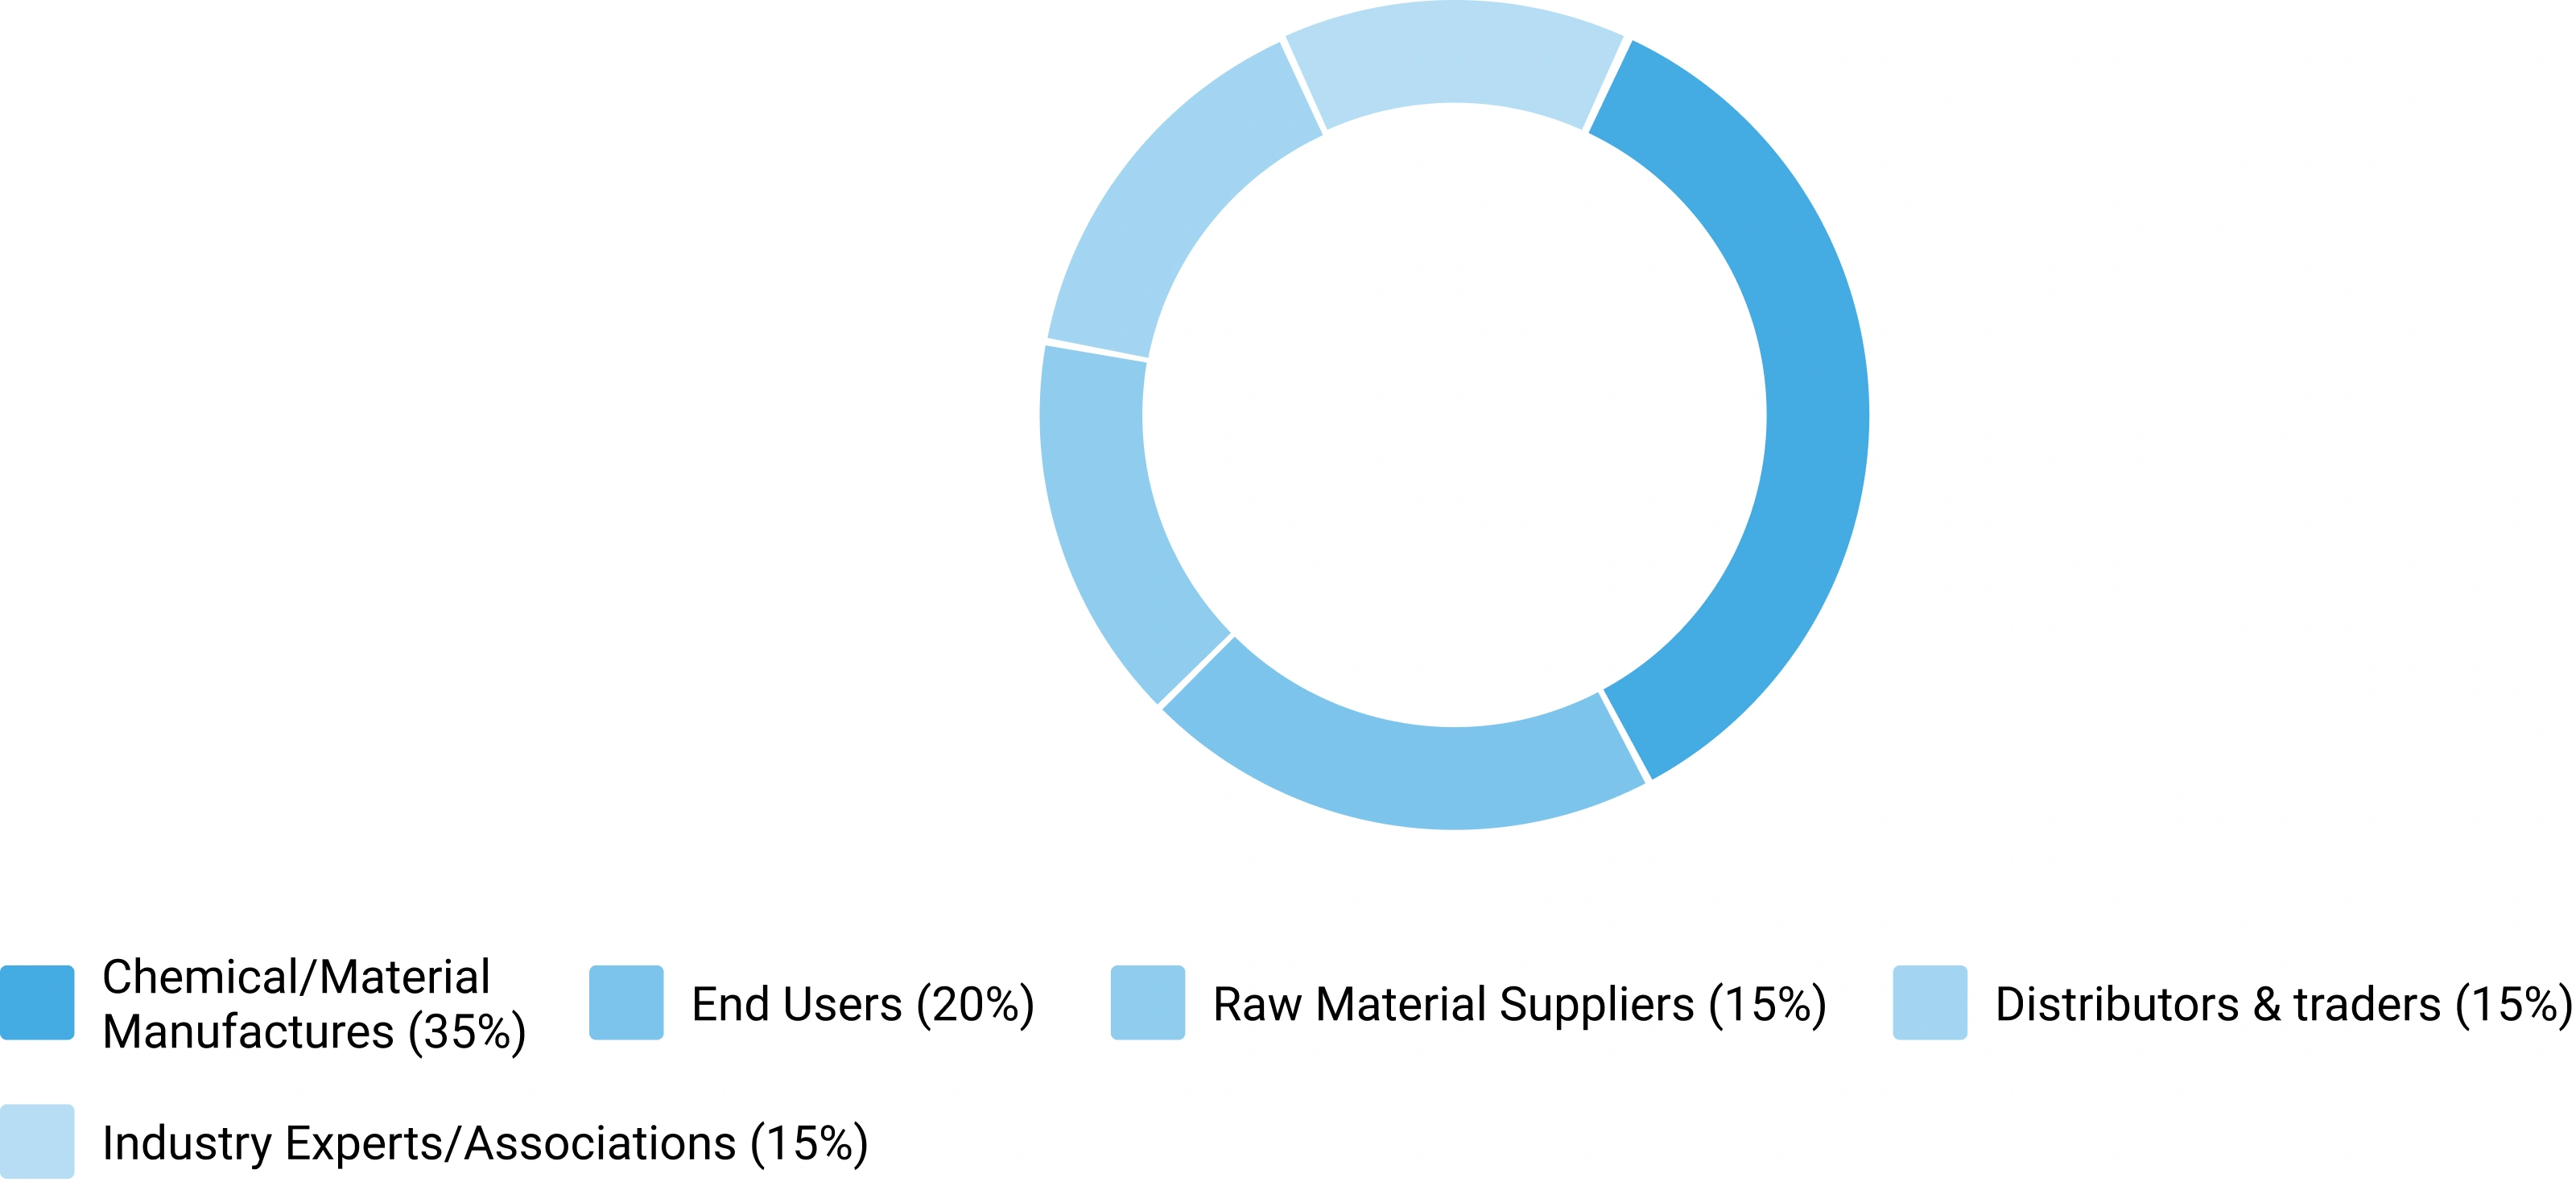
Category : Manufacturers, Suppliers, Distributors, End Users, Experts/Associations
Average Duration : 30–60 Minutes
Interview Mode : Video calls, telephonic interviews, expert consultations
Interview Format : Structured / Semi-Structured questionnaire
Focus Areas of Primary Research:
Market Size & Forecast Validation :
Revenue estimates, volume consumption, growth rates, forecast assumptions, regional demand.
Supply Chain & Value Chain Assessment :
Raw material sourcing, supply chain challenges, distribution networks, procurement practices.
Production & Capacity Analysis :
Manufacturing capacity, utilization rates, expansion projects, plant investments.
Pricing & Cost Structure Analysis :
Product pricing trends, feedstock costs, energy costs, margin pressures, pricing outlook.
Competitive Landscape Assessment :
Market share, competitor positioning, strategic initiatives, partnerships, acquisitions.
Primary Research — Stakeholder Coverage by Category
Distribution of interview respondents across stakeholder categories (% share from PPT data)
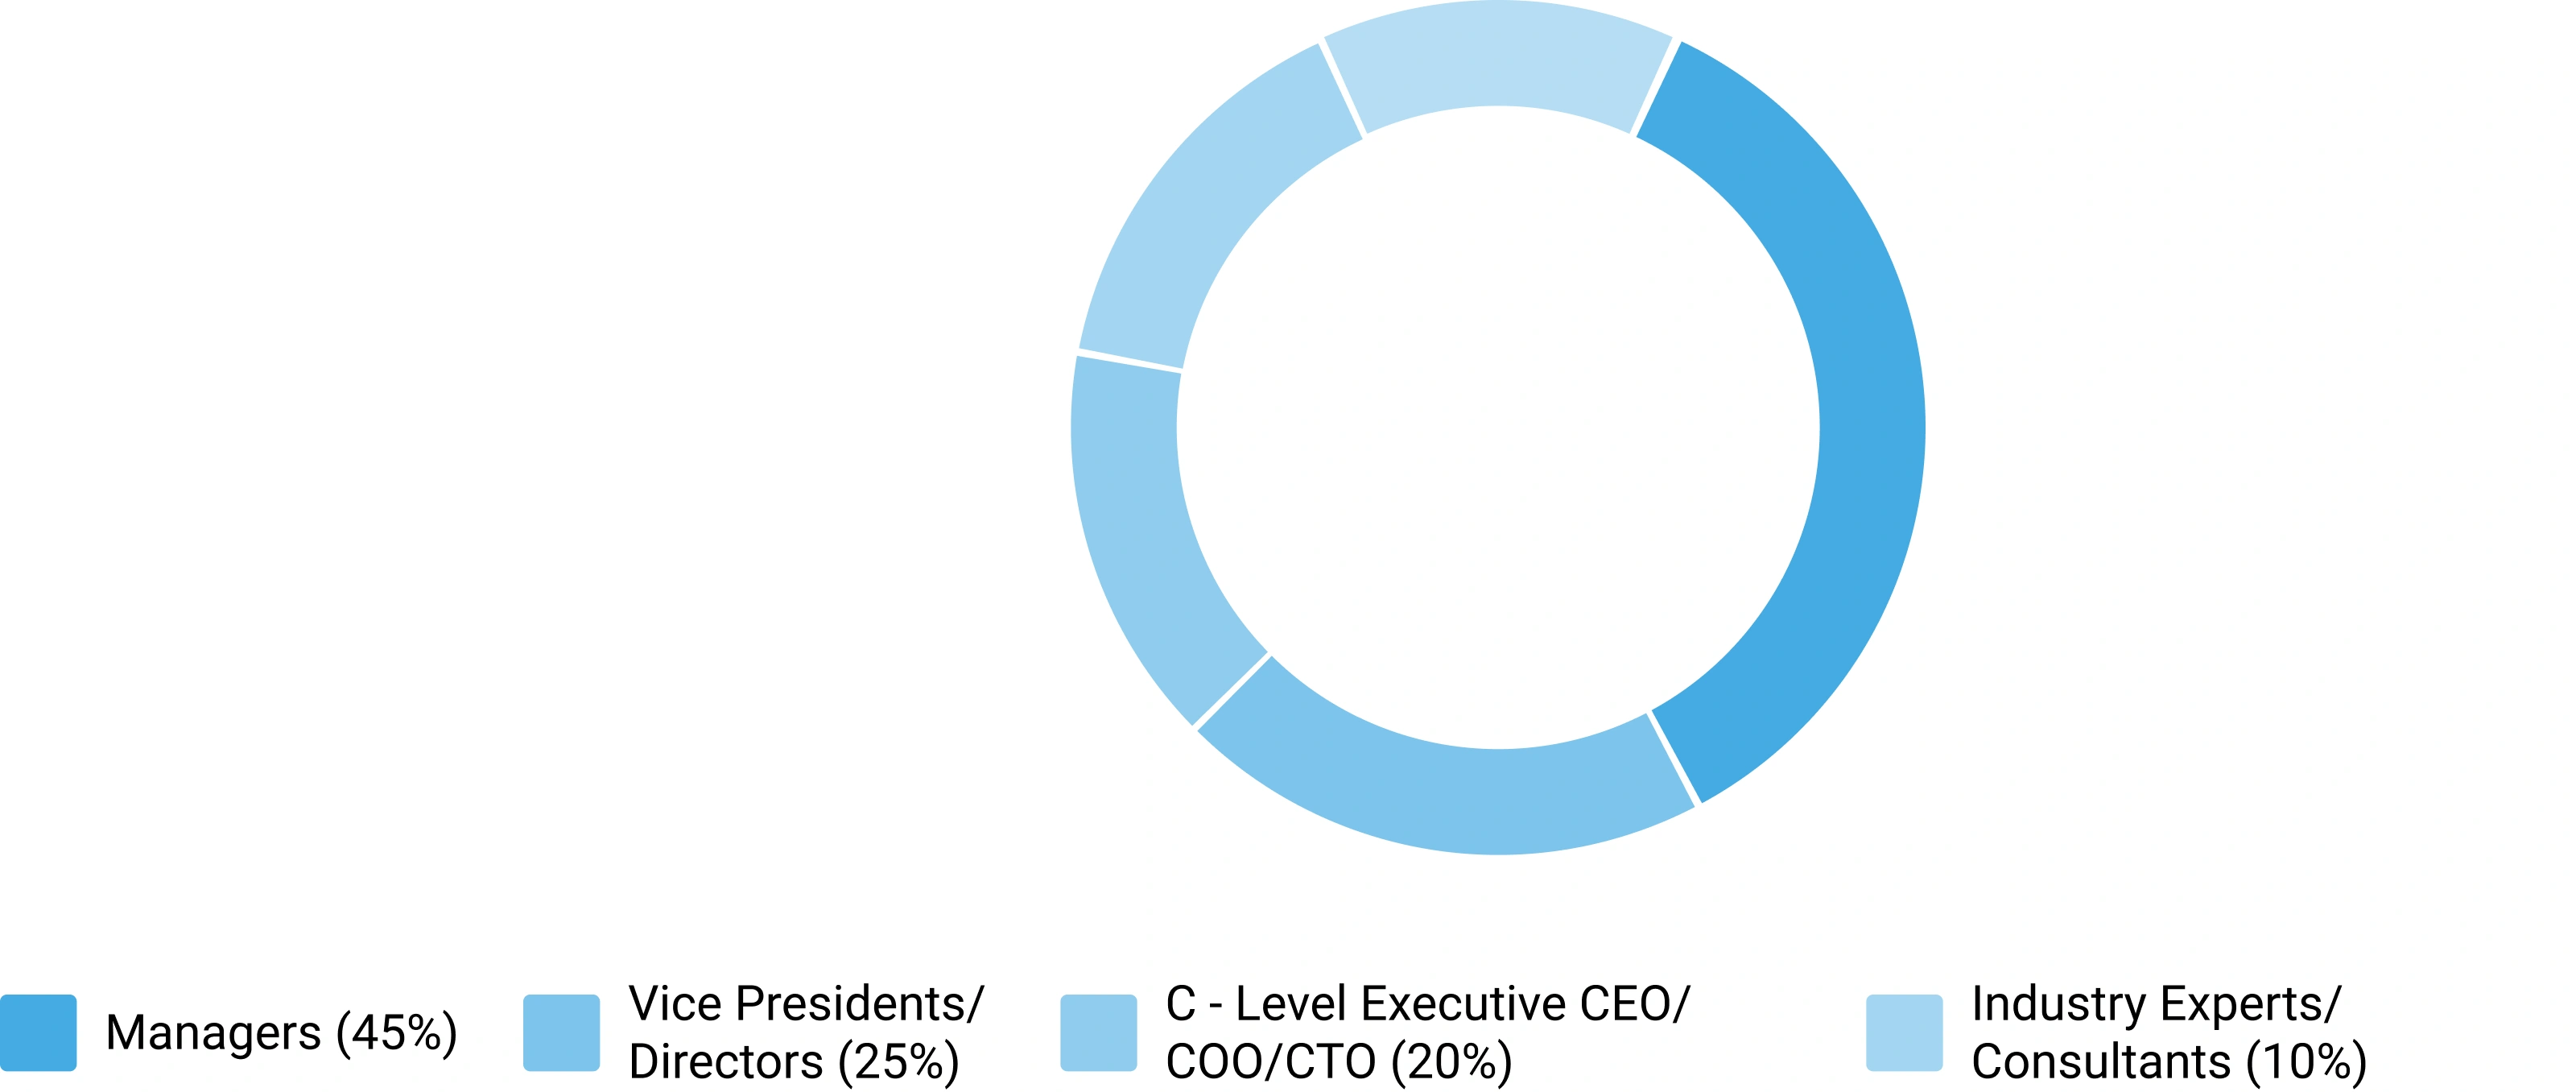
Primary Research — Respondent Designation Profile
Seniority breakdown of interview respondents (% share from PPT data)
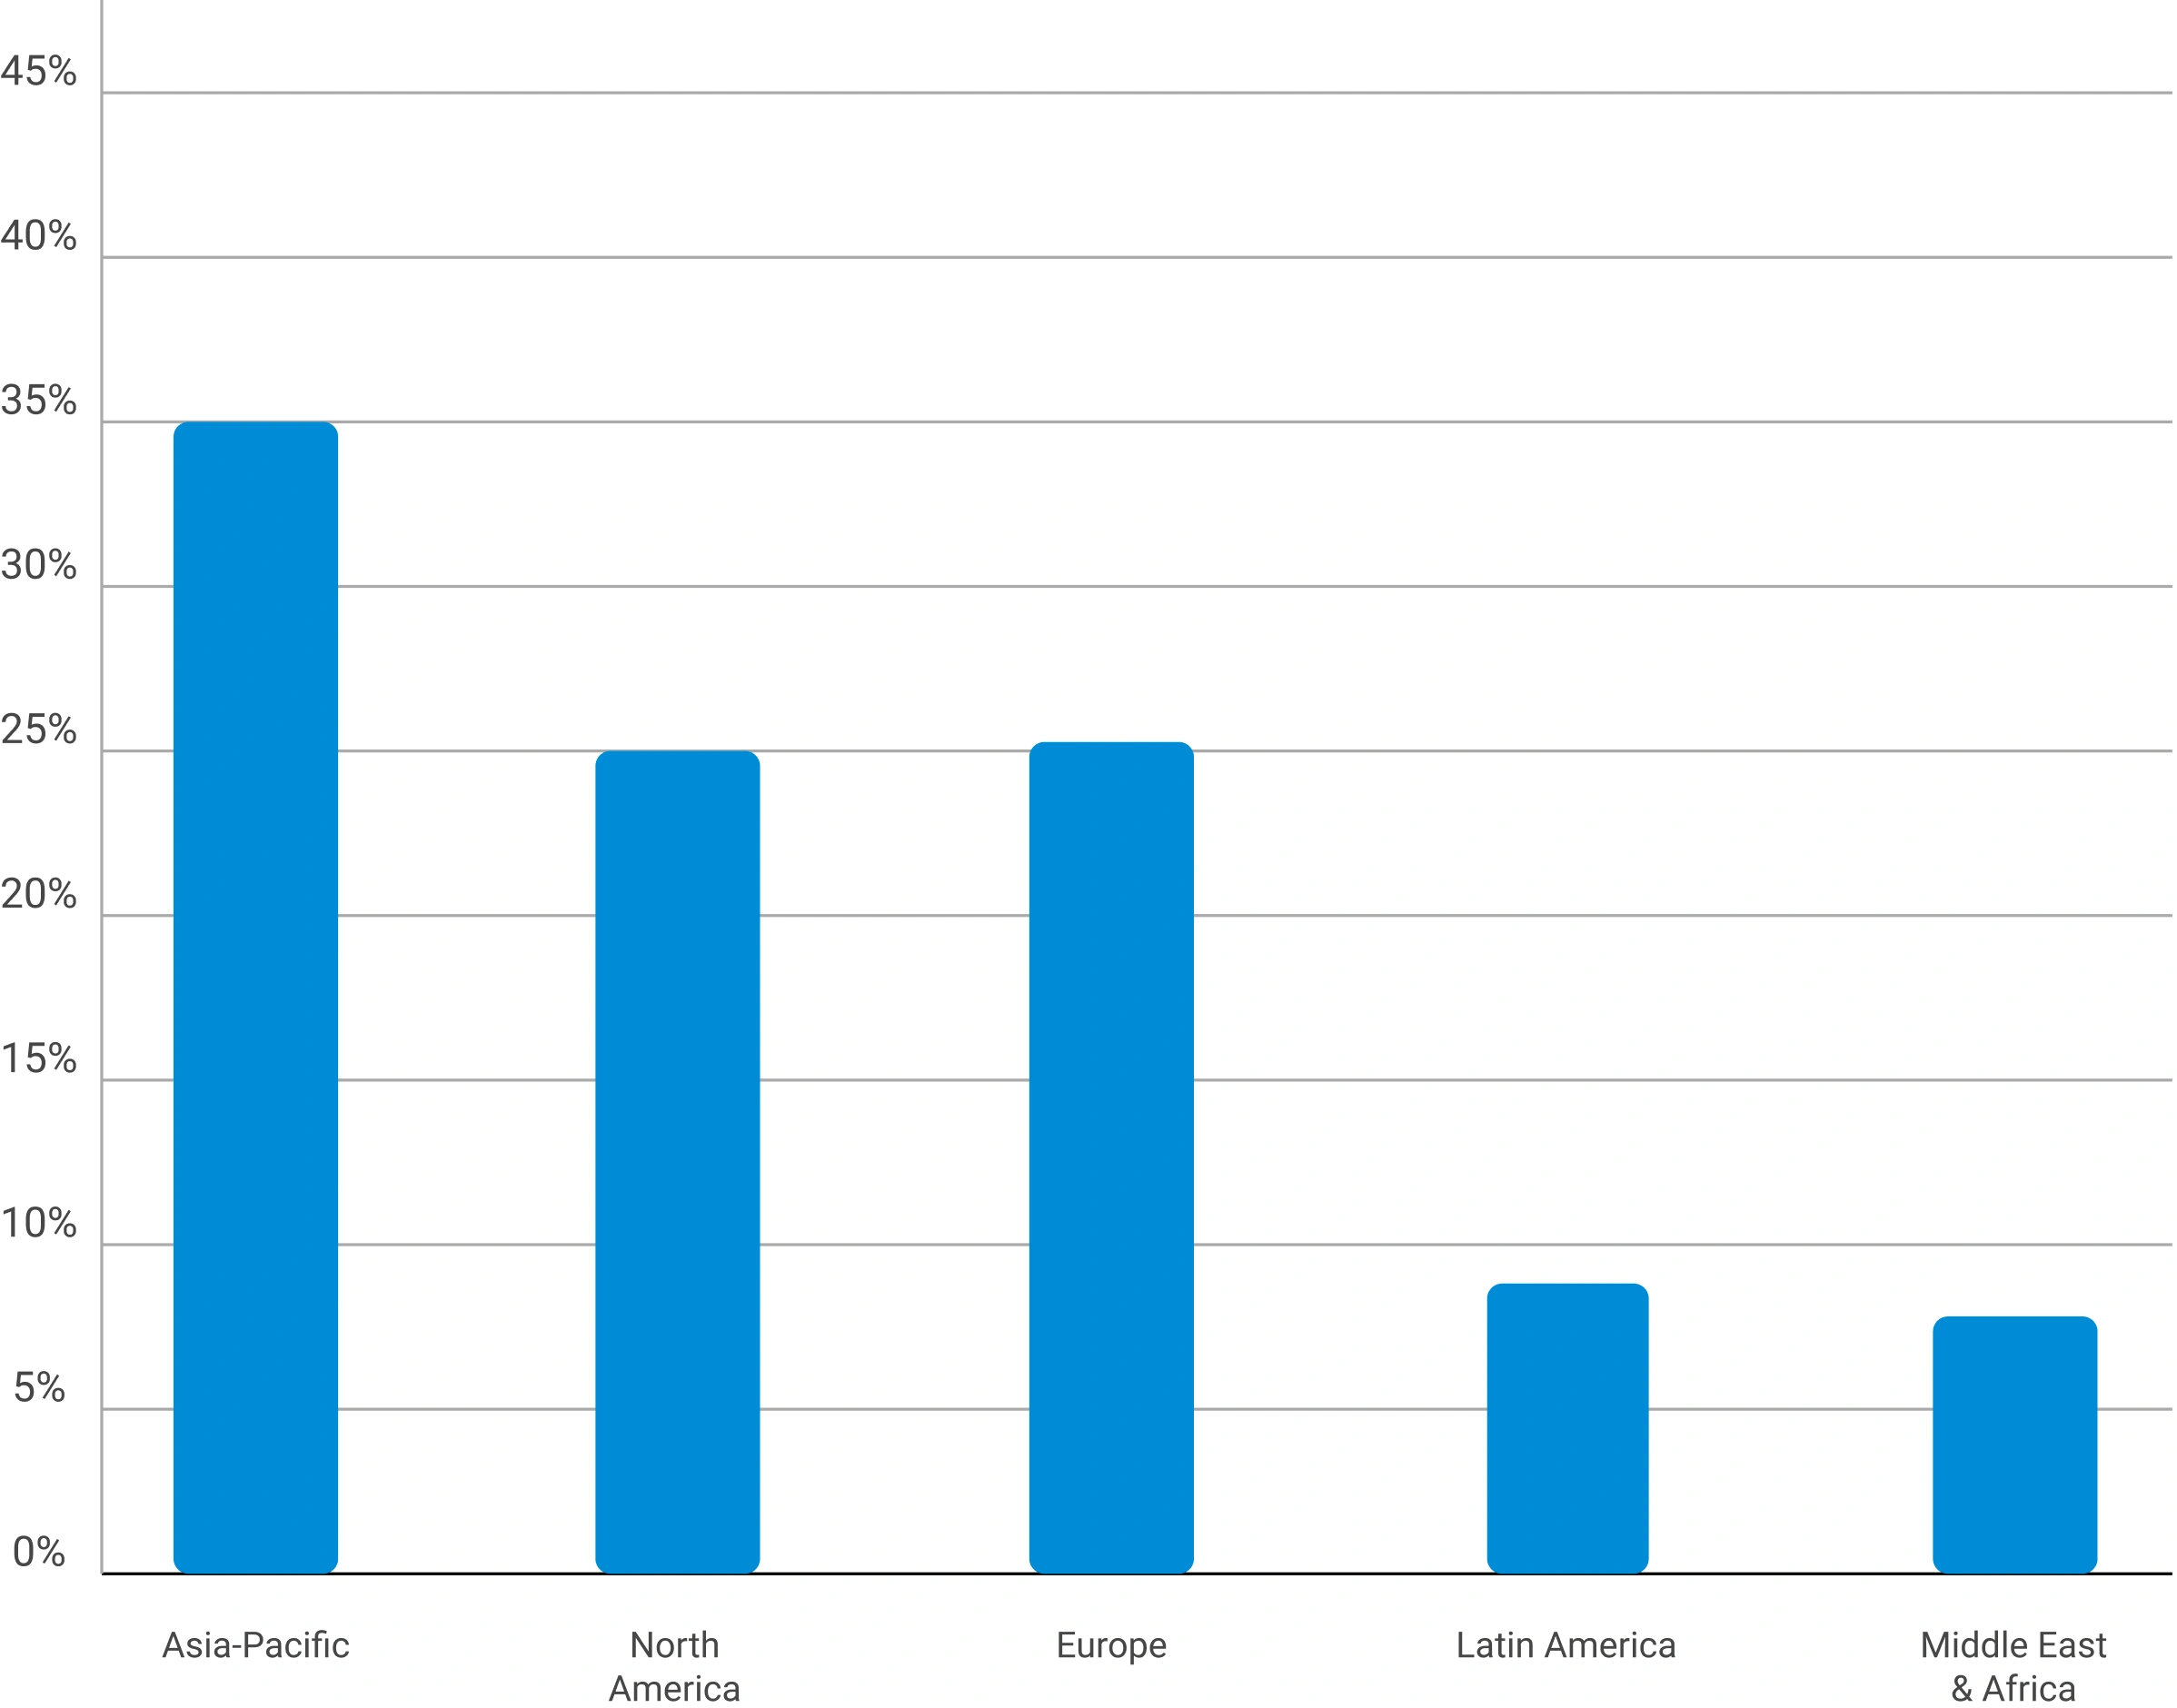
Primary Research — Geographic Coverage of Interviews
Regional distribution of primary research engagement (% share from PPT data)
Phase 6 — Data Triangulation and Market Validation
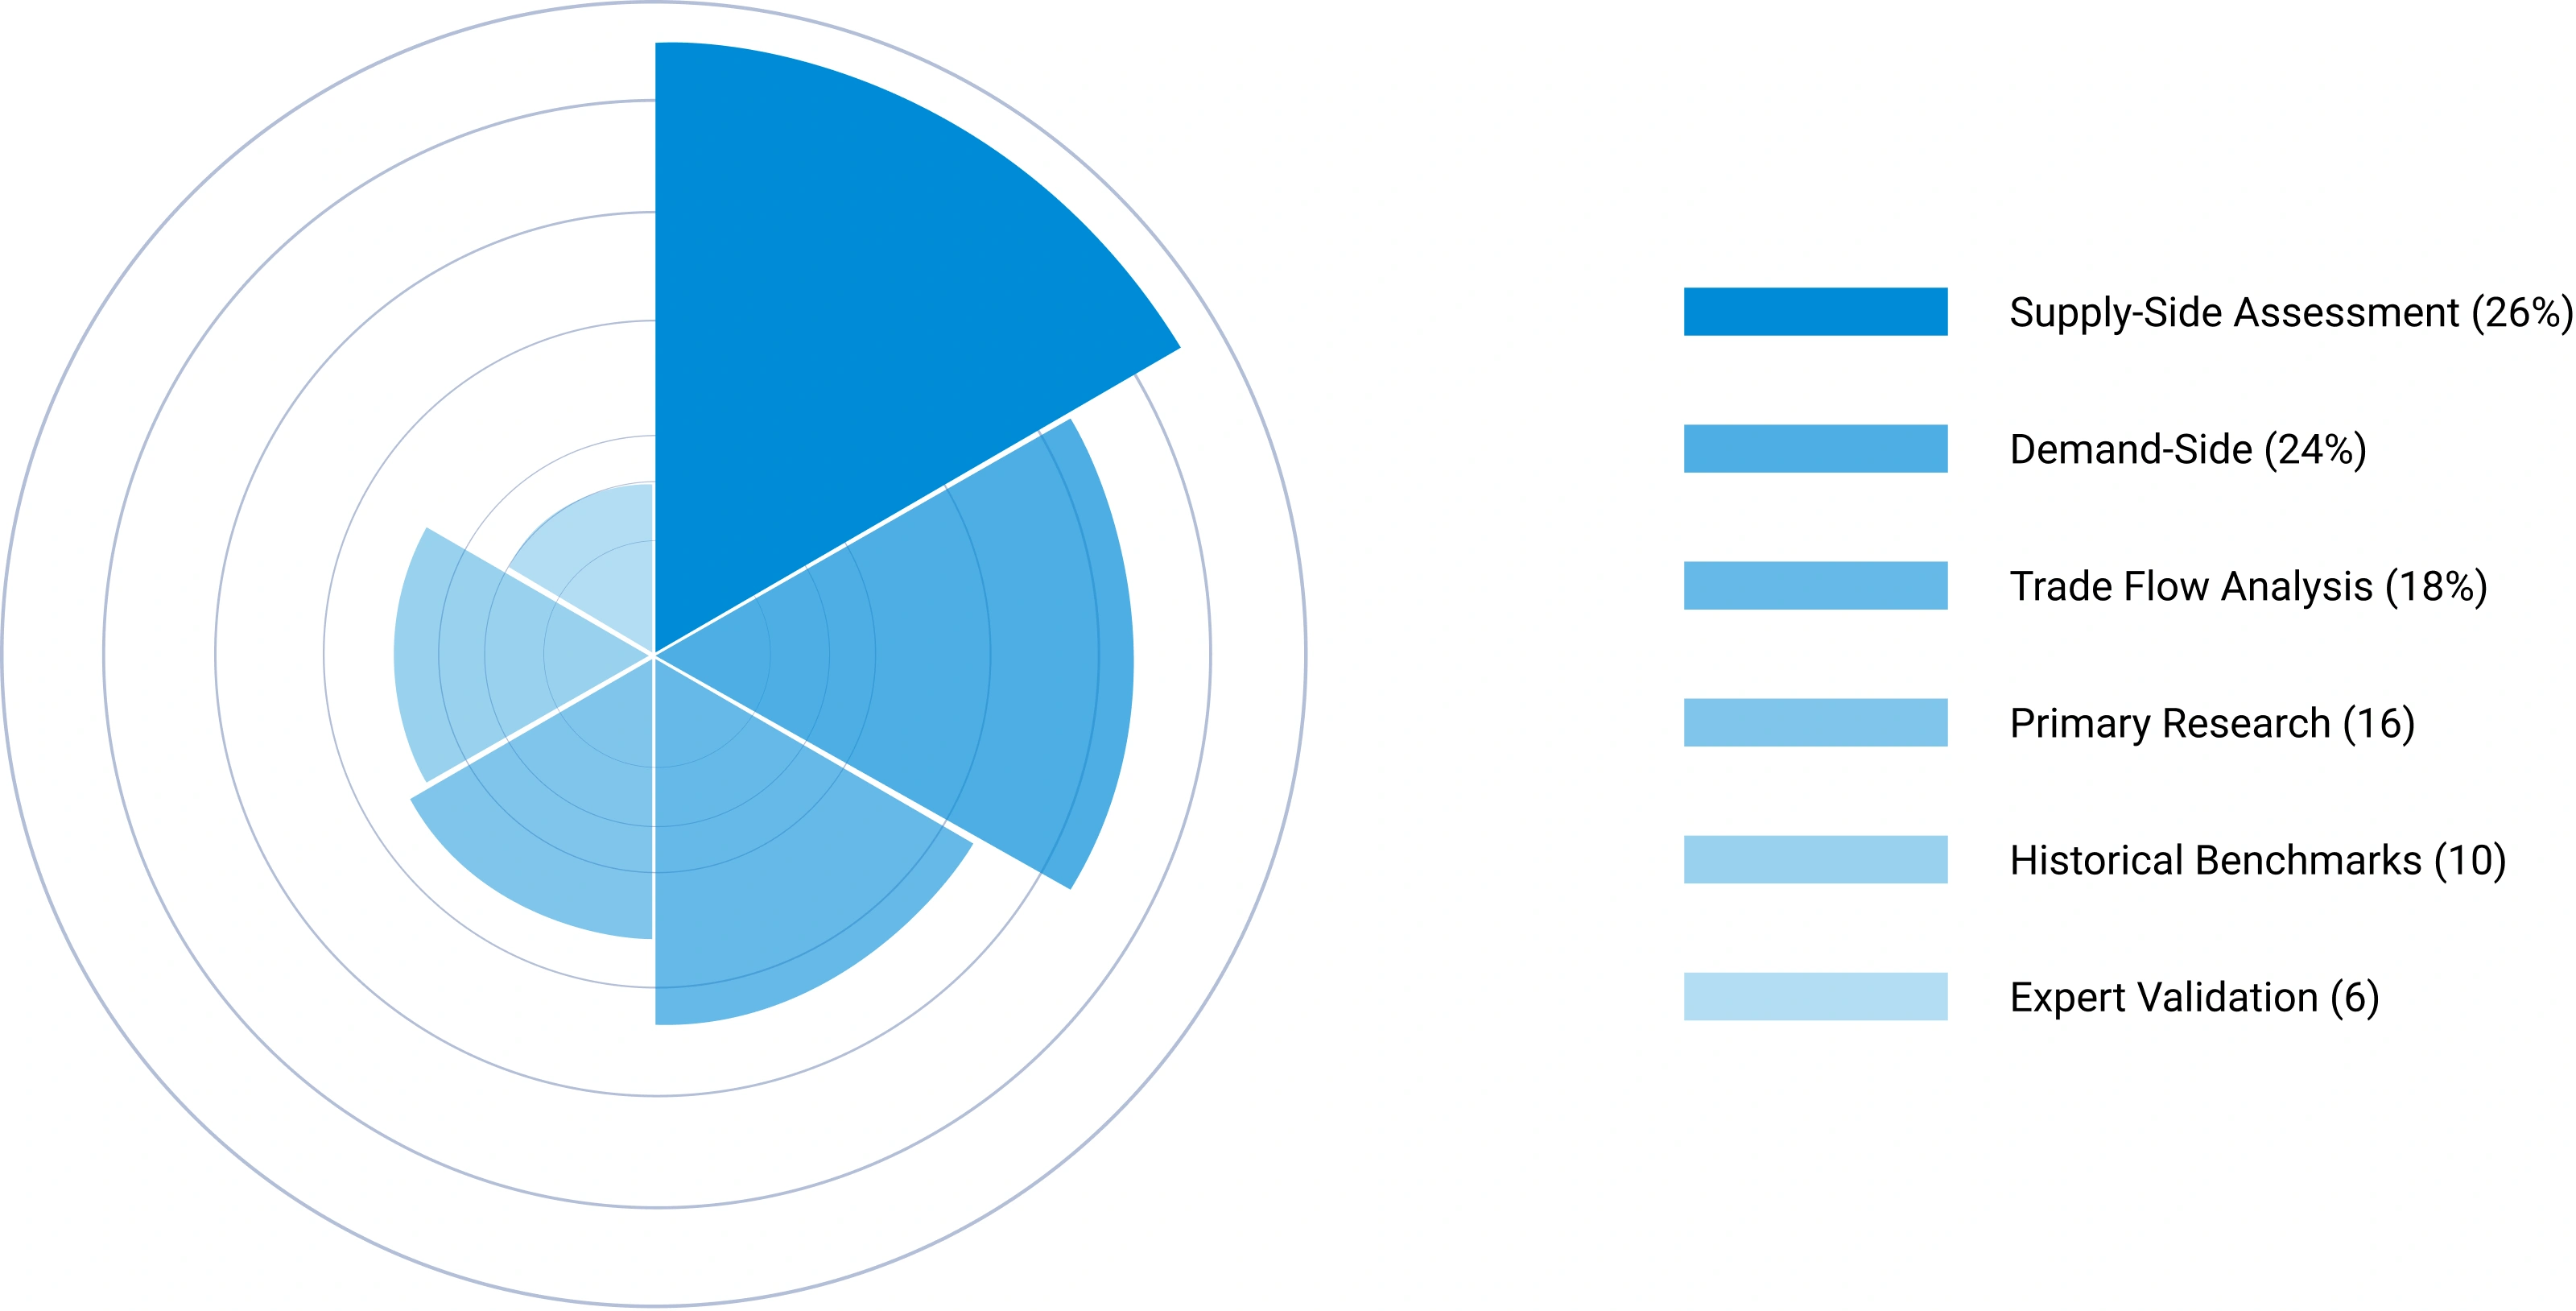
No single methodology is relied upon in isolation. Multiple independent estimation approaches are combined and reconciled to ensure consistency, accuracy, and analytical defensibility. Any material deviations between approaches are investigated and adjusted through additional validation cycles.
The final market size is derived through weighted triangulation of all validated methodologies. Any material deviations between approaches are investigated and adjusted through additional validation cycles. The outcome represents the most realistic assessment of the market based on available evidence and expert confirmation ensuring that volume and value estimates are fully consistent with one another.
Triangulation Framework — Input Contribution Weight
Relative weight each sizing input contributes to the final reconciled market estimate
Phase 7 — Forecast Modeling: Projecting Future Market Evolution
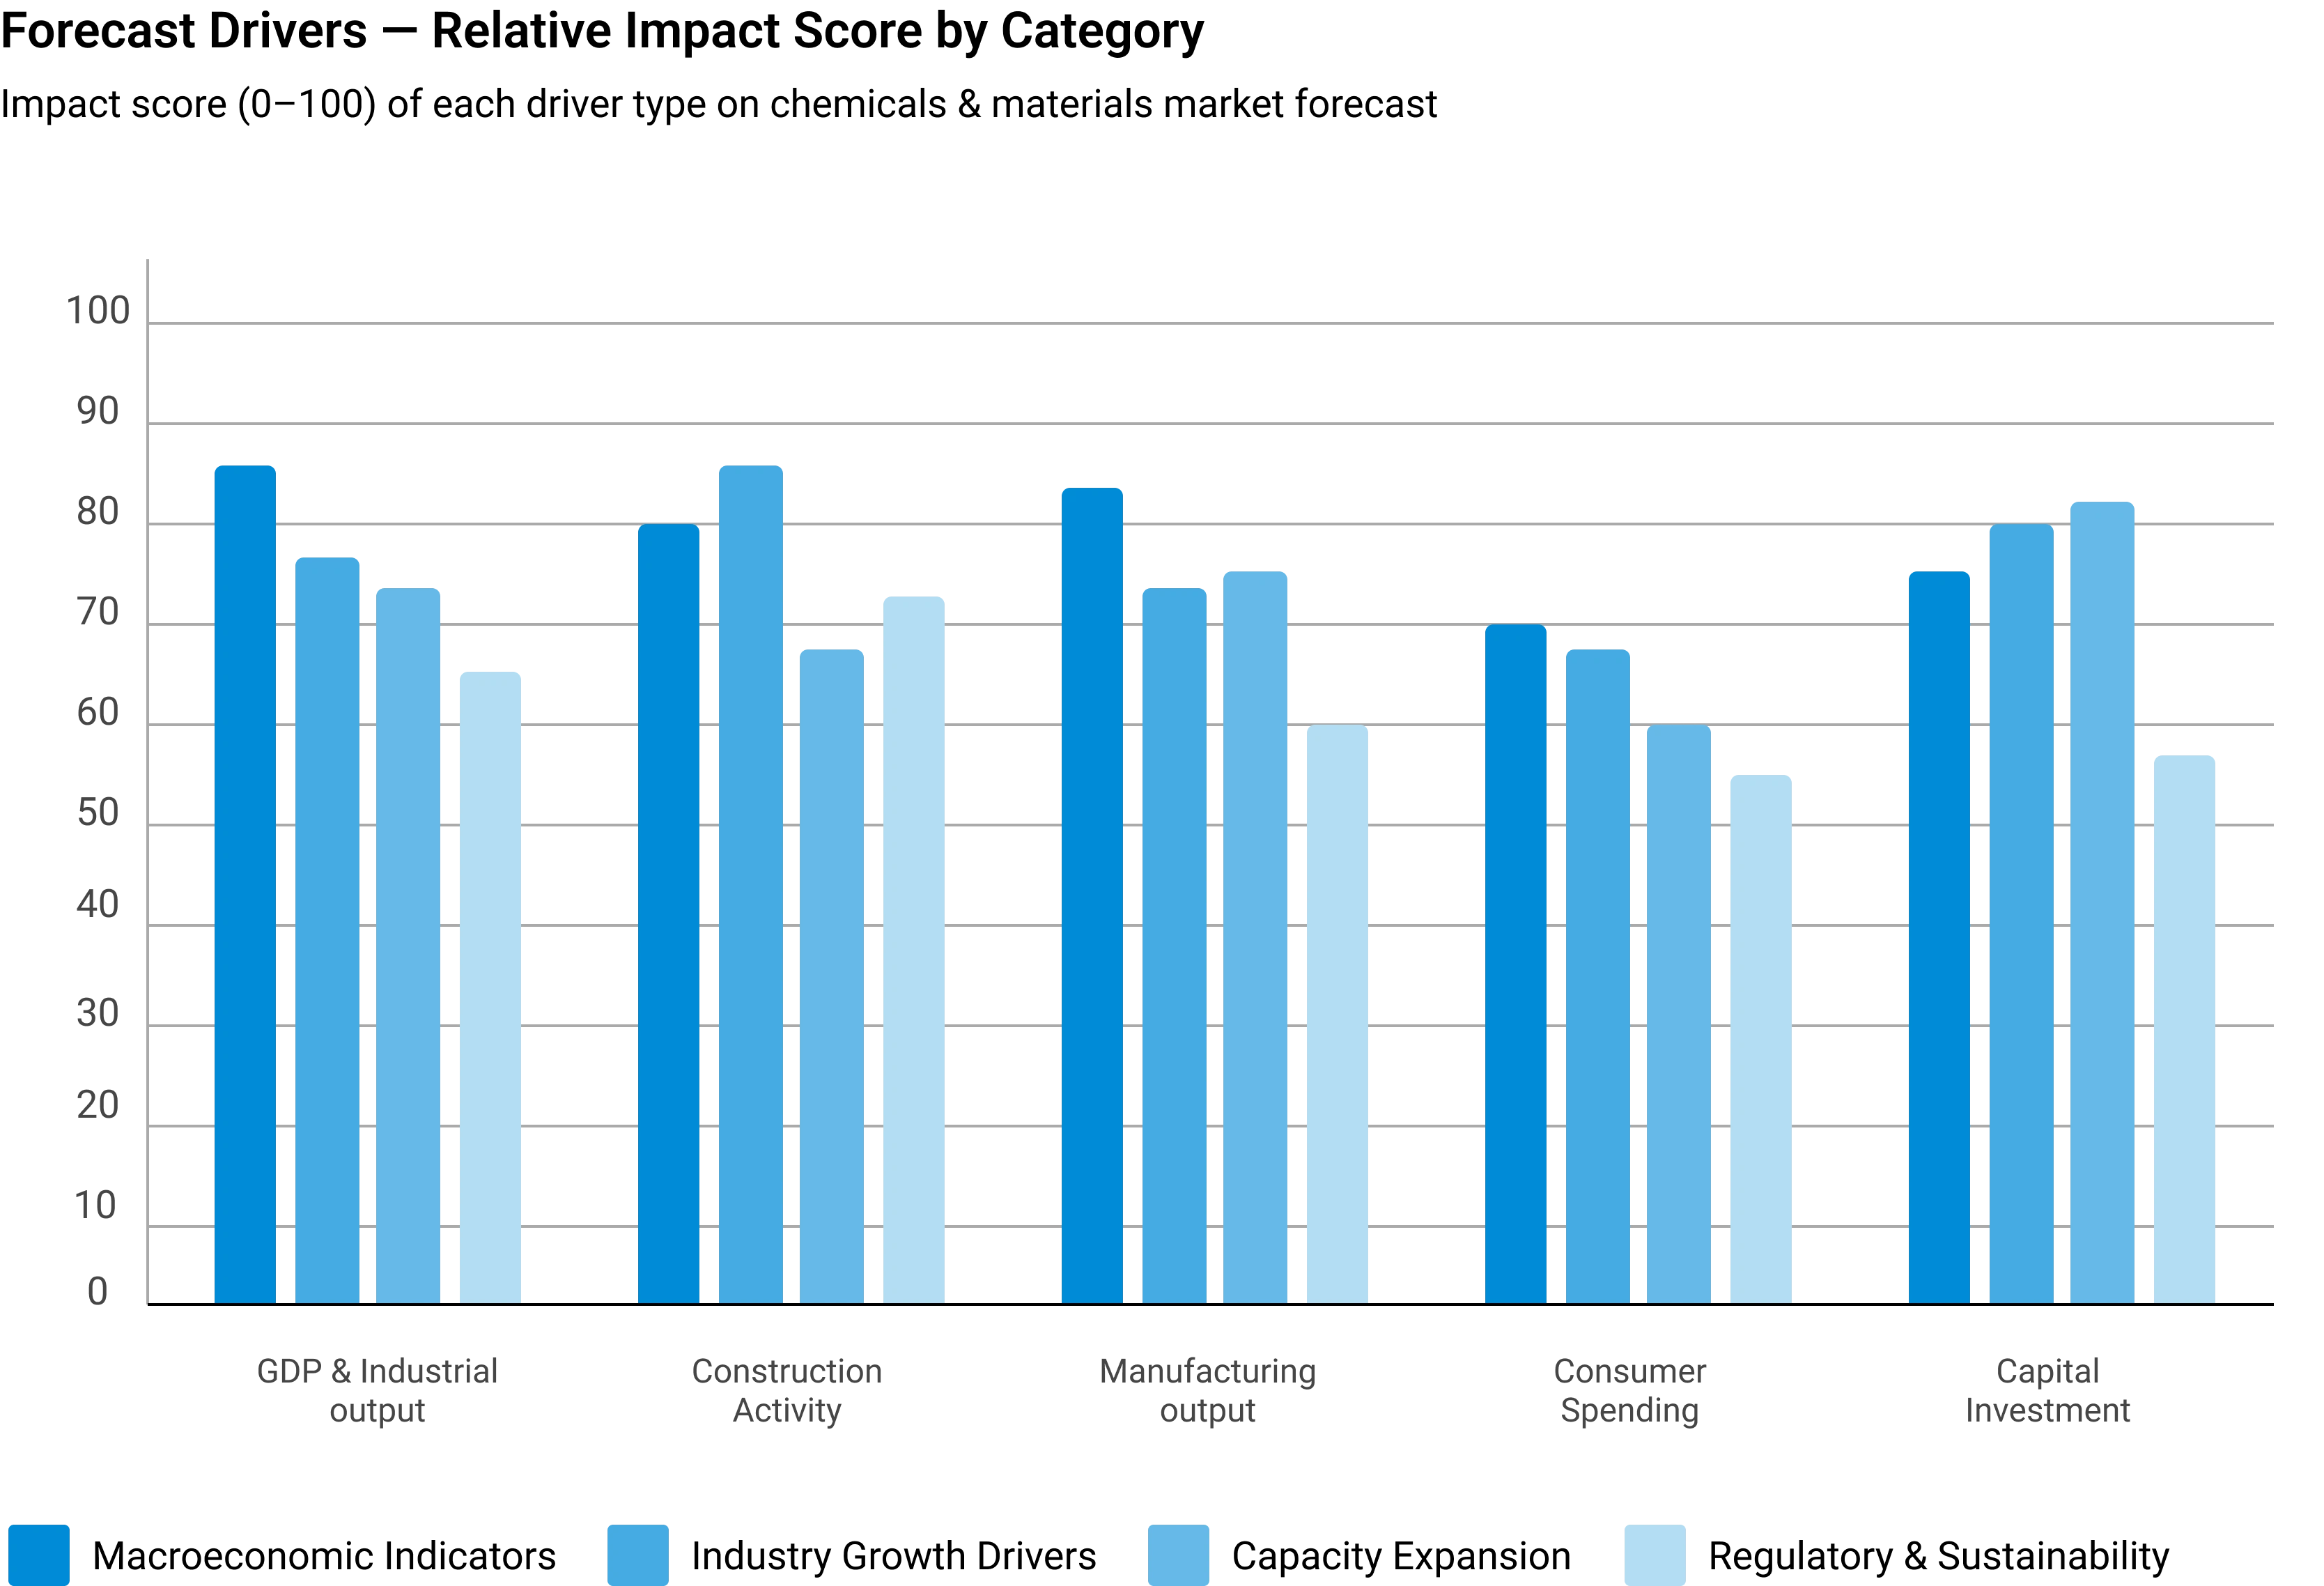
Forecasting evaluates the future trajectory of the market using a combination of quantitative indicators and qualitative assessments across economic, industry, and regulatory dimensions. Rather than simple extrapolation, each driver is independently modeled and integrated into a composite forecast.
Macroeconomic Indicators
GDP growth, industrial production, manufacturing output, construction activity, consumer spending, and capital investment form the quantitative foundation of long-term demand projections. These are applied at country, regional, and global levels.
Industry Growth Drivers
Urbanization, infrastructure development, industrialization, technological innovation, sustainability initiatives, and evolving product performance requirements are assessed at regional and industry levels — capturing both structural and cyclical demand drivers.
Capacity Expansion Analysis
Announced plant expansions, new manufacturing facilities, technology upgrades, and strategic investments are evaluated to determine future supply-demand dynamics and potential market tightness or oversupply situations.
Regulatory & Sustainability
Environmental regulations, chemical safety standards, emission reduction targets, circular economy initiatives, and sustainability requirements are incorporated as they often influence product adoption rates and market growth trajectories.
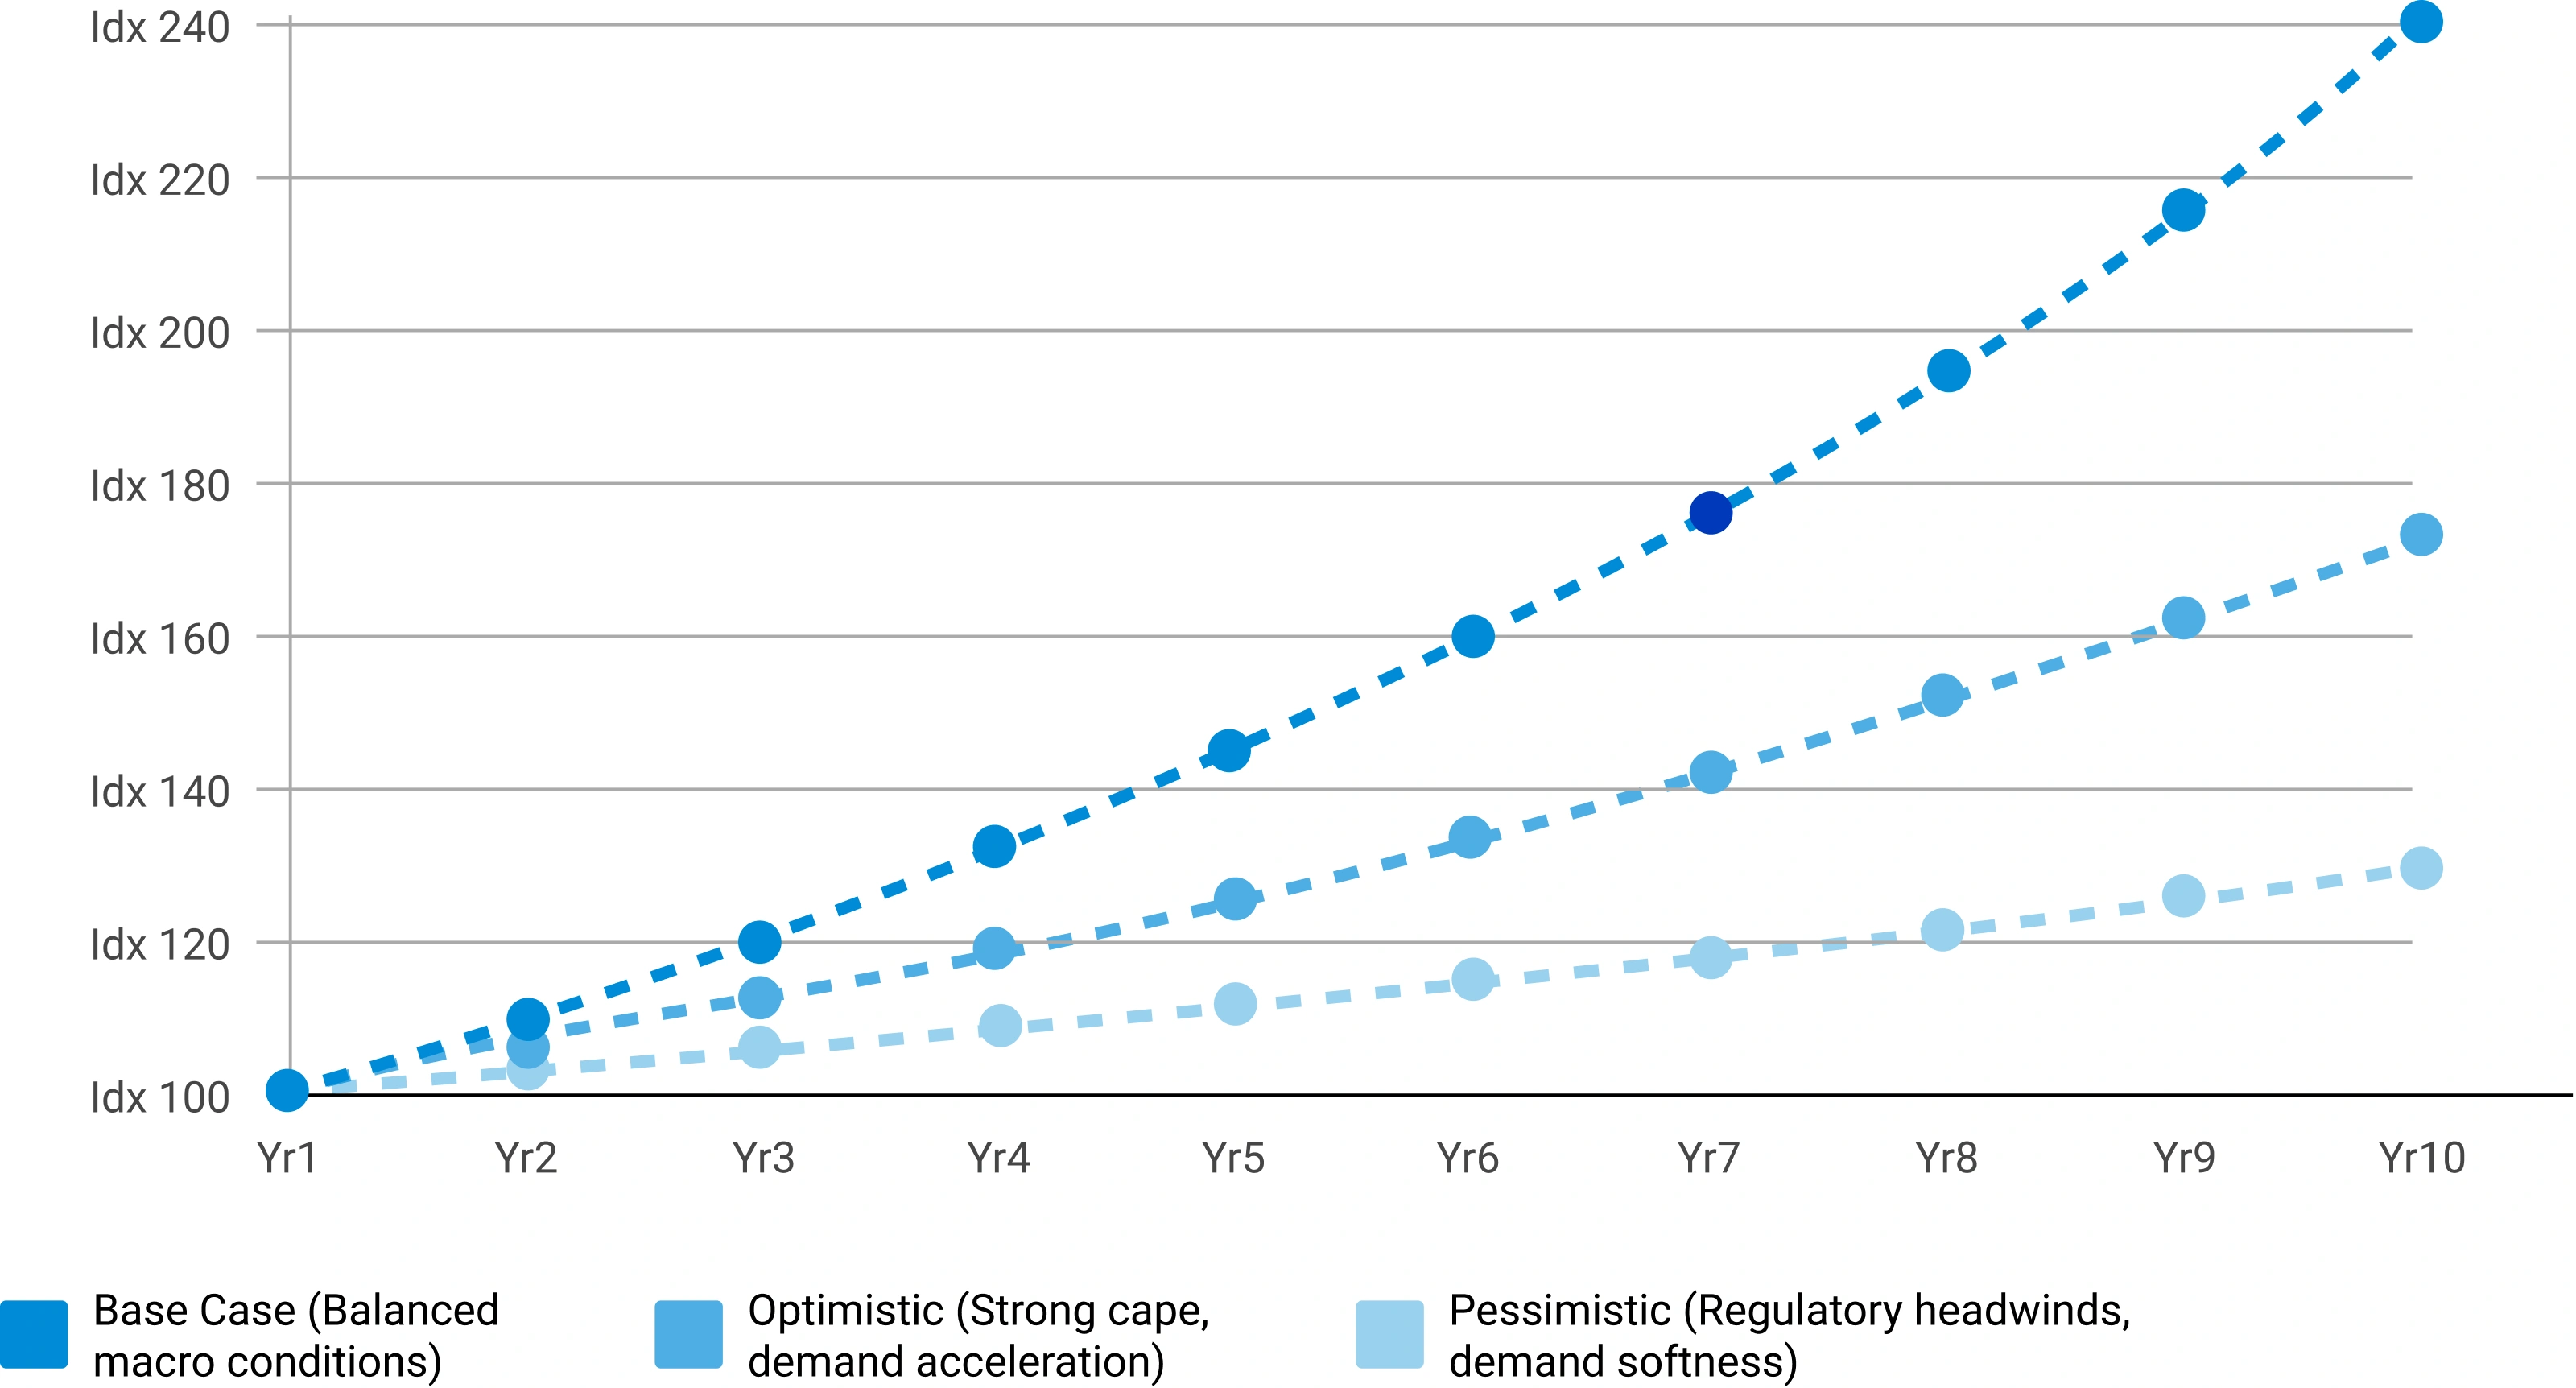
Scenario Forecast Range — Indexed Market Growth (Year 1–10)
Illustrative indexed growth trajectories across Base, Optimistic, and Pessimistic scenarios over a 10-year forecast horizon
Forecast Drivers — Relative Impact Score by Category
Impact score (0–100) of each driver type on chemicals & materials market forecast



Comments
Share your thoughts, ask a question, or provide feedback about this report.