
Plastic Antioxidants Market Size Analysis Report 2034
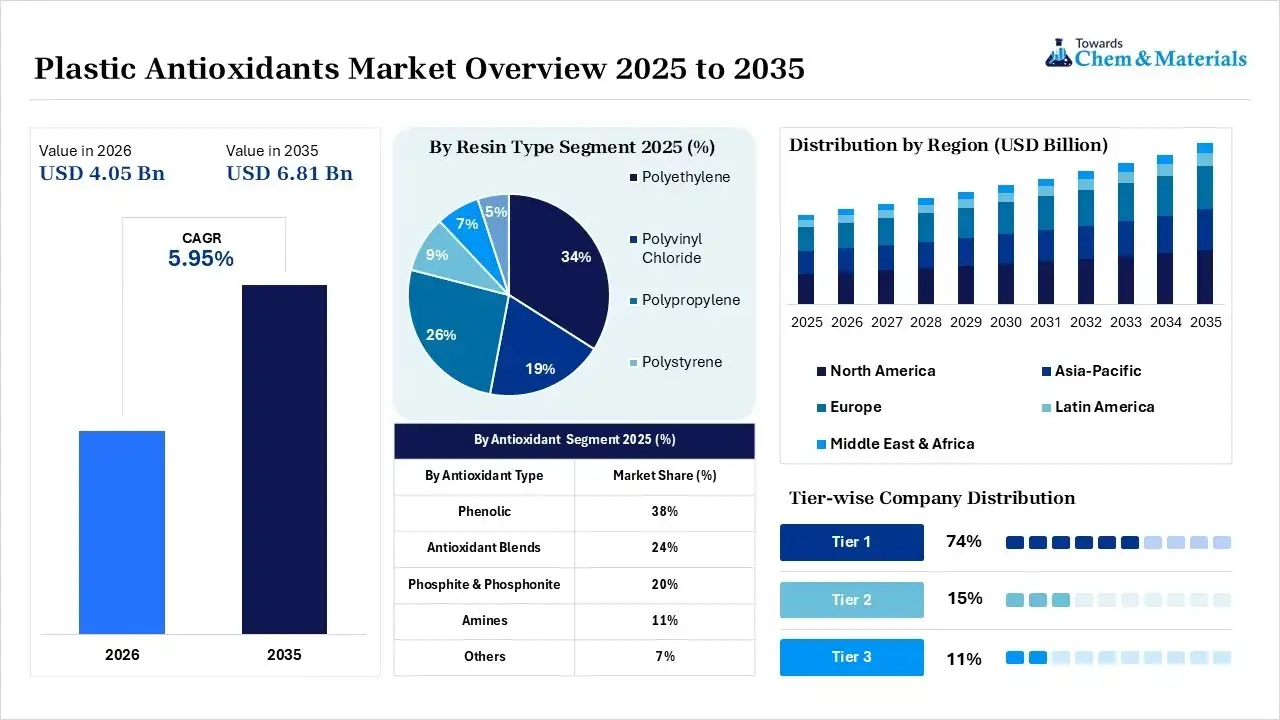
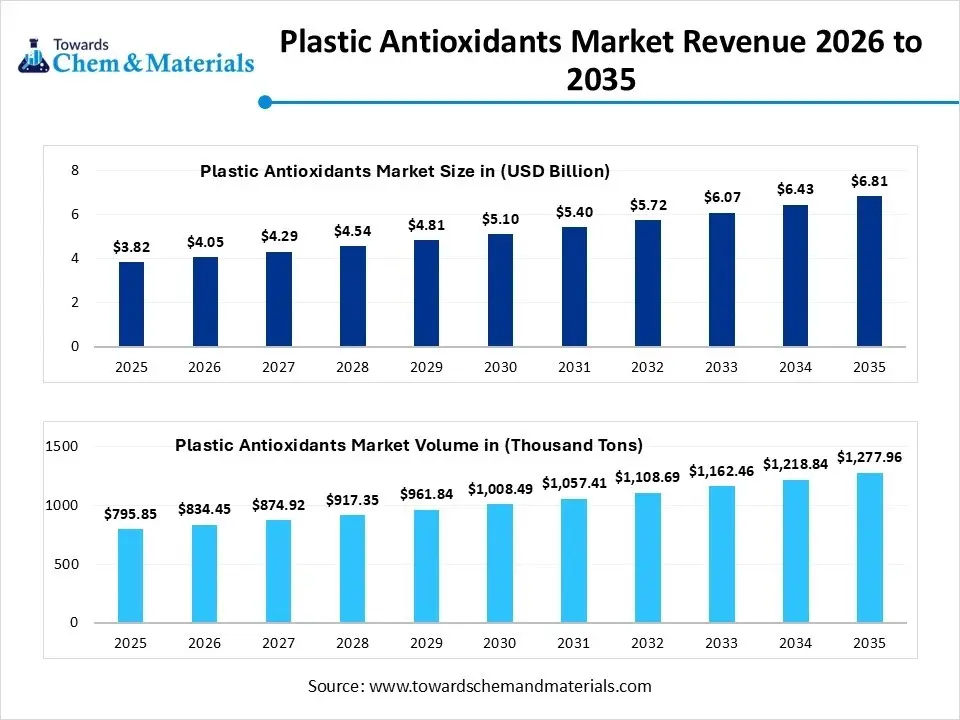
The global plastic antioxidants market size was valued at USD 3.82 billion in 2025, is estimated to reach USD 4.05 billion in 2026, and is projected to reach USD 6.81 billion by 2035, exhibiting a compound annual growth rate (CAGR) of 5.95% over the forecast period from 2026 to 2035.Asia Pacific dominated the plastic antioxidants market with the largest revenue share of 45% in 2025 and is expected to grow at the fastest CAGR of 6.07% during the forecast period. Plastic antioxidants are chemical additives that protect plastics from breaking down due to heat, oxygen, and light. They are mixed into polymers during manufacturing to extend product lifespan. Recent launches focus on improving recycled plastics and creating eco-friendly alternatives, according to the latest report.
 Market Highlights
- By region, Asia Pacific dominated the market with a share of 45% in 2025. Expanding polymer production strengthens additive demand.
- By region, North America held 22% market share in 2025 and is expected to experience the fastest growth with a CAGR of 6.6% in the forecast period. Advanced polymer processing supports market growth.
- By antioxidant type, the phenolic segment dominated the market with a 38% share in 2025. Provides excellent long-term thermal stability across major polymers.
- By antioxidant type, the antioxidant blends segment held 24% market share in 2025 and is expected to have the fastest growth with a CAGR of 6.8% in the forecast period. Multi-functional stabilizer packages improve polymer lifespan.
- By resin type, the polyethylene segment dominated the market with a 34% share in 2025. Large-scale packaging production drives additive demand.
- By resin type, the polypropylene segment held 26% market share in 2025 and is expected to have the fastest growth with a CAGR of 6.4% in the forecast period. Automotive lightweighting increases polypropylene use.
- By application, the food & beverages segment dominated the market with 31.0% share in 2025. Food packaging requires oxidation-resistant polymers.
- By application, the automotive segment held 28% market share in 2025 and is expected to have the fastest growth with a CAGR of 6.50% in the forecast period. Lightweight vehicle production increases polymer consumption.
According to Towards Chemicals and Materials Analytics and Consulting, the global plastic antioxidants market volume was valued at 795.85 thousand tons in 2025 and is expected to surpass around 1,277.96 thousand tons by 2035, accelerating a compound annual growth rate (CAGR) of 4.85% over the forecast period from 2026 to 2035.
Market Overview
What Is the Significance of the Plastic Antioxidants Market?
Plastic antioxidants are crucial chemical additives that protect polymers from heat, light, and oxygen exposure. They prevent plastics from becoming brittle, cracking, or changing color. By extending the lifespan and structural integrity of plastics, this multi-billion-dollar market underpins major global industries like automotive, packaging, and construction. Plastics can easily break down when exposed to heat and oxygen during manufacturing. Antioxidants stop this process, ensuring plastics maintain their strength and flexibility.
These additives are vital for keeping plastic products functional over time. They are heavily used in car parts, wire coatings, and medical devices. The automotive and aerospace sectors use stabilized plastics instead of heavier metals to improve fuel efficiency. Antioxidants make this possible by ensuring the plastic parts stay durable under the hood. Stricter environmental rules are pushing manufacturers to create safer, bio-based antioxidants. The industry is shifting toward formulations that support the recycling and reuse of plastics.
- For instance, Dover Chemical Corporation launched the DoverCycle platform in September 2025. It expands the Doverphos LGP-12 liquid phosphite line to improve the processing of high-recycled plastics.(Source: www.doverchem.com)
Growing Demand From the Construction Industry Propels Market Growth
The growing urbanization and increasing infrastructure, residential, and commercial development increase demand for various plastic materials like roofing, pipes, and wiring, which fuels demand for plastic antioxidants. The growing demand for construction materials that can sustain in harsh conditions like moisture exposure, direct sunlight, and temperature fluctuations increases demand for plastic antioxidants to prevent weakening, cracking, and discoloration.
The growing demand for polypropylene and polyethylene wiring, siding, pipes, and roofing increases the demand for antioxidants to prevent thermal degradation and oxidation. The growing demand for high-performance plastic materials in construction fuels demand for antioxidants. The increasing demand for lightweight and cost-effective construction materials fuels demand for plastic materials. Plastic antioxidants are widely used in pipes, films, laminates, fittings, adhesives, window frames, floor covering, door frames, and many other construction projects. The growing construction activities in various regions are a key driver for the plastic antioxidants market.
Market Trends
- The Growing Demand from the Automotive Sector: The growing automotive sector is a key consumer of plastic antioxidants. The growing shift of the automotive industry towards plastic components for various vehicle parts, like under-the-hood components, dashboards, and bumpers, increases demand for plastic antioxidants to prevent degradation and maintain integrity. The growing adoption of electric vehicles increases demand for lightweight materials, fueling demand for plastic antioxidants.
- Increasing Demand for Plastics: The growing demand and consumption of plastic in various industries increases demand for plastic antioxidants to enhance the stability and performance of plastic products. The growing demand for plastics in various industries like packaging, electronics, automotive, and construction helps in the market growth.
- The Growing Demand from the Packaging Industry: The growing demand for packaging various products like food & beverages, consumer goods, and many other products increases demand for plastic antioxidants to maintain the integrity of the product and extend the shelf life of products.
- Technological Advancement: The rising technological advancements like nanotechnology based antioxidants, eco-friendly antioxidants, and multifunctional antioxidants increase adoption in various sectors and improve durability, and lower the environmental impact.
Report Scope
| Report Attributes | Details |
| Market Size in 2025 | USD 6.07 Billion |
| Expected Size by 2034 | USD 9.96 Billion |
| Growth Rate from 2025 to 2034 | CAGR 5.65% |
| Base Year of Estimation | 2024 |
| Forecast Period | 2025 - 2034 |
| Dominant Region | Asia Pacific |
| Segment Covered | By Antioxidant Type, By Resin Type, By Application, By Region |
| Key Companies Profiled | Lanxess AG, Clariant AG, Astra Polymers, BASF SE, Syensqo, SONGWON. SI Group, Dover Chemical Corporation, 3V Sigma USA, Eastman Chemical Company, Tosaf Compounds Ltd., Avient Corporation |
Supply Chain Analysis of Plastic Antioxidants Market:
Plastic Antioxidant Production & Processing
- Plastic antioxidants are produced through chemical synthesis and formulation processes to protect polymers from thermal oxidation, heat degradation, and processing-induced aging, thereby improving the durability and service life of plastic products.
- Songwon Industrial manufactures a broad portfolio of polymer stabilizers and antioxidants that protect plastics from thermal and oxidative degradation during processing and throughout their service life. Its products are widely used in packaging, automotive, and consumer goods applications.
- Key Players: BASF, Songwon Industrial, Adeka Corporation, SI Group.
Quality Testing & Certification
- Plastic antioxidants must comply with standards for thermal stability, chemical purity, migration limits, oxidation resistance, and environmental safety before being incorporated into polymer formulations.
- BASF offers antioxidant additives that meet global regulatory and performance requirements for engineering plastics, packaging materials, and high-performance polymer applications, helping maintain polymer quality during processing and end use.
- Key Authorities & Standards: International Organization for Standardization, ASTM International, European Chemicals Agency, U.S. Food and Drug Administration.
Distribution to End-Use Industries
- Plastic antioxidants are supplied to packaging manufacturers, automotive companies, construction material producers, electrical and electronics manufacturers, healthcare product manufacturers, and consumer goods industries.
- Adeka Corporation supplies polymer additives, including antioxidants and light stabilizers, for engineering plastics and polyolefins, enabling manufacturers to enhance product durability, thermal stability, and long-term performance across industrial applications.
- Key Suppliers: BASF, Songwon Industrial, Adeka Corporation.
Plastic Antioxidant Production & Processing
- Plastic antioxidants are produced through chemical synthesis and formulation processes to protect polymers from thermal oxidation, heat degradation, and processing-induced aging, thereby improving the durability and service life of plastic products.
- Songwon Industrial manufactures a broad portfolio of polymer stabilizers and antioxidants that protect plastics from thermal and oxidative degradation during processing and throughout their service life. Its products are widely used in packaging, automotive, and consumer goods applications.
- Key Players: BASF, Songwon Industrial, Adeka Corporation, SI Group.
Quality Testing & Certification
- Plastic antioxidants must comply with standards for thermal stability, chemical purity, migration limits, oxidation resistance, and environmental safety before being incorporated into polymer formulations.
- BASF offers antioxidant additives that meet global regulatory and performance requirements for engineering plastics, packaging materials, and high-performance polymer applications, helping maintain polymer quality during processing and end use.
- Key Authorities & Standards: International Organization for Standardization, ASTM International, European Chemicals Agency, U.S. Food and Drug Administration.
Distribution to End-Use Industries
- Plastic antioxidants are supplied to packaging manufacturers, automotive companies, construction material producers, electrical and electronics manufacturers, healthcare product manufacturers, and consumer goods industries.
- Adeka Corporation supplies polymer additives, including antioxidants and light stabilizers, for engineering plastics and polyolefins, enabling manufacturers to enhance product durability, thermal stability, and long-term performance across industrial applications.
- Key Suppliers: BASF, Songwon Industrial, Adeka Corporation.
Market Opportunity
The Growing Expansion of E-Commerce Demands Plastic Antioxidants
The growing expansion of e-commerce is due to factors like increased consumer spending, 24/7 shopping, rising smartphone adoption, and increasing internet penetration, which increases demand for plastic packaging. The growing demand for plastic packaging in the e-commerce sector increases demand for plastic antioxidants for extending product shelf life. The growing demand for longer shelf life of products and reliable packaging increases the adoption of plastic antioxidants. The growing online shipping volume fuels demand for plastic antioxidants to prevent degradation during transit and storage.
The packaging during transit is exposed to various conditions like sunlight exposure & temperature fluctuations, fueling demand for antioxidants to keep packaging intact and protect plastic from various stressors. The growing e-commerce sector increases demand for sustainable packaging, which fuels demand for sustainable plastic antioxidants. The packaging of delicate & perishable items needs robust plastic materials, driving demand for antioxidants. The growing expansion of the e-commerce sector creates opportunities for market growth.
Market Challenge
Fluctuations in Raw Material Prices Restrict Plastic Antioxidants Growth
Despite several benefits of plastic antioxidants, the fluctuations in raw materials limit the adoption of plastic in various industries. Factors like geopolitical events and supply & demand dynamics are responsible for fluctuating raw material prices. The fluctuations in petrochemical prices directly affect the plastic antioxidants. Fluctuation in oil prices due to factors like geopolitical tension and growing production increases the cost of antioxidants. The various geopolitical events, like political instability, geopolitical tensions, and trade wars, are responsible for fluctuations in raw materials prices. The growing demand for plastic antioxidants increases the cost. The factors, like natural disasters, affect the raw materials prices. The fluctuations in raw material prices hamper the growth of the plastic antioxidants market.
Segmental Insights
Antioxidant Type Insights
The phenolic segment led the plastic antioxidants market in 2025. The growing demand from key industries like construction, automotive, and packaging helps in the market growth. Phenolic antioxidants have excellent thermal stability and prevent degradation. They prevent the oxidation of plastic materials and protect against thermal degradation. The helps to preserve color and maintain the mechanical strength of plastics. The growing innovation in phenolic antioxidants increases adoption in modern plastic formulations. The growing demand from polypropylene and polyethylene applications drives the overall market growth.
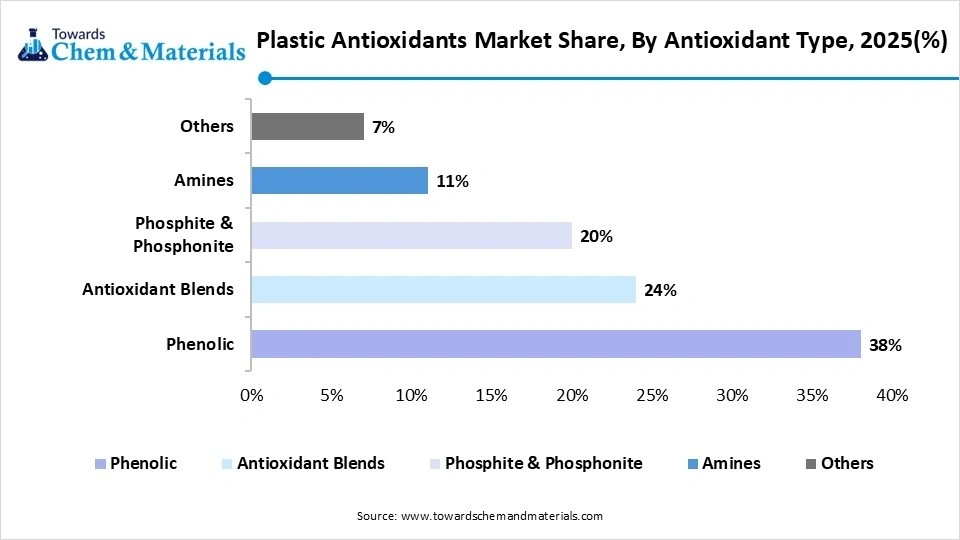 The antioxidant blend segment is the fastest growing in the market during the forecast period. The growing focus on sustainability increases demand for an antioxidant blend for extending the lifespan of plastics. Antioxidant blend is a mixture of different types of antioxidants, like phosphite and phenolic. They protect against oxidation, heat, and light. They extend lifespan and enhance the durability of plastics. Antioxidant blends prevent loss of mechanical strength, discoloration, and brittleness. The growing demand for high-performance plastics in various applications like medical devices, automotive, and aerospace drives the overall growth of the market.
Resin Type Insights
The polyethylene segment dominated the plastic antioxidants market in 2025. The growing demand from diverse applications like bottles, agricultural films, packaging films, and containers helps in the market growth. Polyethylene lowers the environmental impact of packaging and improves the recyclability of plastic materials. It helps to prevent degradation caused due to UV radiation, oxidation, and heat. The growing demand for lightweight materials in the automotive sector and the expansion of the automotive sector are increasing the demand for polyethylene. Additionally, the growing demand for flexible packaging in the pharmaceuticals and food & beverage industry supports the market growth.
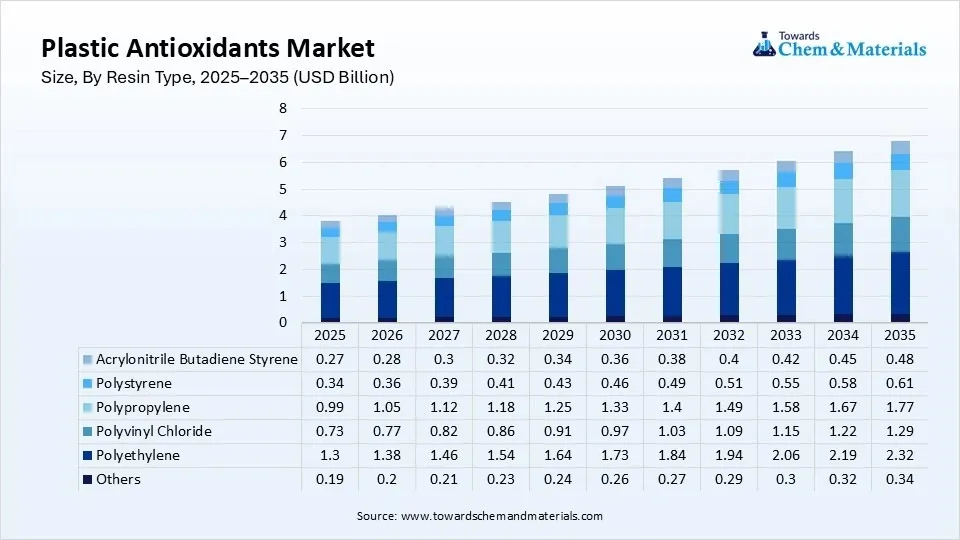
The polyvinyl chloride is experiencing the fastest growth in the market during the forecast period. The growing demand from infrastructure projects and healthcare applications helps in the market growth. Polyvinyl chloride maintains the chemical and physical properties of plastics and extends their lifespan. Additionally, growing demand from various industries like electrical wiring, consumer goods, construction, and medical devices drives the overall growth of the market.
Application Insights
The food & beverages segment led the plastic antioxidants market in 2025. The growing demand for packaged food and processed snacks increases demand for plastic antioxidants to extend shelf life. The growing demand for the preservation of food & beverages and preventing oxidation fuels demand for plastic antioxidants. The growing demand for various food & beverages like fats, bakery items, snacks, oils, processed meats, and beverages helps in the market growth. The growing demand for maintaining the integrity of food packaging fuels demand for plastic antioxidants. The growing consumer demand for a wide range of food & beverage items drives the overall growth of the market.
The automotive segment is the fastest growing in the market during the forecast period. The growing demand for lightweight vehicles increases the adoption of plastic antioxidants for various plastic components, like under-the-hood components. The rise of electric vehicles in various regions increases demand for lightweight plastic materials, helping in the market growth. The rising utilization of plastic in vehicles improves fuel efficiency and minimizes weight, which increases demand for plastic antioxidants to enhance performance and extend longevity. Plastic antioxidants are widely used in automotive parts like dashboards, interior trim, bumpers, and steering wheels. The growing demand for high-performance antioxidants in the automotive industry supports the overall market growth.
Regional Insights
How did Asia Pacific dominate the Plastic Antioxidants Market in 2025?
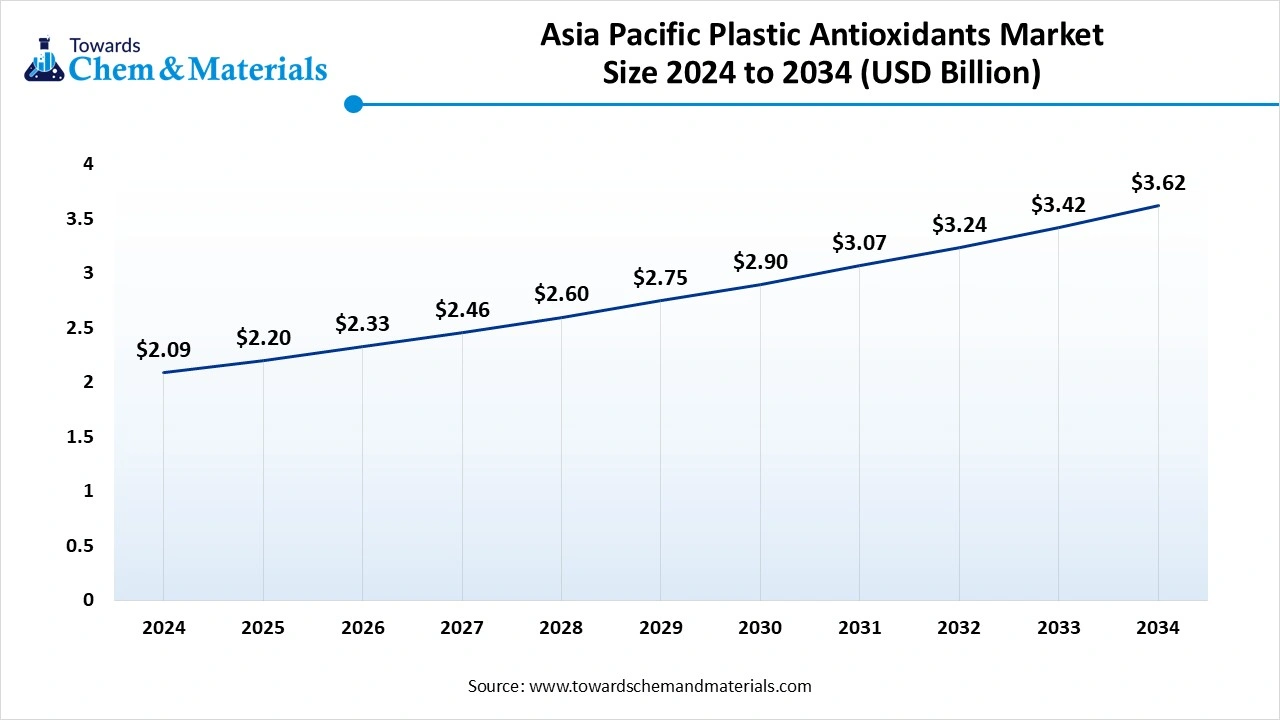
The Asia Pacific plastic antioxidants market size was estimated at USD 1.72 billion in 2025 and is projected to reach USD 3.10 billion by 2035, growing at a CAGR of 6.07% from 2026 to 2035.Asia Pacific dominated the market with the largest share of 45% in 2025. This success was primarily driven by rapid industrialization, a massive manufacturing base for polymers, and growing consumer demand in countries like China, India, and Southeast Asia. This success was primarily driven by rapid industrialization, a massive manufacturing base for polymers, and growing consumer demand in countries like China, India, and Southeast Asia. Leading chemical manufacturers benefited from the regions expanding infrastructure development and robust food and beverage manufacturing.
China
Chinas massive car industry creates high demand for strong, lightweight plastic and rubber car parts. Antioxidants help these parts survive extreme heat and environmental wear.The Chinese government encourages high-quality, value-added manufacturing. This pushes companies to use advanced, high-tech antioxidant mixtures instead of basic stabilizers.Antioxidants increase the lifespan of plastics and protect them during the melting process. This allows recycled plastics to be reused more efficiently, matching Chinas environmental and sustainability goals.
India
Initiatives like "Make in India" promote local manufacturing, leading to heavy investments in the domestic chemical and polymer sectors.The demand for packaged, ready-to-eat foods has grown a lot in India. This means businesses need more flexible and safe plastic packaging. Antioxidants are added to these plastics to keep them fresh, strong, and safe for consumers.
North America Plastic Antioxidants Market Growth Factor
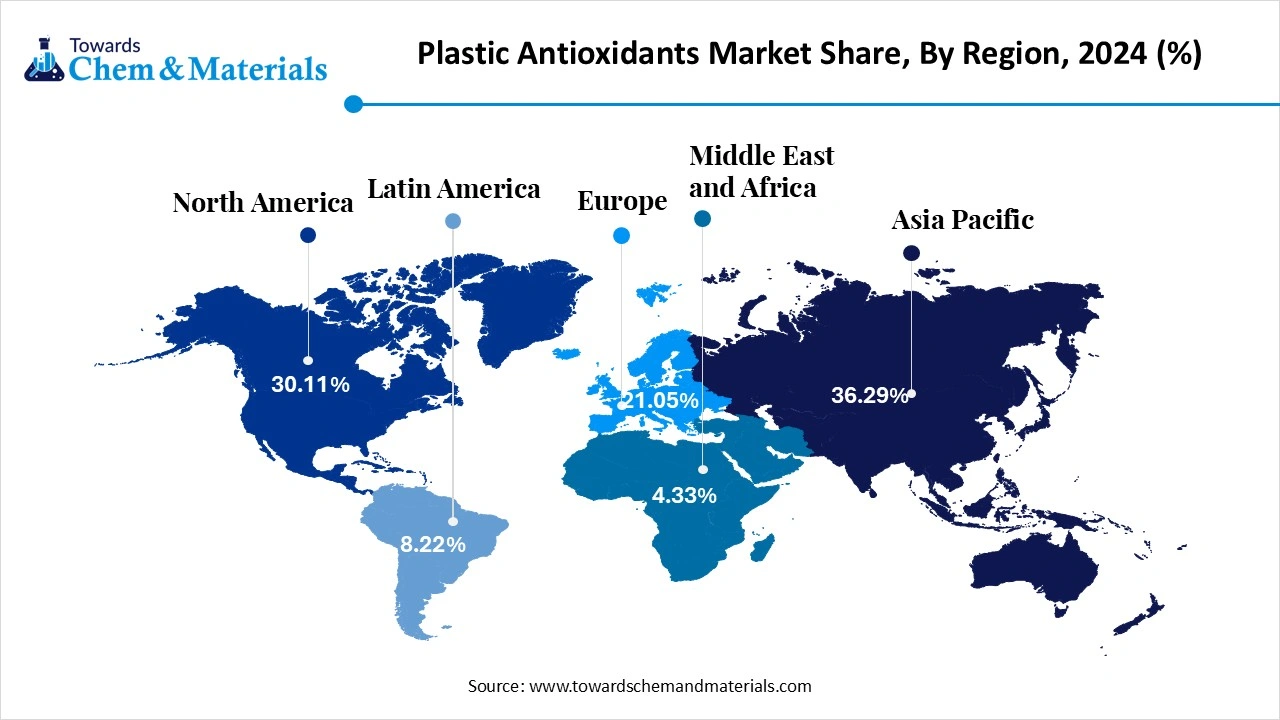
North America held a market share of 22% in 2025 and is expected to grow at the fastest CAGR of 6.6% over the forecast period. Growth is mainly driven by high polymer demand in packaging, automotive manufacturing, and construction industries. Government rules, such as those from the Environmental Protection Agency and the Food and Drug Administration, demand safer, low-VOC materials. This forces manufacturers to use high-performance antioxidants. Government groups like the US Food and Drug Administration (FDA) have strict rules for food packaging. These rules force companies to use high-quality, safe antioxidants. Antioxidants make plastics stronger so they can be recycled more times. This fits the regions goals for a greener environment. Leading material companies like Dow, BASF Corporation, and SI Group support this market by supplying polymers and stabilizers.
United States
The United States plastic antioxidants market is growing rapidly due to the high demand for durable plastics in the automotive, packaging, and construction sectors. Strict government rules for food safety and a strong focus on making plastics more recyclable also force manufacturers to use advanced, high-performance antioxidants to extend the lifespan of polymers.
Canada
Canadian environmental and safety standards push manufacturers to use low-VOC antioxidants in sensitive areas like food packaging and medical devices.
The rapid production of electric vehicles in North America demands premium plastics that can withstand high electrical and thermal loads.
Europe Plastic Antioxidants Market Growth Factor
Europe held a market share of 21% in 2025, primarily driven by strict environmental regulations, the shift toward a circular economy, and the need to maintain the durability of recycled plastics. High-performance stabilizers are also in massive demand from key end-use sectors like packaging, automotive, and construction. Laws by agencies like the European Chemicals Agency (ECHA) push for safer, non-toxic, and eco-friendly chemical formulations. Europe is highly focused on reducing plastic waste.
Germany
Germany is a global hub for car manufacturing. Companies use advanced plastics to make vehicles lighter and more fuel-efficient, requiring high-quality antioxidants to ensure these parts last a long time.Germany enforces strict safety and eco-friendly regulations. This forces manufacturers to use premium antioxidants to meet high safety and recycling standards.
France
The French plastic antioxidants market is growing rapidly, driven by the shift toward a circular economy and the rising demand for high-performance plastics in the packaging and automotive sectors.Strict environmental laws in France and Europe are forcing manufacturers to use better, safer plastic formulations. These rules require the industry to produce more reliable and long-lasting plastic products, boosting the need for advanced polymer stabilization technologies.
Latin America Plastic Antioxidants Market Growth Factor
Latin America held a market share of 7% in 2025, expanding due to a rising demand for durable plastics in packaging, automotive manufacturing, and building. Plastic antioxidants are essential additives that protect plastic materials from breaking down due to heat, light, and oxygen, allowing products to last longer. The region’s rising automotive production demands lighter, more durable plastic parts. Antioxidants prevent these parts from cracking or fading when exposed to engine heat and sunlight.
Brazil
Brazil leads passenger car production in South America. Car makers rely on advanced plastics for vehicle parts. These parts need antioxidants to survive harsh engine heat.Plastic is used heavily in Brazil for food packaging and farm films. Antioxidants stop the plastic from cracking or breaking down under sunlight (UV exposure).
Argentina
The Argentine auto industry uses more lightweight, durable plastic components to make vehicles safer and more fuel-efficient. These plastic parts must resist high engine temperatures and weather damage.An increase in processed food packaging and modern building materials has drastically raised the consumption of high-performance plastics in the region.
Middle East & Africa Plastic Antioxidants Market Growth Factor
The Middle East & Africa held a market share of 5% in 2025. This growth is driven by the regions rapid industrialization, expanding petrochemical manufacturing, and major government-led infrastructure projects. The Middle East is a global hub for oil and gas. Countries heavily invest in turning raw petroleum into cheap, high-quality plastic raw materials. Because production is local, the demand for additive chemicals to finish the plastic skyrockets.
Saudi Arabia
The Saudi Arabia plastic antioxidants market is growing rapidly. This growth is mainly driven by expanding petrochemical industries, surging packaging demands, and massive infrastructure projects under Vision 2030.
Saudi Arabia has a strong, expanding base for producing raw plastics like polypropylene and polyethylene. These plastics need antioxidants during production to prevent them from melting or degrading.
UAE
The UAE uses a lot of polyvinyl chloride (PVC) in building and smart city projects. Antioxidants keep these PVC pipes and window frames from breaking down under heat.The UAE produces millions of tons of plastic yearly, with a heavy focus on food packaging. Antioxidants are needed to keep this packaging safe and sturdy.The Abu Dhabi National Oil Company supplies cheap, high-quality raw materials like polyethylene and polypropylene, which fuel large-scale local plastic production.
Recent Developments
- In June 2026, AJE Group, producers of Big Cola and Cifrut, launched Cielo, a new 740ml antioxidant-enriched functional beverage, in the Nigerian consumer market. The product directly targets a growing consumer lifestyle pivot toward health-conscious, guilt-free liquid refreshment.(Source: thenationonlineng.net)
- In March 2026, the Ghana Food and Drugs Authority (FDA) launched a sweeping nationwide market surveillance and laboratory investigation into the intentional chemical contamination of locally sold plantain chips.(Source: www.trtafrika.com)
- In June 2026, DRUERA officially launched its expanded five-blend Ceylon Cinnamon Tea collection featuring authentic, premium Alba-grade cinnamon packed inside plastic-free, plant-based Soilon® biodegradable pyramid tea bags.(Source: www.usatoday.com)
- In January 2026, Avient Corporation officially commercialised its Hiformer™ Non-PFAS Process Aid with Antioxidants (AO) in the Latin American market. The single-additive liquid solution satisfies the rising regulatory and consumer pressure for non-fluorinated options.(Source: www.indianchemicalnews.com)
Top Companies List
- Lanxess AG
- Clariant AG
- Astra Polymers
- BASF SE
- Syensqo
- SONGWON. SI Group
- Dover Chemical Corporation
- 3V Sigma USA
- Eastman Chemical Company
- Tosaf Compounds Ltd.
- Avient Corporation
Segments Covered
By Antioxidant Type
- Phenolic
- Hindered Phenolic Antioxidants
- Monofunctional Phenolics
- Multifunctional Phenolics
- Hindered Phenolic Antioxidants
- Antioxidant Blends
- Phenolic-Phosphite Blends
- Multi-Component Stabilizer Packages
- Phosphite & Phosphonite
- Tris(nonylphenyl) phosphite (TNPP)
- Bis(2,4-di-tert-butylphenyl) Pentaerythritol Diphosphite
- Other Organophosphites
- Amines
- Aromatic Amines
- Hindered Amine Stabilizers (HALS)
- Others
- Thioesters
- Lactones
- Natural Antioxidants
- Specialty Stabilizers
By Resin Type
- Polyethylene
- HDPE
- LDPE
- LLDPE
- Polyvinyl Chloride
- Rigid PVC
- Flexible PVC
- Polypropylene
- Homopolymer PP
- Copolymer PP
- Polystyrene
- GPPS
- HIPS
- Acrylonitrile Butadiene Styrene
- Injection Molding Grade
- Extrusion Grade
- Others
- PET
- Polycarbonate
- Polyamide
- Engineering Plastics
By Application
- Food & Beverages
- Food Packaging
- Beverage Packaging
- Automotive
- Interior Components
- Exterior Components
- Under-the-Hood Components
- Pharmaceuticals
- Medical Packaging
- Medical Devices
- Construction
- Pipes & Fittings
- Profiles
- Insulation Materials
- Others
- Electrical & Electronics
- Consumer Goods
- Agriculture
- Industrial Packaging
By Region
- North America
- U.S.
- Canada
- Europe
- Germany
- UK
- France
- Italy
- Spain
- Sweden
- Denmark
- Norway
- Asia Pacific
- China
- Japan
- India
- South Korea
- Thailand
- Latin America
- Brazil
- Mexico
- Argentina
- Middle East & Africa
- South Africa
- UAE
- Saudi Arabia
- Kuwait
A Seven-Phase Framework
Our methodology is designed to be universally applicable across commodity chemicals, specialty chemicals, petrochemicals, construction chemicals, coatings, electronic chemicals, industrial gases, agrochemicals, water treatment chemicals, and performance materials. Each phase builds upon the last, creating a layered validation structure that minimizes estimation error and maximizes analytical confidence.
The framework ensures comprehensive market coverage, robust cross-validation, and reliable long-term forecasting — producing market estimates that withstand scrutiny from investors, regulators, and corporate strategy teams.

Seven-Phase Framework — Analytical Effort Distribution
Relative analytical effort allocated across each phase of the Chemicals & Materials research framework

Phase 1 - Secondary Research: Establishing the Foundation
Secondary research collects and evaluates publicly available information from authoritative sources, establishing the foundational understanding of market structure, value chain dynamics, competitive landscape, and end-use demand patterns. Every source is evaluated for credibility, recency, geographic relevance, and methodological soundness before inclusion.
Industry Associations
Sources include ACC, CEFIC, ICCA, JCIA, CPCIF, and SOCMA providing production volumes, consumption trends, capacity developments, and sustainability initiatives.
Company Disclosures
Annual reports, investor presentations, earnings transcripts, and regulatory filings reveal product portfolios, manufacturing footprints, capacity expansions, and revenue segmentation.
Government Databases
National statistical offices, customs authorities, environmental agencies, and industrial production databases provide verified statistics on output, trade flows, and regulatory compliance.
Trade Databases
UN Comtrade, ITC, Eurostat, and national customs authorities enable assessment of global product movement, import dependency, and export competitiveness across regions.
Our Secondary Research Sources
- Ministry of Chemicals and Fertilizers
- European Chemicals Agency
- United States Department of Energy
- Ministry of Industry and Information Technology
- Ministry of Economy Trade and Industry
- Ministry of Trade Industry and Energy
- National Institute of Standards and Technology
- Council of Scientific and Industrial Research
- Fraunhofer Society
- National Institute for Materials Science
Phase 2 — Supply-Side Assessment: Mapping Production Capabilities
Production Capacity Analysis
All major manufacturers are assessed for existing installed capacity, planned additions, expansions, new plant announcements, and technology adoption — mapped at global, regional, and country levels.
Capacity Utilization Adjustment
Installed capacity is adjusted using utilization rates based on demand conditions, feedstock availability, plant operating rates, maintenance schedules, and regulatory restrictions.
Manufacturer Revenue Analysis
Product-specific revenues, segment-level performance, regional distribution, average selling prices, and margin trends are evaluated to establish market value estimates.
Supply-Side Assessment — Capacity vs. Effective Production by Region
Illustrative comparison of installed capacity vs. effective production volume (after utilization rate adjustment) across major regions

Phase 3 — Demand-Side Assessment: Quantifying Chemical Consumption
Demand-side analysis quantifies chemical consumption across industries, applications, and geographies — identifying where and how chemicals are consumed throughout the value chain with precision.
End-Use Industry Analysis
Chemical demand is evaluated across automotive, construction, packaging, electronics, agriculture, healthcare, consumer goods, industrial manufacturing, energy and utilities, and water treatment. Industry output, production trends, and consumption intensity are analyzed to determine demand patterns.
Consumption Modeling
Demand is estimated using measurable indicators: kilograms per vehicle, kilograms per square meter of construction, dosage per cubic meter of water treated, kilograms per hectare of agricultural land, and kilograms per ton of manufactured products. Consumption factors are validated through industry publications and primary interviews.
Application Analysis
The market is segmented by application area to understand product performance requirements, formulation trends, technology adoption, customer preferences, and regulatory requirements improving demand accuracy and segmentation granularity.
Demand-Side Assessment — End-Use Industry Demand Distribution
Illustrative distribution of chemical & materials demand across key end-use industries

Phase 4 - Trade Flow Analysis: Balancing Regional Supply and Demand
Trade flow analysis reconciles regional supply and demand estimates through import and export data, identifying net supply positions, regional dependencies, and market imbalances. It serves as an independent validation layer that tests the consistency of supply-side and demand-side estimates.
Import Analysis
Import data is evaluated to determine volumes, source countries, product dependency, regional supply gaps, and pricing trends — identifying markets that rely heavily on external supply and where domestic production is insufficient to meet demand.
Export Analysis
Export assessments reveal production surplus, export competitiveness, regional manufacturing strength, and global market participation. Export patterns also help validate domestic production estimates and identify net exporting regions.
Apparent Consumption Model
Regional consumption is assessed using the standard apparent consumption formula:
Results identify net importing regions, net exporting regions, regional deficits, and surpluses — serving as an independent validation of supply and demand estimates.
Trade Flow Analysis — Net Supply Position by Region
Illustrative apparent consumption vs. domestic production across major regions — positive gap indicates net import dependency

Phase 5 — Primary Research: The Critical Validation Layer
Primary research tests and refines findings from secondary research through direct engagement with industry participants across the supply chain, demand side, and expert community. It captures intelligence that no database or published report can provide — the real-world experience of manufacturers, buyers, and specialists operating in the market.

Supply-Side Interviews
Conversations with chemical manufacturers, raw material suppliers, contract manufacturers, technology providers, and plant operators cover production trends, capacity utilization, pricing developments, technology shifts, and competitive dynamics.

Demand-Side Interviews
Engagement with OEMs, industrial consumers, procurement managers, distributors, formulators, and end-use manufacturers focuses on consumption trends, purchasing behavior, product substitution, demand outlook, and emerging applications.

Industry Expert Consultations
Additional interviews with industry consultants, independent experts, regulatory specialists, technical professionals, and research institutions provide deeper market context and validate key analytical assumptions.
Focus Areas of Primary Research:
Market Size & Forecast Validation
Revenue estimates, volume consumption, growth rates, forecast assumptions, regional demand.Supply Chain & Value Chain Assessment
Raw material sourcing, supply chain challenges, distribution networks, procurement practices.Production & Capacity Analysis
Manufacturing capacity, utilization rates, expansion projects, plant investments.Pricing & Cost Structure Analysis
Product pricing trends, feedstock costs, energy costs, margin pressures, pricing outlook.Competitive Landscape Assessment
Volume and value estimates confirmed to be fully consistent with one another before publicationInterview Volume by Market Scope
| Study Scope | Number of Interviews |
|---|---|
| Niche Market | 20 – 30 |
| Mid-Sized Market | 30 – 50 |
| Global Market | 50 – 80 |
| Highly Fragmented Market | 80 – 120 |
Interview Details:
Category : Manufacturers, Suppliers, Distributors, End Users, Experts/Associations
Average Duration : 30–60 Minutes
Interview Mode : Video calls, telephonic interviews, expert consultations
Interview Format : Structured / Semi-Structured questionnaire
Focus Areas of Primary Research:
Market Size & Forecast Validation :
Revenue estimates, volume consumption, growth rates, forecast assumptions, regional demand.
Supply Chain & Value Chain Assessment :
Raw material sourcing, supply chain challenges, distribution networks, procurement practices.
Production & Capacity Analysis :
Manufacturing capacity, utilization rates, expansion projects, plant investments.
Pricing & Cost Structure Analysis :
Product pricing trends, feedstock costs, energy costs, margin pressures, pricing outlook.
Competitive Landscape Assessment :
Market share, competitor positioning, strategic initiatives, partnerships, acquisitions.
Primary Research — Stakeholder Coverage by Category
Distribution of interview respondents across stakeholder categories (% share from PPT data)

Primary Research — Respondent Designation Profile
Seniority breakdown of interview respondents (% share from PPT data)

Primary Research — Geographic Coverage of Interviews
Regional distribution of primary research engagement (% share from PPT data)

Phase 6 — Data Triangulation and Market Validation
No single methodology is relied upon in isolation. Multiple independent estimation approaches are combined and reconciled to ensure consistency, accuracy, and analytical defensibility. Any material deviations between approaches are investigated and adjusted through additional validation cycles.
The final market size is derived through weighted triangulation of all validated methodologies. Any material deviations between approaches are investigated and adjusted through additional validation cycles. The outcome represents the most realistic assessment of the market based on available evidence and expert confirmation ensuring that volume and value estimates are fully consistent with one another.
Triangulation Framework — Input Contribution Weight
Relative weight each sizing input contributes to the final reconciled market estimate

Phase 7 — Forecast Modeling: Projecting Future Market Evolution
Forecasting evaluates the future trajectory of the market using a combination of quantitative indicators and qualitative assessments across economic, industry, and regulatory dimensions. Rather than simple extrapolation, each driver is independently modeled and integrated into a composite forecast.
Macroeconomic Indicators
GDP growth, industrial production, manufacturing output, construction activity, consumer spending, and capital investment form the quantitative foundation of long-term demand projections. These are applied at country, regional, and global levels.
Industry Growth Drivers
Urbanization, infrastructure development, industrialization, technological innovation, sustainability initiatives, and evolving product performance requirements are assessed at regional and industry levels — capturing both structural and cyclical demand drivers.
Capacity Expansion Analysis
Announced plant expansions, new manufacturing facilities, technology upgrades, and strategic investments are evaluated to determine future supply-demand dynamics and potential market tightness or oversupply situations.
Regulatory & Sustainability
Environmental regulations, chemical safety standards, emission reduction targets, circular economy initiatives, and sustainability requirements are incorporated as they often influence product adoption rates and market growth trajectories.
Scenario Forecast Range — Indexed Market Growth (Year 1–10)
Illustrative indexed growth trajectories across Base, Optimistic, and Pessimistic scenarios over a 10-year forecast horizon

Forecast Drivers — Relative Impact Score by Category
Impact score (0–100) of each driver type on chemicals & materials market forecast




Comments
Share your thoughts, ask a question, or provide feedback about this report.