
What is the North America Petrochemical Market Size and Share?
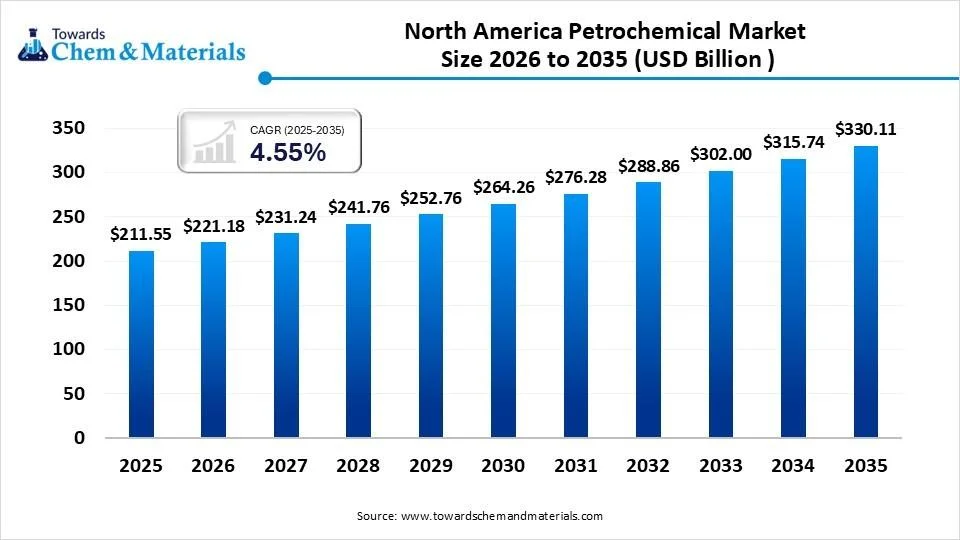
The North America petrochemical market size was valued at USD 211.55 billion in 2025 and is projected to grow from USD 221.18 billion in 2026 to USD 330.11 billion by 2035, exhibiting a CAGR of 4.55% during the forecast period. Shale-advantaged ethane feedstock, world-scale Gulf Coast cracker capacity, and a growing surplus of exportable polyethylene define the market structure, while specialty and circular polymers are the fastest-growing segments. The report delivers market sizing, segmentation, pricing, demand-supply, value chain, trade, technology, and regulatory analysis, along with competitive benchmarking, market share estimates, M&A coverage, and profiles of 23 leading participants across the U.S., Canada, and Mexico.
Key Takeaways
- Shale-Advantaged Feedstock Strengthens North America’s Cost Position
- Ethane accounts for about 72% of U.S. cracker feedstock, giving regional producers a structural cost advantage over naphtha-based competitors.
- Olefins and Derivatives Dominate the Regional Market
- Olefins and derivatives account for approximately 58–60% of the North American petrochemical market, led by ethylene, polyethylene, polypropylene, PVC, and ethylene glycol.
- Polyethylene Surplus Is Making Export Markets Increasingly Important
- North American polyethylene capacity exceeds 35 million tons annually, while domestic demand absorbs only about 60–65% of output, creating an estimated 8–10 million tons of annual surplus.
- The U.S. Gulf Coast Remains the Region’s Petrochemical Powerhouse
- Large-scale cracker capacity, low-cost ethane, integrated infrastructure, and export terminals reinforce the Gulf Coast’s position as the dominant production and export hub.
- Global Overcapacity Will Keep Commodity Margins Under Pressure
- New capacity in Asia and the Middle East is expected to intensify competition and pressure export prices, favoring producers with low-cost feedstock, scale, and integrated operations.
- Specialty and Circular Polymers Offer Higher-Value Growth Opportunities
- Specialty grades can command premiums of roughly 20–60% over commodity products, while recycled-content and certified circular polymers represent faster-growing opportunities.
- Mexico Emerges as a Key Import-Substitution and Regional Growth Opportunity
- Mexico’s structural dependence on imported polyolefins creates opportunities for local production and nearby U.S. suppliers, particularly in polyethylene and polypropylene.
- Competitive Advantage Through 2035 Will Depend on Cost, Scale, and Product Differentiation
- The strongest positions are likely to combine low-cost feedstock and export access with specialty products, circular polymers, and credible decarbonization strategies.
Overview: Shale-Advantaged Feedstock, Ethane-to-Polyethylene Scale, and Export Orientation Define North American Petrochemical Structure
The U.S. accounts for roughly 80–82% of regional revenue, Canada for about 8–10%, and Mexico for the balance, where import dependence remains structurally high.
Olefins and derivatives (ethylene, propylene, polyethylene, polypropylene, PVC, ethylene glycol) represent the largest revenue pool at about 58–60% of the market. Aromatics and methanol/C1 chemistry are the other major pools. Polyethylene is the single largest product family and is expected to grow at about 5% annually, supported by packaging demand and export penetration. The market is mature in domestic consumption (about 1.5–2.5% volume growth) but expanding at the margin through exports and specialty grades.
North America benefits from one of the world's lowest-cost ethane-based cracking positions. Ethane represents approximately 72% or more of U.S. cracker feedslate, and the region holds roughly 55–60 million tons per year of ethylene capacity. Structurally, the market is moderately concentrated: the top 10 producers control an estimated 65–75% of ethylene capacity.
The full report quantifies the market by product chain, feedstock, application, end-use industry, country, and company.
Key Coverage
- 2026–2035 forecast revenue and volume
- Country contribution (U.S., Canada, Mexico)
- Product-chain share and growth contribution
- Fastest-growing and declining segments
- Concentration and maturity indicators
- Base, upside and downside scenarios
Segmentation Analysis Olefins and Derivatives Dominated the Market in 2025
- By product, the olefins and derivatives segment dominated the market with the largest share of 58–60% in 2025, followed by methanol and C1 derivatives (about 10–12%), aromatics and derivatives (about 15–18%), and other intermediates.
- By feedstock, the ethane-based segment dominated the market with the largest share of 72% in 2025, with propane/butane and naphtha providing the balance, mostly in refinery-integrated sites.
- By application, the packaging segment dominated the market with the largest share of 32–35% in 2025, followed by construction 20–25%, automotive and transportation 10–12%, consumer goods and electrical/electronics 10–15% combined, and industrial uses the remainder.
The report provides full revenue, volume, share, and CAGR matrices across product, feedstock, application, and geography.
Market Dynamics: Feedstock Spread, Export Competitiveness, and Policy Uncertainty are Reshaping Returns
- Drivers: The petrochemical market benefits from a structural ethane cost advantage, which has historically kept producers in the lower-cost quantity globally. Growing export infrastructure, along with steady demand from packaging and healthcare applications, also provides a strong and relatively resilient demand base.
- Restraints: Global overcapacity, especially from new polyethylene capacity in Asia, continues to put pressure on margins. During the market downturns, EBITDA margins can decline by an estimated 5–10 percentage points, while higher compliance requirements and capital spending further increase operating costs.
- Opportunities: New opportunities emerging from chemical recycling, bio-attributed feedstocks, carbon capture, and hydrogen-based process heating. These technologies can help producers reduce emissions while creating higher-value and more sustainable product offerings.
- Challenges: Rising tariffs and trade restrictions could limit export opportunities and increase market uncertainty. At the same time, plastics-reduction regulations and extreme-weather events affecting Gulf Coast operations could disrupt production, supply chains, and overall profitability.
Which Pricing Dynamics Will Determine Margin Resilience for North American Petrochemical Producers Through 2035?
Commodity polyethylene trades in a range of USD 900–1,500/ton, while premium and specialty grades command a 20–60% premium. Ethylene contract pricing generally sits at USD 500–1,000/ton, whereas propylene and aromatics pricing is more closely tied to refinery economics and crude. Feedstock represents 50–70% of ethylene cash cost, and ethane-based production sits at the low end of the global cost curve, while naphtha-based competitors face materially higher costs. Price pass-through is typically 70–90% within a quarter on contract-indexed products but is lower for exports into oversupplied markets. Distributor margins run at approximately 8–15% on commodity polymers and higher for specialty grades, and logistics (rail, pipeline, export terminals and containerized resin) represents an estimated 5–10% of delivered price.
Our analysis indicates that margin resilience in this market is determined less by the price a producer achieves than by where it sits on the cost curve. The USD 600 per ton spread between the bottom and top of the commodity polyethylene range is broadly a function of cycle position, whereas the feedstock share of ethylene cash cost (50–70%) means that ethane-advantaged producers retain positive cash margins even in trough conditions that squeeze higher-cost competitors. Our assessment is that the strong contract pass-through (70–90% within a quarter) cushions domestic sales, while the weaker pass-through on exports to oversupplied markets exposes producers to the cycle at the margin where incremental volume is growing fastest. Because logistics costs of 5–10% of delivered price are largely fixed in structure, we believe export netbacks are more sensitive to freight and terminal costs than headline price benchmarks suggest.
In our view, the most significant implication is that value will migrate toward producers that combine low-cost feedstock with specialty and certified circular grades. The 20–60% premium on differentiated grades, together with the higher distributor margins they support, creates a pricing buffer that commodity volumes cannot offer. We expect this to widen the gap between integrated, specialty-exposed producers and commodity-only or naphtha-dependent players, particularly as export volumes grow in markets where price pass-through is weakest. From our assessment, this creates an opportunity for producers to shift product mix toward premium grades and for buyers to negotiate on formula-based indexation rather than spot exposure.
The full report provides price benchmarks by product, grade and region, a 10-year price forecast and margin sensitivity analysis covering feedstock, crude, freight and export-volume scenarios. The same intelligence can also be delivered as a structured pricing database tracking product, grade, region, year, contract versus spot basis, feedstock cost, delivered cost, logistics cost, distributor margin and estimated cash margin. The dataset supports filtering and benchmarking across grades and corridors and complements the strategic report by allowing teams to test their own pricing and margin assumptions against the market view.
Key Coverage
- Product-level price ranges and trends
- Feedstock cost build-up and spreads
- Cost-curve position by feedstock
- Pass-through and elasticity
- Distributor and logistics margins
- Price and margin outlook to 2035
Demand-Supply Analysis: Is North America's Polyethylene Surplus a Temporary Imbalance or a Permanent Feature of the Market?
North American ethylene capacity has grown by roughly 25-30% over the past decade, yet average operating rates have held at about 85-92%. Polyethylene capacity now exceeds 35 million tons per year, and domestic demand absorbs only about 60-65% of output. Market estimates put the regional polyethylene surplus at roughly 8-10 million tons annually, depending on operating rates. Mexico is the clearest deficit market, importing most of its polyolefin needs, while the U.S. Gulf Coast holds the largest surplus. New greenfield projects take 4-6 years from final investment decision to start-up, and scheduled start-ups in the second half of this decade are expected to keep utilization in the high 80s unless demand surprises on the upside.
Our analysis indicates that this surplus is structural, not cyclical. Capacity grew by more than a quarter, and operating rates still stayed high. That only works because exports have absorbed the additional output, so regional utilization now depends on overseas demand as much as on domestic consumption. Our assessment is that Mexico helps but does not solve the problem. It is a natural, nearby outlet for Gulf Coast producers, but its import needs are small, next to a surplus of this size. The rest must be clear in global markets where competing capacity is also being added.
In our view, the most significant implication is a lack of flexibility. With 4–6-year lead times, capacity already under construction will arrive whatever demand does, and producers cannot easily slow or reverse those decisions if export markets weaken. We believe high-80s utilization is a reasonable base case but offers limited cushion, since it assumes export demand keeps pace with new supply. From our assessment, this favors producers with low-cost positions and secure export logistics, which can keep running when others cut rates, and it raises the strategic value of Mexican and other nearby markets as steadier outlets.
Value Chain & Supply Chain: Integrated Producers and Specialty Manufacturers Capture the Highest Margins
The value chain starts with natural gas liquids production and fractionation and moves through steam crackers and PDH units, followed by polymer and intermediate production, compounding, converting, and final end-use applications. Profitability is generally strongest for integrated producers that have access to low-cost feedstock, while specialty compounds and performance polymers can earn significantly higher margins than standard commodity products. Feedstock supply is concentrated among a relatively small number of upstream and midstream companies, making pipeline and fractionation capacity important potential bottlenecks. The market analysis therefore evaluates the cost structure, margin opportunities, and key supply constraints at each stage of the value chain.
Trade & Import Export Analysis Exports Now Absorb a Huge Share of Regional Polymer Output
North America exports around 10–12 million tons of polyethylene and a growing volume of ethane, LPG, and ethylene glycol annually. Key export destinations include Asia Pacific, Latin America, and Europe. Tariffs and trade policy have materially affected flows, especially to China, redirecting volume toward Latin America, Southeast Asia, and India. Intra-regional trade is also substantial, with the U.S. supplying the bulk of Mexican and Canadian imports under preferential arrangements. The full analysis quantifies flows by corridor, product and duty regime.
Technology & Innovation Electrified Cracking, Chemical Recycling, and Carbon Capture Move from Pilot to Early Commercial Scale
Mature technologies (steam cracking, gas-phase and slurry polymerization) dominate. Emerging pathways include electric cracker furnaces, hydrogen-fired heating, pyrolysis-based chemical recycling, and carbon capture integrated with ethylene and ammonia/methanol chains. Announced chemical-recycling capacity in North America exceeds 1 million tons per year, though operating capacity remains a fraction of that. Patent activity is led by catalyst, process-intensification, and recycling technologies. The report tracks commercial deployments, investment values, and technology readiness.
Regulatory & Sustainability Analysis Emissions Rules, Plastics Policy, and Recycled-Content Mandates Reshape Capital Allocation
Regulation is becoming an increasingly important factor in deciding where and how plastics companies invest. The Plastics Engineering article highlights that companies are no longer making investment decisions only based on demand, costs, and margins; they are also planning around regulatory deadlines. Recycled-content requirements, Extended Producer Responsibility (EPR), plastic taxes, and recyclability standards are increasing compliance costs and encouraging companies to invest in recycling capacity, compliant packaging, and secure supplies of recycled materials.
The ScienceDirect study supports this broader view, showing that regulation can influence recycling rates, technology adoption, corporate behavior, and investment across the entire plastic-waste value chain. At the same time, inconsistent rules between countries, unclear waste classifications, reporting requirements, and limited infrastructure can make circular projects more expensive and difficult to scale. Overall, the regulatory direction is pushing capital toward recycling, traceability, sustainable materials, and low-emission technologies, while companies with poor recyclability or high compliance costs may face higher investment and operating risks.
Customer & Application Analysis Packaging Brand Owners and Converters Set Specifications, Price Sensitivity, and Sustainability Demand
Converters buy most of the commodity resin, typically under contract with quarterly or monthly price indexation. Qualification cycles for specialty grades in automotive, medical, and electrical applications run 6–24 months, creating switching costs. Packaging is the largest application, while medical, infrastructure, and high-performance applications are growing faster, at an estimated 5–7% annually. Customer concentration is moderate, with the top converters and brand owners accounting for a meaningful share of demand. Unmet needs include consistent recycled-content supply and lightweight, high-barrier mono-material films.
Competitive Intelligence
Does Scale or Specialization Offer the More Defensible Competitive Position in North American Petrochemicals?
Market concentration is moderate to high. The top five producers are estimated to control about 45-55% of regional ethylene capacity, and the top ten about 65-75%. The landscape spans five groups: integrated majors with upstream, refining and chemicals exposure; chemical pure-plays with scale in polyolefins, chlor-vinyls and intermediates; joint-venture crackers pairing Asian or Middle Eastern capital with U.S. feedstock; specialty and performance-material companies moving up the value chain; and Mexican and Canadian regional players. Competitive intensity is high in commodity polyethylene and moderate in specialty polymers, where differentiation and qualification create barriers. Recent activity has centered on cracker start-ups, portfolio pruning in non-core European and North American assets, and decarbonization-linked partnerships.
Our analysis indicates that competition is being fought on two different fronts. In commodity polyethylene, where intensity is highest, advantage comes from feedstock position, scale and integration, which favors the concentrated top tier. In specialty polymers, advantage comes from differentiation and customer qualification, which protects margins for companies that have built those positions regardless of their size. Our assessment is that joint-venture crackers add a further layer of pressure. Because they pair external capital with U.S. feedstock, they can add scale without needing to earn a standalone return in the region, which tightens competition in exactly the segment where rivalry is already most intense.
In our view, the most significant implication is that the commodity tier will keep consolidating while the specialty tier keeps differentiating. Portfolio pruning of non-core assets suggests that sub-scale or non-integrated positions are being reassessed, and we expect that pattern to continue as new capacity weighs on commodity returns. From our assessment, this creates an opportunity for specialty and performance-material companies to deepen their positions in qualified applications, and for regional producers in Canada and Mexico to defend their positions through customer proximity rather than scale. Producers that combine low-cost feedstock with a credible specialty or low-carbon offering appear best placed on both fronts.
The full report provides revenue, capacity, margin, geographic and product exposure for each competitor, along with concentration analysis across ethylene, polyethylene and key derivatives, and a review of strategic activity across cracker start-ups, portfolio moves and decarbonization partnerships. The same intelligence can also be delivered as a structured competitor database tracking company, ownership type, facility, product, capacity, geography, estimated share, financial metrics and announced strategic actions by year. The dataset supports filtering and benchmarking by competitor group, product or region, and complements the strategic report by letting teams build their own peer sets and test positioning against the market view.
Tentative Leading Company Universe
| Sr.no | Company | HQs | Market Position | Core Strength | Major Applications/Segments |
| 1 | Dow | Midland, U.S. | Scale leader | Integrated ethane-to-polyethylene | Packaging, infrastructure, consumer |
| 2 | ExxonMobil Chemical | Spring, U.S. | Scale leader | Integration, proprietary catalysts | Packaging, performance polymers |
| 3 | LyondellBasell | Houston, U.S. / Rotterdam | Scale leader | Polyolefins, technology licensing | Packaging, automotive, compounds |
| 4 | Chevron Phillips Chemical | The Woodlands, U.S. | Scale leader | Low-cost ethylene, polyethylene | Pipe, packaging, specialties |
| 5 | Shell Chemicals | Houston, U.S. | Major integrated | Appalachian cracker, global links | Polyethylene, intermediates |
| 6 | INEOS | Houston, U.S. / London | Major integrated | Olefins, derivatives, Gulf Coast | Polymers, oxide, intermediates |
| 7 | Westlake | Houston, U.S. | Chlor-vinyls leader | Vinyls, ethylene integration | Construction, PVC, epoxy |
| 8 | Formosa Plastics USA | Livingston, U.S. | Major regional | Olefins, PVC, derivatives | Polymers, vinyls |
| 9 | SABIC | Riyadh, KSA | JV participant | Gulf Coast JV, specialties | Polyethylene, glycol, compounds |
| 10 | NOVA Chemicals | Calgary, Canada | Regional leader | Alberta/Ontario ethylene | Polyethylene, packaging |
| 11 | Braskem | São Paulo, Brazil | Regional leader | U.S. polypropylene, Mexico JV | Polypropylene, polyethylene |
| 12 | TotalEnergies | Paris, France | JV participant | Gulf Coast cracker/polymers | Polyethylene, polypropylene |
| 13 | Eastman | Kingsport, U.S. | Specialty leader | Specialty polymers, recycling | Packaging, durable goods |
| 14 | Celanese | Irving, U.S. | Specialty leader | Acetyls, engineered materials | Automotive, industrial |
| 15 | Huntsman | The Woodlands, U.S. | Specialty leader | Polyurethanes, intermediates | Construction, transport |
| 16 | Olin | Clayton, U.S. | Chlor-alkali/epoxy leader | Chlor-alkali, epoxy | Industrial, coatings |
| 17 | OxyChem | Dallas, U.S. | Chlor-vinyls player | Chlor-alkali, VCM | Vinyls, industrial |
| 18 | Enterprise Products | Houston, U.S. | Feedstock/PDH | NGL, PDH, export | Propylene, feedstock |
| 19 | Methanex | Vancouver, Canada | C1 leader | Global methanol | Methanol and derivatives |
| 20 | Indorama Ventures | Bangkok, Thailand | Intermediates | Ethylene oxide, PET, fibers | Packaging, textiles |
| 21 | Orbia | Mexico City, Mexico | Regional specialist | Vinyls, fluor, building products | Construction, infrastructure |
| 22 | Sasol | Johannesburg, SA | Gulf Coast participant | Lake Charles complex | Ethylene derivatives, wax |
| 23 | Pemex | Mexico City, Mexico | State-owned | Domestic feedstock and chemicals | Domestic petrochemicals |
Market Share & Competitive Ranking A Handful of Producers Capture the Majority of Ethylene and Polyethylene Capacity
Estimated shares indicate that the top three polyethylene producers each hold roughly 12–20% of regional capacity, with the top five collectively near 55–65%. Shares are more fragmented in specialties and intermediates. Recent share gains have accrued to producers with new Gulf Coast capacity and joint-venture structures. The report ranks companies by capacity, revenue, and estimated share, with top-5, top-10, and long-tail concentration analyses.
Competitive Benchmarking - Feedstock Access, Integration, and Specialty Products Drive Competitive Strength
Companies are compared based on their production capacity, access to feedstock, level of integration, cost competitiveness, product range, geographic presence, R&D capabilities, sustainability efforts, and strategic initiatives. Large-scale and well-integrated producers generally have a stronger cost advantage, while companies focused on specialty products tend to benefit from better margins. Regional producers are more exposed to changes in market prices and industry cycles. At the same time, newer players are increasingly entering areas such as plastic recycling and low-carbon products, creating new sources of competition. The report provides a detailed ranking of companies across these key performance indicators.
Product Portfolio Benchmarking Broad Commodity Portfolios Contrast with Focused Specialty Positions
Broad portfolio leaders span ethylene, polyethylene, polypropylene, and intermediates. Specialty leaders focus on engineered polymers, acetyls, epoxy, and performance materials. Premium and sustainable-product leaders have launched certified circular polymer grades, though commercial volume remains small. Portfolio gaps are most visible in polypropylene and advanced recycling among some regional players.
Technology & Innovation Benchmarking Catalyst Know-How, Electrification, and Recycling Partnerships Differentiate Leaders
Technology leaders are building an edge through their own catalyst technologies, advanced production processes, and licensing capabilities. Companies are assessed based on the strength of their patent portfolios, R&D investment, new product and grade development, and partnerships in areas such as chemical recycling, carbon capture, and electrified cracking. The report also compares companies based on their patent activity, R&D spending, and the stage at which new technologies are moving from development to commercial use.
Geographic Competitive Landscape Gulf Coast Concentration Contrasts with Alberta, Ontario, and Mexican Positions
Gulf Coast producers lead in export reach and scale. Alberta and Ontario producers supply Canadian and U.S. Midwest demand, while Mexican supply remains import-reliant, giving U.S. exporters a structural advantage. The report maps manufacturing and sales footprints, regional share, and expansion plans.
Customer & Channel Benchmarking Direct Contracts, Distribution, and Technical Service Determine Stickiness
Scale producers sell largely through direct contracts and export traders, while specialty companies rely on application engineering and distributors. Switching barriers are highest in regulated and OEM-qualified applications.
Strategic Developments Cracker Start-Ups, Project Deferrals, and Decarbonization Investments Signal Shifting Priorities
The past three years have featured start-ups of large Gulf Coast capacity, deferral or reevaluation of some lower-carbon projects, portfolio exits from European operations, and investment in recycling and carbon-capture partnerships. The report catalogs anticipated investment values, capacities, and timelines.
M&A Landscape Portfolio Reshaping and Infrastructure Monetization Dominate Deal Activity
Transactions have centered on asset divestitures, minority sales of infrastructure assets, and joint-venture structures with Asian and Middle Eastern partners. Future themes include consolidation among sub-scale polyolefin producers, vertical integration into recycling, and Gulf Coast asset rotation. The report details acquiring target, year, value (where disclosed), and strategic rationale.
Company Profiles Detailed Intelligence on Market Participants
Each profile covers company overview, market position, financials (total and market-relevant revenue, EBITDA, R&D, capex), product portfolio, application exposure, geographic footprint, manufacturing capacity, innovation, strategic developments, and competitive strengths, vulnerabilities, and opportunities.
Company Strategic Positioning Market Leaders, Specialty Leaders, and Advantaged Challengers Are Best Placed for Growth
Companies are classified as Market Leaders, Scale Leaders, Technology Leaders, Growth Leaders, Regional Leaders, Application Specialists, and Emerging Challengers. Best-positioned producers combining low-cost feedstock, export access, specialty exposure, and credible decarbonization pathways. This is a concise qualitative assessment.
Opportunity & White-Space Analysis: Circular Polymers, Mexican Import Substitution, and High-Performance Grades Offer the Highest-Value Gaps
Opportunities include:
- Mexican import substitution, representing several million tons of polyolefin demand
- Certified recycled-content resins growing at double-digit rates
- Specialty and medical-grade polymers priced at 20–60% premiums
- Low-carbon ethylene and derivatives
Industry Structure (Porter's Five Forces) – Moderate Overall Intensity, with Rivalry High in Commodities
- Supplier Power – Low to Medium: Companies with reliable access to low-cost feedstock are in a stronger position and face less pressure from suppliers.
- Buyer Power – Medium: Buyers have some bargaining power because large converters purchase in bulk. However, long-term contracts and price indexation can reduce pricing pressure.
- Threat of New Entrants – Low: Entering the industry requires very high investment, with a world-scale complex typically costing around USD 5–9 billion or more. This makes entry difficult for new players.
- Threat of Substitutes – Medium: Alternative materials and the growing use of recycled content can replace some conventional plastic applications, creating moderate substitution pressure.
- Competitive Rivalry – High: Competition is strong in commodity polymers, where products are similar, and companies compete mainly on cost, scale, efficiency, and pricing.
PESTLE Analysis: Trade Policy, Energy Costs, and Plastics Regulation are Key Market Influencers
- Political: Changes in tariffs and trade agreements can affect import and export costs, market access, and the competitiveness of producers.
- Economic: Natural gas prices, interest rates, and demand for durable goods have a direct impact on production costs, investment decisions, and overall profitability.
- Social: Growing public and consumer concern about plastic packaging is pushing companies to reduce plastic use, improve recyclability, and offer more sustainable packaging solutions.
- Technological: Advances in electrification, recycling, and cleaner production technologies are helping companies reduce emissions and improve production efficiency.
- Legal: Stricter emissions standards and Extended Producer Responsibility (EPR) rules are increasing compliance requirements and encouraging companies to invest in cleaner and more circular solutions.
- Environmental: Gulf Coast producers face risks from hurricanes, storms, flooding, and other extreme-weather events, which can disrupt plants, transport networks, and feedstock supply.
Market Attractiveness: Commodity Olefins are Attractive but Cyclical; Specialty and Circular Segments Offer Superior Risk-Adjusted Returns
- Polyethylene – Attractive: Polyethylene benefits from large-scale production, relatively low-cost feedstock, and strong demand across packaging, healthcare, and consumer applications.
- Specialty Polymers – Highly Attractive: Specialty polymers offer higher margins because they are designed for specific applications and often have fewer direct competitors. Demand from automotive, electronics, healthcare, and other high-performance industries supports their growth.
- Aromatics – Moderate: Aromatics have a broad range of industrial applications and provide a stable demand base. However, their profitability is more dependent on feedstock prices, supply-demand conditions, and overall economic cycles.
- Circular Polymers – Attractive, but with Execution Risk: Recycled and circular polymers have strong long-term potential as companies respond to sustainability targets and recycled-content requirements.
Future Outlook: Export Competitiveness and Specialty Mix Will Decide Winners Through 2035
Margin recovery is expected from mid-decade as global capacity additions slow. Likely winners are low-cost integrated producers with specialty and circular exposure, while sub-scale and naphtha-dependent players face pressure. Estimates are indicative and will be refined in the full report.
Key Strategic Questions
- How will North America’s ethane feedstock advantage influence producer margins and competitiveness through 2035?
- Which petrochemical product chains and individual products are expected to capture the strongest growth through 2035?
- How will the region’s polyethylene surplus affect operating rates, pricing, margins, and export dependence?
- Which companies are best positioned to benefit from North America’s low-cost feedstock and export infrastructure?
- How will new petrochemical capacity in Asia and the Middle East reshape North American export opportunities and global market share?
- Which export corridors and end markets offer the greatest growth potential for North American petrochemical producers?
- How will tariffs, trade restrictions, and changing trade agreements affect regional petrochemical flows and producer profitability?
- Which technologies including chemical recycling, carbon capture, electrified cracking, and hydrogen-based heating are most likely to achieve commercial scale through 2035?
- Where are the largest investment opportunities across specialty polymers, circular materials, Mexican import substitution, and other higher-value segments?
- How will regulatory, sustainability, and recycled-content requirements reshape product portfolios, capital allocation, and competitive positioning through 2035?
List of Segments
By Product Chain
- Olefins and Derivatives
- Ethylene
- Propylene
- Polyethylene (HDPE, LLDPE, LDPE)
- Polypropylene
- PVC
- Ethylene Glycol
- Aromatics and Derivatives
- Methanol and C1 Derivatives
- Other Intermediates
By Feedstock
- Ethane
- Propane/Butane
- Naphtha and Refinery-Integrated Streams
By Production Route (Propylene)
- Steam Cracking
- Propane Dehydrogenation (PDH)
- Refinery-Based
By Application
- Packaging
- Construction
- Automotive and Transportation
- Consumer Goods
- Electrical and Electronics
- Industrial and Other Applications
By Product Type (Sustainability)
- Conventional Polymers
- Recycled-Content and Certified Circular Polymers
A Seven-Phase Framework
Our methodology is designed to be universally applicable across commodity chemicals, specialty chemicals, petrochemicals, construction chemicals, coatings, electronic chemicals, industrial gases, agrochemicals, water treatment chemicals, and performance materials. Each phase builds upon the last, creating a layered validation structure that minimizes estimation error and maximizes analytical confidence.
The framework ensures comprehensive market coverage, robust cross-validation, and reliable long-term forecasting — producing market estimates that withstand scrutiny from investors, regulators, and corporate strategy teams.

Seven-Phase Framework — Analytical Effort Distribution
Relative analytical effort allocated across each phase of the Chemicals & Materials research framework

Phase 1 - Secondary Research: Establishing the Foundation
Secondary research collects and evaluates publicly available information from authoritative sources, establishing the foundational understanding of market structure, value chain dynamics, competitive landscape, and end-use demand patterns. Every source is evaluated for credibility, recency, geographic relevance, and methodological soundness before inclusion.
Industry Associations
Sources include ACC, CEFIC, ICCA, JCIA, CPCIF, and SOCMA providing production volumes, consumption trends, capacity developments, and sustainability initiatives.
Company Disclosures
Annual reports, investor presentations, earnings transcripts, and regulatory filings reveal product portfolios, manufacturing footprints, capacity expansions, and revenue segmentation.
Government Databases
National statistical offices, customs authorities, environmental agencies, and industrial production databases provide verified statistics on output, trade flows, and regulatory compliance.
Trade Databases
UN Comtrade, ITC, Eurostat, and national customs authorities enable assessment of global product movement, import dependency, and export competitiveness across regions.
Our Secondary Research Sources
- Ministry of Chemicals and Fertilizers
- European Chemicals Agency
- United States Department of Energy
- Ministry of Industry and Information Technology
- Ministry of Economy Trade and Industry
- Ministry of Trade Industry and Energy
- National Institute of Standards and Technology
- Council of Scientific and Industrial Research
- Fraunhofer Society
- National Institute for Materials Science
Phase 2 — Supply-Side Assessment: Mapping Production Capabilities
Production Capacity Analysis
All major manufacturers are assessed for existing installed capacity, planned additions, expansions, new plant announcements, and technology adoption — mapped at global, regional, and country levels.
Capacity Utilization Adjustment
Installed capacity is adjusted using utilization rates based on demand conditions, feedstock availability, plant operating rates, maintenance schedules, and regulatory restrictions.
Manufacturer Revenue Analysis
Product-specific revenues, segment-level performance, regional distribution, average selling prices, and margin trends are evaluated to establish market value estimates.
Supply-Side Assessment — Capacity vs. Effective Production by Region
Illustrative comparison of installed capacity vs. effective production volume (after utilization rate adjustment) across major regions

Phase 3 — Demand-Side Assessment: Quantifying Chemical Consumption
Demand-side analysis quantifies chemical consumption across industries, applications, and geographies — identifying where and how chemicals are consumed throughout the value chain with precision.
End-Use Industry Analysis
Chemical demand is evaluated across automotive, construction, packaging, electronics, agriculture, healthcare, consumer goods, industrial manufacturing, energy and utilities, and water treatment. Industry output, production trends, and consumption intensity are analyzed to determine demand patterns.
Consumption Modeling
Demand is estimated using measurable indicators: kilograms per vehicle, kilograms per square meter of construction, dosage per cubic meter of water treated, kilograms per hectare of agricultural land, and kilograms per ton of manufactured products. Consumption factors are validated through industry publications and primary interviews.
Application Analysis
The market is segmented by application area to understand product performance requirements, formulation trends, technology adoption, customer preferences, and regulatory requirements improving demand accuracy and segmentation granularity.
Demand-Side Assessment — End-Use Industry Demand Distribution
Illustrative distribution of chemical & materials demand across key end-use industries

Phase 4 - Trade Flow Analysis: Balancing Regional Supply and Demand
Trade flow analysis reconciles regional supply and demand estimates through import and export data, identifying net supply positions, regional dependencies, and market imbalances. It serves as an independent validation layer that tests the consistency of supply-side and demand-side estimates.
Import Analysis
Import data is evaluated to determine volumes, source countries, product dependency, regional supply gaps, and pricing trends — identifying markets that rely heavily on external supply and where domestic production is insufficient to meet demand.
Export Analysis
Export assessments reveal production surplus, export competitiveness, regional manufacturing strength, and global market participation. Export patterns also help validate domestic production estimates and identify net exporting regions.
Apparent Consumption Model
Regional consumption is assessed using the standard apparent consumption formula:
Results identify net importing regions, net exporting regions, regional deficits, and surpluses — serving as an independent validation of supply and demand estimates.
Trade Flow Analysis — Net Supply Position by Region
Illustrative apparent consumption vs. domestic production across major regions — positive gap indicates net import dependency

Phase 5 — Primary Research: The Critical Validation Layer
Primary research tests and refines findings from secondary research through direct engagement with industry participants across the supply chain, demand side, and expert community. It captures intelligence that no database or published report can provide — the real-world experience of manufacturers, buyers, and specialists operating in the market.

Supply-Side Interviews
Conversations with chemical manufacturers, raw material suppliers, contract manufacturers, technology providers, and plant operators cover production trends, capacity utilization, pricing developments, technology shifts, and competitive dynamics.

Demand-Side Interviews
Engagement with OEMs, industrial consumers, procurement managers, distributors, formulators, and end-use manufacturers focuses on consumption trends, purchasing behavior, product substitution, demand outlook, and emerging applications.

Industry Expert Consultations
Additional interviews with industry consultants, independent experts, regulatory specialists, technical professionals, and research institutions provide deeper market context and validate key analytical assumptions.
Focus Areas of Primary Research:
Market Size & Forecast Validation
Revenue estimates, volume consumption, growth rates, forecast assumptions, regional demand.Supply Chain & Value Chain Assessment
Raw material sourcing, supply chain challenges, distribution networks, procurement practices.Production & Capacity Analysis
Manufacturing capacity, utilization rates, expansion projects, plant investments.Pricing & Cost Structure Analysis
Product pricing trends, feedstock costs, energy costs, margin pressures, pricing outlook.Competitive Landscape Assessment
Volume and value estimates confirmed to be fully consistent with one another before publicationInterview Volume by Market Scope
| Study Scope | Number of Interviews |
|---|---|
| Niche Market | 20 – 30 |
| Mid-Sized Market | 30 – 50 |
| Global Market | 50 – 80 |
| Highly Fragmented Market | 80 – 120 |
Interview Details:
Category : Manufacturers, Suppliers, Distributors, End Users, Experts/Associations
Average Duration : 30–60 Minutes
Interview Mode : Video calls, telephonic interviews, expert consultations
Interview Format : Structured / Semi-Structured questionnaire
Focus Areas of Primary Research:
Market Size & Forecast Validation :
Revenue estimates, volume consumption, growth rates, forecast assumptions, regional demand.
Supply Chain & Value Chain Assessment :
Raw material sourcing, supply chain challenges, distribution networks, procurement practices.
Production & Capacity Analysis :
Manufacturing capacity, utilization rates, expansion projects, plant investments.
Pricing & Cost Structure Analysis :
Product pricing trends, feedstock costs, energy costs, margin pressures, pricing outlook.
Competitive Landscape Assessment :
Market share, competitor positioning, strategic initiatives, partnerships, acquisitions.
Primary Research — Stakeholder Coverage by Category
Distribution of interview respondents across stakeholder categories (% share from PPT data)

Primary Research — Respondent Designation Profile
Seniority breakdown of interview respondents (% share from PPT data)

Primary Research — Geographic Coverage of Interviews
Regional distribution of primary research engagement (% share from PPT data)

Phase 6 — Data Triangulation and Market Validation
No single methodology is relied upon in isolation. Multiple independent estimation approaches are combined and reconciled to ensure consistency, accuracy, and analytical defensibility. Any material deviations between approaches are investigated and adjusted through additional validation cycles.
The final market size is derived through weighted triangulation of all validated methodologies. Any material deviations between approaches are investigated and adjusted through additional validation cycles. The outcome represents the most realistic assessment of the market based on available evidence and expert confirmation ensuring that volume and value estimates are fully consistent with one another.
Triangulation Framework — Input Contribution Weight
Relative weight each sizing input contributes to the final reconciled market estimate

Phase 7 — Forecast Modeling: Projecting Future Market Evolution
Forecasting evaluates the future trajectory of the market using a combination of quantitative indicators and qualitative assessments across economic, industry, and regulatory dimensions. Rather than simple extrapolation, each driver is independently modeled and integrated into a composite forecast.
Macroeconomic Indicators
GDP growth, industrial production, manufacturing output, construction activity, consumer spending, and capital investment form the quantitative foundation of long-term demand projections. These are applied at country, regional, and global levels.
Industry Growth Drivers
Urbanization, infrastructure development, industrialization, technological innovation, sustainability initiatives, and evolving product performance requirements are assessed at regional and industry levels — capturing both structural and cyclical demand drivers.
Capacity Expansion Analysis
Announced plant expansions, new manufacturing facilities, technology upgrades, and strategic investments are evaluated to determine future supply-demand dynamics and potential market tightness or oversupply situations.
Regulatory & Sustainability
Environmental regulations, chemical safety standards, emission reduction targets, circular economy initiatives, and sustainability requirements are incorporated as they often influence product adoption rates and market growth trajectories.
Scenario Forecast Range — Indexed Market Growth (Year 1–10)
Illustrative indexed growth trajectories across Base, Optimistic, and Pessimistic scenarios over a 10-year forecast horizon

Forecast Drivers — Relative Impact Score by Category
Impact score (0–100) of each driver type on chemicals & materials market forecast




Comments
Share your thoughts, ask a question, or provide feedback about this report.