
Paper Processing Resins Market Size, Competitive Landscape Analysis Report 2035
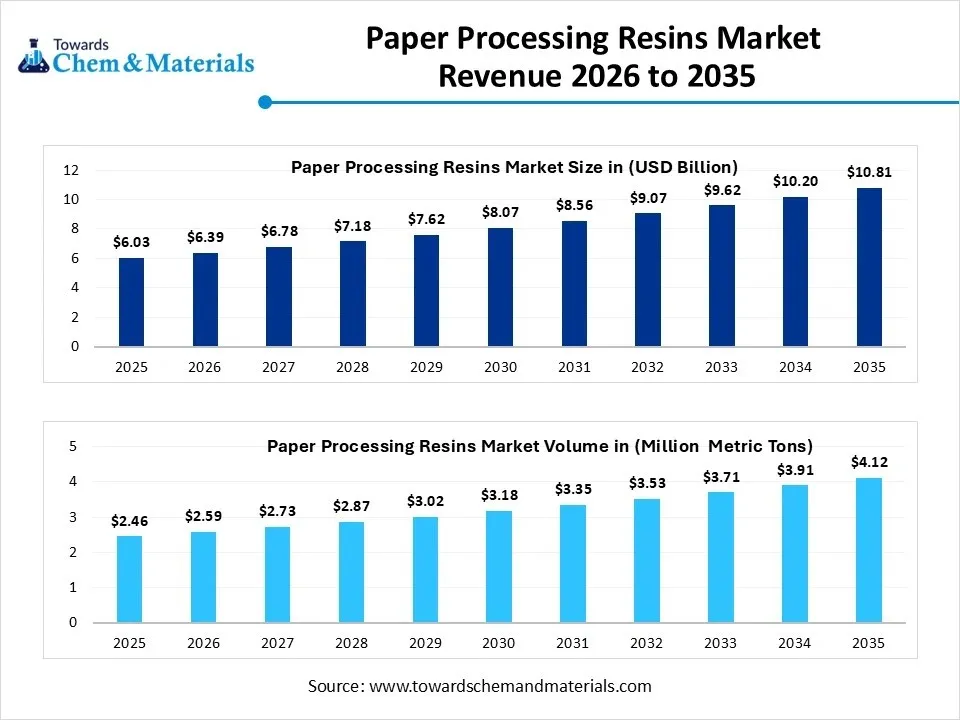
The global paper processing resins market size was valued at USD 6.03 billion in 2025, is estimated to reach USD 6.39 billion in 2026, and is projected to reach USD 10.81 billion by 2035, exhibiting a compound annual growth rate (CAGR) of 6.01% over the forecast period from 2026 to 2035.Asia Pacific dominated the paper processing resins market with the largest revenue share of 45% in 2025 and is expected to grow at the fastest CAGR of 6.15% during the forecast period. In terms of volume, the paper processing resins market is projected to grow from 2.46 million metric tons in 2025 to 2.59 million metric tons in 2026 and 4.12 million metric tons by 2035, growing at a CAGR of 5.29% from 2026 to 2035. The increasing industrialization, tough environmental laws, and investments in specialty paper production fuel the growth of the market. Growth in the market is further attributed to the growing demand for sustainable packaging materials, a surge in paper recycling, paper consumption for hygiene, and constant innovation in bio-based resin technologies.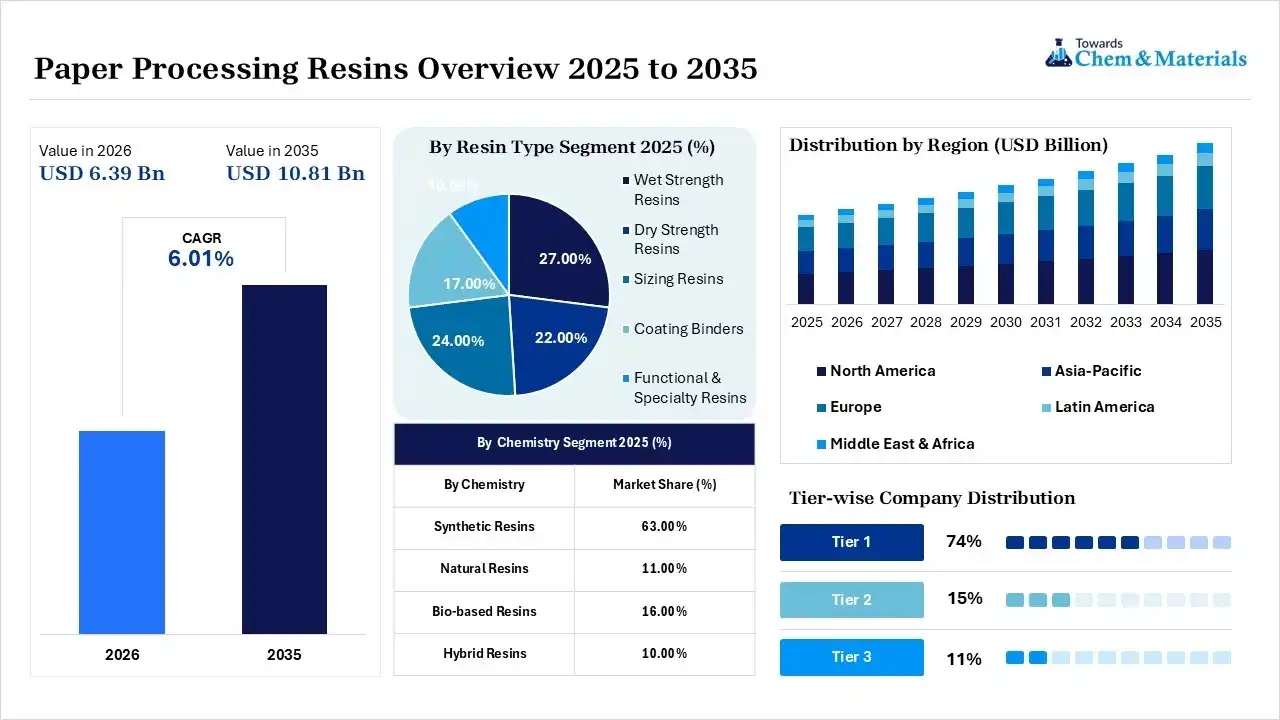
Market Highlights
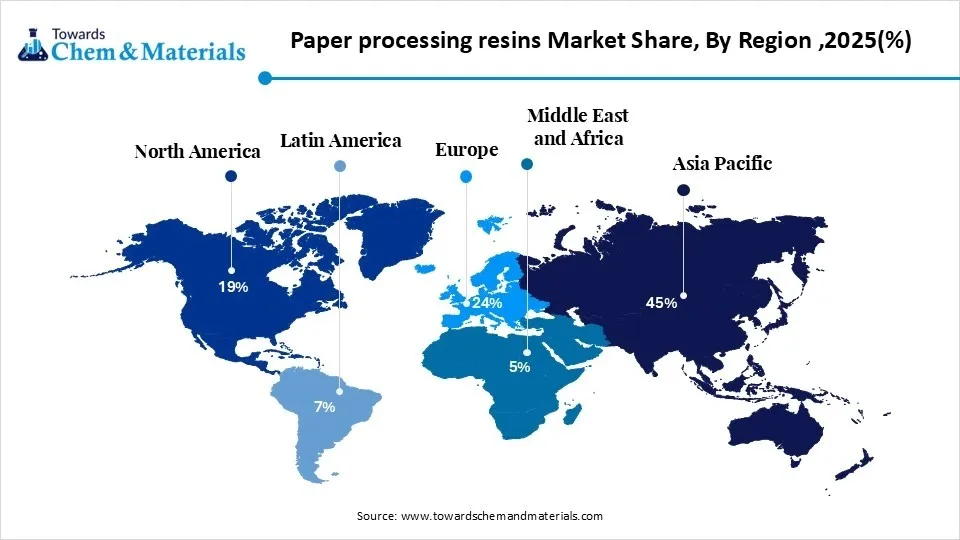
- By region, Asia Pacific dominated the paper processing resins market by holding 45% share in 2025 and is expected to grow with a CAGR of 5.20% during the forecast period.
- By region, North America held 19% market share in 2025 and is expected to grow at the fastest with a CAGR of 6.80% during the forecast period.
- By resin type, the wet strength resins segment dominated the market with the largest share of 27% in 2025 and is expected to grow at a CAGR of 5.70% over the forecast period.
- By resin type, the coating binders segment held the 17% market share in 2025 and is expected to grow at the fastest CAGR of 6.50% over the forecast period.
- By chemistry, the synthetic resins segment dominated the market with the largest share of 63% in 2025, and is expected to grow at a CAGR of 5.40% over the forecast period.
- By chemistry, the bio-based resins segment held the 16% market share in 2025 and is expected to grow at the fastest CAGR of 7.40% over the forecast period.
- By function, the surface sizing segment dominated the market with the largest share of 24% in 2025, and is expected to grow at a CAGR of 5.90% over the forecast period.
- By function, the barrier coating segment held the 10% market share in 2025 and is expected to grow at the fastest CAGR of 7.20% over the forecast period.
- By paper type, the packaging paper & paperboard segment dominated the market with the largest share of 46% in 2025, and is expected to grow at the fastest CAGR of 6.90% over the forecast period.
- By paper type, the printing & writing paper segment held the 18% market share in 2025 and is expected to grow at a CAGR of 3.80% over the forecast period.
- By application, the packaging segment dominated the market with the largest share of 44% in 2025, and is expected to grow at the fastest CAGR of 6.90% over the forecast period.
- By application, the printing segment held the 16% market share in 2025 and is expected to grow at a CAGR of 3.90% over the forecast period.
- By end use, the packaging industry segment dominated the market with the largest share of 39% in 2025, and is expected to grow at a CAGR of 5.66% over the forecast period.
- By end use, the food & beverage segment held the 18% market share in 2025 and is expected to grow at the fastest CAGR of 6.80% over the forecast period.
- By distribution channel, the direct sales segment dominated the market with the largest share of 56% in 2025, and is expected to grow at a CAGR of 5.80% over the forecast period.
- By distribution channel, the chemical suppliers segment held the 15% market share in 2025 and is expected to grow at the fastest CAGR of 6.40% over the forecast period.
The increasing environmental regulations push paper producers towards the use of bio-based, biodegradable, and low-emission resin technologies to meet customer demands for increased performance and sustainability goals. The paper processing resins market is expected to grow steadily as manufacturers are moving towards paper-based packaging alternatives that can be recycled. Demand for sustainable packaging, specialty papers, and recycled paper products will continue to drive resin usage in packaging, printing, tissue, and industrial papers.
- For instance, in June 2026, Lubrizol Corporation and Grasim Industries launched a new CPVC resin plant in Gujarat, India, that has a capacity of 50,000 metric tons per year, boosting capacity for resin production and helping to meet the growing demand from industrial material applications in various downstream sectors. (Source: www.indexbox.io)
New opportunities are arising using biomass resins for wet-strength, specialty coatings, and high-performance additives for recycled fiber applications. Technological innovations such as nanocoatings, barrier chemistries without the use of fluorine, chemical dosing systems, and enzymatic processing are leading to more efficient production processes, lower waste generation, and improved paper quality. Digitalization in paper manufacturing is also driving towards better resin utilization and optimisation of the process.
Global Investment Movement for Paper Processing Resins Market
Bio-based, recyclable, and biodegradable resin technologies are seeing more investment by manufacturers to comply with increasingly strict environmental regulations and a rising demand for sustainable paper packaging.
- For instance, in January 2025, Smart Planet Technologies (SPT) commercialized EarthCoating-Bio, a mineral-based barrier coating (MBC) with a specific mineral composition based on PLA. The innovation provides moisture and grease-resistant paper packaging solutions for food-service applications, in addition to being recyclable and compostable.(Source :smartplanettech.com)
Paper producers keep investing in advanced dry-strength and wet-strength resin technologies to increase the quality of recycled paper, tissue performance, and the durability of liquid packaging.
Leading paper producers are building up recycling facilities, recovered paper collection systems, and integrated pulp manufacturing plants to enhance raw material availability and capacity.
Paper Processing Resins Market Trends
- The global market for traditional plastic packaging is seeing a further surge in the adoption of recyclable paper-based packaging. The printing, grease resistance, water resistance, and structural strength of the packaging are enhanced due to the addition of paper processing resins, allowing manufacturers to create high-quality packaging for food, retail, logistics, and consumer goods.
- With the needs of environmental regulation, manufacturers are increasingly creating biodegradable, fluorine-free, and low-VOC resin formulations. Sustainable resin technologies align with the goals of the circular economy and the barrier, durability, and processing property needs of modern paper packaging products.
- Demand for dry-strength resins, wet-strength additives, and functional coating resins is still growing as the corrugated packaging industry, paperboard industry, food packaging industry, and premium printing papers industry are growing rapidly.
Report Scope
| Report Attributes | Details |
| Market Size in 2026 | USD 6.39 Biilion/ 2.59 Million Metric Tons |
| Market Size by 2035 | USD 10.81 Billion/ 4.12 Million Metric Tons |
| Growth Rate from 2026 to 2035 | CAGR 6.01% |
| Base Year of Estimation | 2025 |
| Forecast Period | 2026 - 2035 |
| Dominant Region | Asia Pacific |
| Segment Covered | By Resin Type, By Chemistry, By Function, By Paper Type, By Application, By End-use Industry, By Distribution Channel, By Region |
| Key Profiled Companies | Kemira, Ashland Inc., Solenis, Buckman, Clariant, CJ Biomaterials, Nouryon, Archroma, Ecolab, Mitsubishi Chemical Corporation, Wacker Chemie AG, DIC Corporation |
Technological Transformation Across the Paper Processing Resin Market
To mitigate environmental impact, while enhancing recyclability and regulatory compliance in packaging and specialty papers applications, manufacturers are shifting to bio-based and biodegradable resins as an alternative to petroleum-based chemistries. Barrier coatings for food packaging are becoming more popular because they come in a variety of sustainable alternatives that are not made with fluorine and do not use water. These coatings are excellent for grease, moisture, and oxygen resistance and are also paper-recyclable. Resin systems with nanomaterials are used to enhance the adhesion between the fibers, increase mechanical strength, surface smoothness, and barrier properties. The digital monitoring systems, automated chemical dosing, and real-time process controls allow resin use to be optimized, coating consistency to be improved, waste to be reduced, and production efficiency to be increased throughout the paper mill.
Supply Chain Analysis of the Paper Processing Resins Market
Feedstock Procurement
- The sourcing of petrochemical derivatives, natural polymers, wood-based chemicals, and bio-based feedstocks for paper processing resins is a stage in this.
- Quality raw material and sustainability management guarantee the stability of resin performance and manufacturing efficiency.
- Dow Chemical Co.: Dow Inc. provides specialty chemical feedstocks and sustainable raw materials, providing it with consistent quality and reliable resin production globally.
- Other Key Players: BASF SE, SABIC, INEOS.
Chemical Synthesis and Processing
- The raw materials are polymerized, emulsified, and chemically modified to make wet-strength, dry-strength, sizing, and barrier resins.
- Advanced manufacturing technologies enhance product uniformity, environmental responsibility, and processing efficiency for a variety of paper applications.
- Elantra: BASF SE's advanced polymer technologies enhance paper's performance, productivity, and environmental compliance.
- Other Key Players: Kemira, Solenis, Arkema.
Compound Formulation & Blending
- Resin formulations are mixed with specialty additives, curing agents, crosslinkers, and performance modifiers to impart desirable strength, moisture resistance, printability, and coating performance of the resin.
- Formulation made to order for packaging, tissue, printing, and specialty paper.
- Kemira: Kemira formulates special resins to improve paper strength, printability, moisture resistance, and paper manufacturing efficiency.
- Other Key Players: Solenis, Ashland Inc., and Clariant.
Regulatory Framework: Paper Processing Resins Market
| Region | Regulatory Body | Key Regulation | Regulatory Focus |
| Asia Pacific | Bureau of Indian Standards (BIS) | BIS Packaging Standards | Encourages sustainable paper packaging, recyclable materials, and safer resin chemistries. |
| North America | U.S. Environmental Protection Agency (EPA | Toxic Substances Control Act (TSCA) | Regulates chemical safety and sustainable resin formulations used in paper packaging applications. |
| Europe | European Commission, European Chemicals Agency (ECHA) | REACH Regulation, Packaging and Packaging Waste Regulation (PPWR) | Promotes bio-based materials, restricted hazardous substances, and circular economy compliance throughout paper manufacturing. |
Market Dynamics
Driver
Growing Demand for Sustainable Paper Packaging
Manufacturers are continuing to comply with environmental regulations and are making greater use of paper-based, recyclable packaging. Paper processing resins enhance moisture resistance, strength, printability, and barrier properties in a variety of packaging applications. Even with the growth of e-commerce, demand for durable corrugated boxes and paperboard packaging continues to grow. Ongoing developments in bio-based resin technologies continue to bolster market growth in developed and developing economies.
Restraint
The Price Volatility of Raw Materials
Paper processing resin producers are very much reliant on petrochemical feedstocks and specialty chemical intermediates. Volatile crude oil prices have a significant impact on the value chain production costs and overall profitability. The disruptions in the supply chain also add to uncertainty in the procurement of raw materials and product availability. These hurdles could depress investment choices and hinder market growth in low-cost areas for a brief time.
Opportunity
Developing Technologies for Bio-Based and Low-Emission Resins
The increasing pledges toward sustainability demand that manufacturers take the initiative to use resin that is renewable and biodegradable. Bio-based technologies are based on renewable raw materials and promote the circular economy. Increasingly, food packaging manufacturers go to great lengths to provide barrier coatings without the use of fluorines and with compostability in order to meet the requirements of the various regulations. Ongoing research increases resin performance while maintaining recyclability and production efficiency.
Segmental Insights
Resin Type Insights
Wet Strength Resins Dominated the Paper Processing Resins Market with 27% of Market Share in 2025
The wet strength resins segment dominated the market with the largest share of 27% in 2025, and is expected to grow at a CAGR of 5.70% over the forecast period, due to an increase in the demand for waterproof and performance-enhancing paper products. These resins give enhanced printability, surface strength, and resistance in packaging and printing. There was a growing trend among packaging manufacturers to use sizing technologies that provide improved product durability and operational efficiency. 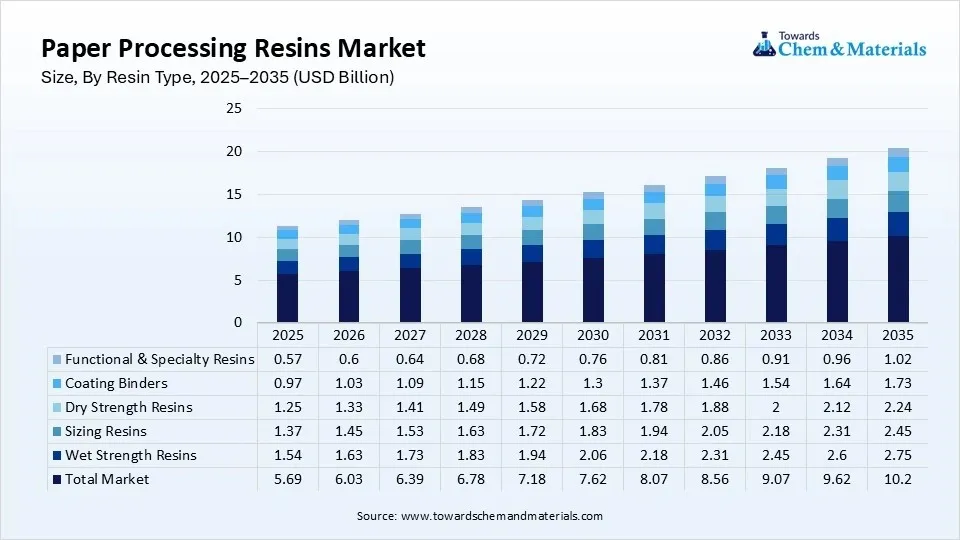
The coating binders segment held the 17% market share in 2025 and is expected to grow at the fastest CAGR of 6.50% over the forecast period, driven by the rising demand for high-end coated packaging material. These binders enhance surface smoothness, printability, gloss, and barrier properties of packaging and specialty grades. Packaging legislation promotes sustainable packaging solutions such as recyclable coated paper. Continued innovation in water-based and bio-based coating technologies is supporting wider commercialization of paper-coating applications
Paper processing resins Market Share, By Resin Type,2025(%)
| By Resin Type | Market Share (%) |
| Wet Strength Resins | 27.00% |
| Dry Strength Resins | 22.00% |
| Sizing Resins | 24.00% |
| Coating Binders | 17.00% |
| Functional & Specialty Resins | 10.00% |
Chemistry Insights
The Synthetic Resins Segment Dominated the Paper Processing Resins Market with 63% of Market Share in 2025
The synthetic resins segment dominated the market with the largest share of 63% in 2025, and is expected to grow at a CAGR of 5.40% over the forecast period, due to their proven applications in the packaging, printing, tissue, and specialty paper industries. Synthetic resins provide strong bonding characteristics, water resistance, and process stability during high-speed papermaking. water resistance, and process stability during high-speed papermaking. They have established mature manufacturing systems, which can guarantee their supplies and low cost of production. The excellent match with various paper grades remains as one of the major drivers of global industrial uptake.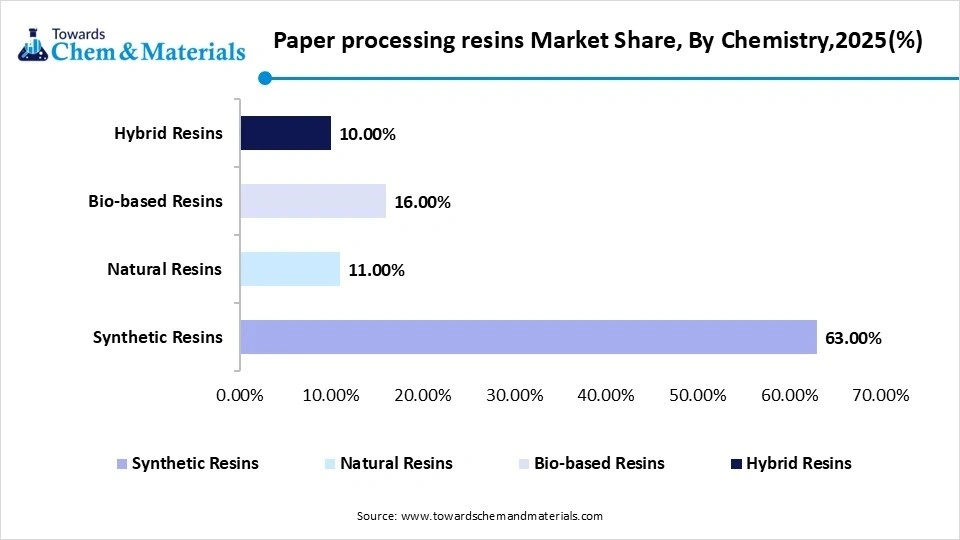
The bio-based resins segment held the 16% market share in 2025 and is expected to grow at the fastest CAGR of 7.40% over the forecast period, due to the sustainability regulations and the rise in demand for renewable paper additives. Increase in use of bio-based alternatives to fossil-based chemistries to improve recyclability and minimize carbon emissions in paper manufacturing. Sustainable packaging materials are still being adopted by brand owners to meet corporate sustainability goals. Large-scale adoption of bio-based resin technologies and commercialization is further driven by the Government policies that support the circular economy practices.
Paper processing resins Market Share, By Chemistry,2025(%)
| By Chemistry | Market Share (%) |
| Synthetic Resins | 63.00% |
| Natural Resins | 11.00% |
| Bio-based Resins | 16.00% |
| Hybrid Resins | 10.00% |
Function Insights
The Surface Sizing Segment Dominated the Paper Processing Resins Market with 24% of Market Share in 2025
The surface sizing segment dominated the market with the largest share of 24% in 2025, and is expected to grow at a CAGR of 5.90% over the forecast period, as there was an increasing demand for quality printing and packaging papers. Surface sizing enhances the paper strength, printability, water resistance, and surface smoothness without compromising production efficiency. The industry has seen the introduction of new formulas for sizing paper for premium packaging and publishing applications. The consumption of coated paperboard and specialty grades continued to drive the market towards further market leadership.
The barrier coating segment held the 10% market share in 2025 and is expected to grow at the fastest CAGR of 7.20% over the forecast period, as the demand for plastic-free food packaging solutions increases. Barrier coatings enhance the resistance to grease, moisture, oxygen, and mineral oil and retain paper recyclability. Food safety regulations will also continue to drive the use of barrier technologies without fluorochemicals for packaging. The continuous innovation of bio-based coatings further propels the market growth of paper manufacturers across the globe.
Paper processing resins Market Share, By Function,2025(%)
| By Function | Market Share (%) |
| Wet Strength Enhancement | 22.00% |
| Dry Strength Enhancement | 18.00% |
| Surface Sizing | 24.00% |
| Pigment Binding | 12.00% |
| Barrier Coating | 10.00% |
| Water Resistance | 8.00% |
| Oil & Grease Resistance | 6.00% |
- For instance, in May 2026, UPM Specialty Materials and BASF presented a concept for a recyclable fiber-based packaging, using UPM barrier papers and BASF Joncryl® HPB barrier resins. The partnership enhances grease and moisture resistance, promotes the use of recyclable paper packaging, and design-for-recycling goals.(Source: www.basf.com)
Paper type Insights
The packaging paper & paperboard segment dominated the market with the largest share of 46% in 2025, and is expected to grow at the fastest CAGR of 6.90% over the forecast period, due to the rising demand for sustainable packaging in the food, beverage, retail, and e-commerce sectors. For packaging materials, paper processing resins enhance moisture resistance, mechanical strength, printability, and converting efficiency. Continued acceleration of plastic replacement projects is driving paperboard products with recycling capability to the market around the globe. The segment led global paper manufacturing as a result of the continuous investment in high-performing packaging grades.
- For instance, in August 2025, Mondi increased its re/cycle Functional Barrier Paper portfolio for food and consumer goods packaging in September 2025. The development is improving reusable paper packaging and reducing the use of traditional plastic packaging.(Source: www.mondigroup.com)
The printing & writing paper segment held the 18% market share in 2025 and is expected to grow at a CAGR of 3.80% over the forecast period, with continued demand for printing, publishing, educational, and office applications. Paper processing resins improve the strength, printability, brightness retention, and adhesion of the paper for high-quality grades. Manufacturers are still making continual advances in product quality by using advanced resin formulation and surface treatment technologies.
Paper processing resins Market Share, By Paper Type,2025(%)
| By Paper Type | Market Share (%) |
| Packaging Paper & Paperboard | 46.00% |
| Printing & Writing Paper | 18.00% |
| Tissue Paper | 16.00% |
| Specialty Paper | 15.00% |
| Newsprint | 5.00% |
Application Insights
The packaging segment dominated the market with the largest share of 44% in 2025, and is expected to grow at the fastest CAGR of 6.9% over the forecast period, due to the growing demand for recyclable paper packaging in the food, beverage, healthcare, and e-commerce sectors. Packaging Resins are used to process paper to provide barrier properties, printability, moisture resistance, and durability. Environmental regulations keep increasing drive for plastic packaging alternatives that are fiber-based. Additionally, the ongoing advancement of resin innovations continues to aid packaging sustainability globally.
The printing segment held the 16% market share in 2025 and is expected to grow at a CAGR of 3.9% over the forecast period, supported by the consistent demand for premium commercial printing and high-quality graphic paper applications. Paper processing resins enhance smoothness, ink absorbency, print clarity, and coating adhesion of printed materials. It is worth noting that resin is also being promoted through packaging graphics and branded promotional materials in commercial print shops.
Paper processing resins Market Share,By Application ,2025(%)
| By Application | Market Share (%) |
| Packaging | 44.00% |
| Printing | 16.00% |
| Hygiene Products | 14.00% |
| Industrial Paper | 10.00% |
| Food Contact Paper | 8.00% |
| Labels & Release Liners | 5.00% |
| Others | 3.00% |
End Use Insights
The Packaging Industry Segment Dominated the Paper Processing Resins Market with 39% of Market Share in 2025
The packaging industry segment dominated the market with the largest share of 39% in 2025, and is expected to grow at a CAGR of 5.66% over the forecast period, due to high demand for paper packaging across various industries for recycling and durability. Paper processing resins are used to enhance moisture resistance, bond strength, and print quality in corrugated boxes and paperboard packaging. The growth of retail, food delivery, and e-commerce use continues to drive up the usage of paper packaging.
The food & beverage segment held the 18% market share in 2025 and is expected to grow at the fastest CAGR of 6.80% over the forecast period, owing to its rising demand for safe, recyclable, and food-grade paper packaging. Paper processing resins provide additional grease resistance, moisture protection, and product durability, while complying with regulations. Food manufacturers continue to transition away from traditional plastic packaging to eco-friendly fiber packaging.
Paper processing resins Market Share,By End-use Industry ,2025(%)
| By End-use Industry | Market Share (%) |
| Packaging Industry | 39.00% |
| Food & Beverage | 18.00% |
| Consumer Goods | 12.00% |
| Healthcare | 10.00% |
| E-commerce | 9.00% |
| Printing & Publishing | 7.00% |
| Industrial Manufacturing | 3.00% |
| Others | 2.00% |
Distribution Channel Insights
The Direct Sales Segment Dominated the Paper Processing Resins Market with 56% of Market Share in 2025
The direct sales segment dominated the market with the largest share of 56% in 2025, and is expected to grow at a CAGR of 5.80% over the forecast period, due to the long-term supply agreements between resin manufacturers and paper producers. Large paper mills prefer direct procurement because they can get a guaranteed product quality, technical assistance, and a continuous supply. Direct partnerships also allow for customised resin products for various paper grades and production needs.
The chemical suppliers segment held the 15% market share in 2025 and is expected to grow at the fastest CAGR of 6.40% over the forecast period, as the demand for integrated chemical solutions in paper manufacturing plants continues to rise. Suppliers provide a wider product range, technical knowledge, and application assistance to facilitate paper converter sourcing. Increasing investments in sustainable resin technologies help build strategic alliances with suppliers. Enlarging regional distribution networks also helps to increase the availability of products and customer responsiveness.
Paper processing resins Market Share, By Distribution Channel,2025(%)
| By Distribution Channel | Market Share (%) |
| Direct Sales | 56.00% |
| Distributors | 22.00% |
| Chemical Suppliers | 15.00% |
| Online Sales | 7.00% |
Regional Insights
How Did the Asia Pacific Dominate the Paper Processing Resins Market in 2025?
The Asia Pacific paper processing resins market size was estimated at USD 2.71 billion in 2025 and is projected to reach USD 4.92 billion by 2035, growing at a CAGR of 6.15% from 2026 to 2035.Asia Pacific dominated the market with the largest share of 45% in 2025 and is expected to grow at a CAGR of 5.20% during the forecast period, due to the rapid industrialization and increase in paper manufacturing capacities in developing countries. Increased packaging demands led to a significant rise in resin consumption in the food, pharmaceutical, and consumer goods sectors. As e-commerce increased, corrugated boxes and specialty paper products increased. Governments actively nurtured sustainable manufacturing by encouraging recycling and environmental laws.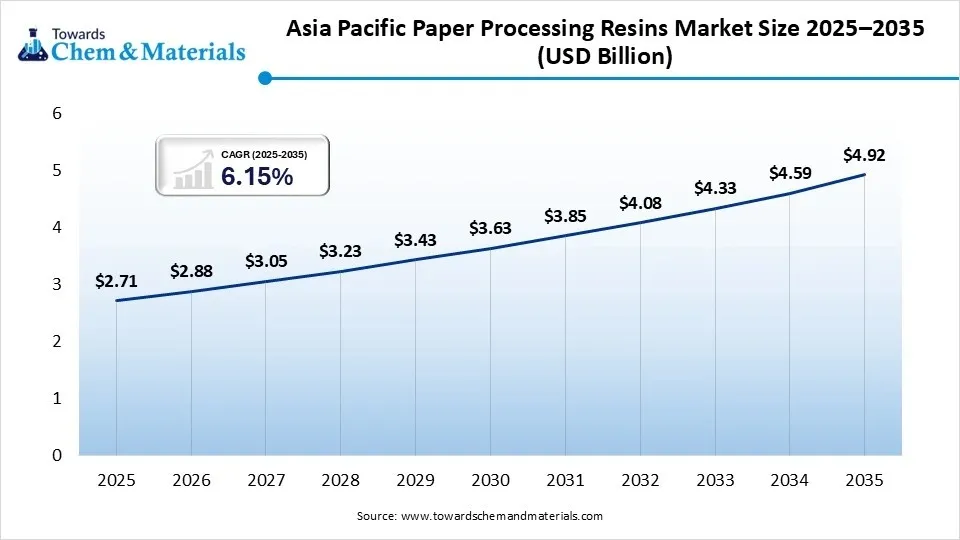
China
China is still the world's top paper producer with a huge production capacity for packaging paper, tissue paper, and specialty paper. Government policies promote the re-use of packaging and the production of environmentally friendly chemicals in industrial processes. Investments in modern paper mills enhance manufacturing efficiency and the use of specialty resin.
India
The Indian paper industry is still growing, with a focus on packaging, as well as on recycled paper production. There is a high need for high-performance paper processing resins as food processing and e-commerce activities rise. Government sustainability initiatives promote the use of recyclable packaging and environmentally friendly manufacturing technologies.
- For instance, in June 2026, Beckers Group's Berger-Becker joint venture opened a new resin manufacturing facility in the city of Nagpur, India, to help enable sustainable coating and resin technologies while enhancing the supply chain's resilience and production capacity.(Source: www.european-coatings.com)
North America Paper Processing Resins Market Growth Factor
The North America paper processing resins market size was estimated at USD 1.15 billion in 2025 and is projected to reach USD 2.11 billion by 2035, growing at a CAGR of 6.26% from 2026 to 2035.North America held 19% market share in 2025 and is expected to grow at the fastest CAGR of 6.80% during the forecast period, owing to the advanced manufacturing technologies and utilization of sustainable packaging materials. New bio-based and low-emission resin formulations were developed as a result of stringent environmental legislation. Specialty paper chemicals continued to benefit from robust demand from the recycling sector, bolstered by a growing infrastructure for recycling. High-performance paper materials were more widely used in food packaging and healthcare.
United States
The U.S. has the lead, with its innovative paper manufacturing processes and its ongoing research and development of specialty chemical innovations. With the growth of the food packaging and healthcare industries, the demand for sustainable paper processing resins is growing every year. Manufacturers are keenly working on bio-based resin technologies to meet changing environmental regulations.
Canada
Canada has a very large forest resource and is home to a robust pulp and paper sector. Sustainable forestry provides an incentive for the production of sustainable paper and packaging products throughout the country. Specialty resin demand continues to be supported by the continued growth in recycling efforts for specialty packaging applications.
Europe Paper Processing Resins Market Growth Factor
The Europe paper processing resins market size was estimated at USD 1.45 billion in 2025 and is projected to reach USD 2.65 billion by 2035, growing at a CAGR of xx% from 2026 to 2035.Europe held 24% market share in 2025 and is expected to grow at a CAGR of 5.40% during the forecast period, due to the strong circular economy and the strict environmental regulations. Recyclable and biodegradable resin technologies were increasingly being used for paper packaging applications. The bio-based chemical innovations facilitated sustainable production in regional paper manufacturing sites. The government promoted investments in recycling facilities and environmentally friendly packaging materials.
Germany
Germany has one of the most sophisticated paper and packaging manufacturing sectors in Europe, with high-tech manufacturing technologies. Businesses are investing in recyclable packaging and innovations in bio-based resin to create sustainable packaging. Specialty paper production remains strong across a variety of end-use industries, as do industrial demand levels.
France
France supports circular economy efforts through the regulation that encourages recyclable packaging and sustainable paper production. Increased adoption of Eco-friendly paper processing resin technologies in food packaging production facilities. Specialty paper production investments continue to help steady the region's market growth.
- For instance, in May 2025, Dow opens an advanced BLUEWAVE™ technology centre in France, allowing the production of waterborne resin dispersions without compromising polymer performance, and with sustainability, recycling, and manufacturing innovation in mind.(Source : corporate.dow.com)
Latin America Paper Processing Resins Market Growth Factor
The Latin America paper processing resins market size was estimated at USD 0.42 billion in 2025 and is projected to reach USD 0.81 billion by 2035, growing at a CAGR of 6.79% from 2026 to 2035.Latin America held 7% market share in 2025 and is expected to grow at a CAGR of 5.70% during the forecast period, as paper packaging production grew and industrial manufacturing activities increased. An increased demand for consumer goods stimulated investment in recycled paper and packaging mills. Governments encouraged sustainable manufacturing by promoting recycling and environmental awareness programs. Demand for high-quality paper processing materials improved in the regional industries due to the strength of the growing exports.
Brazil
Brazil is the largest player in the region with a vibrant pulp and paper sector, due to the fact that it has an abundant forestry sector. Sustainable paper production and specialty resin technologies are where packaging manufacturers are putting increasing resources. As export demand has increased, so too has the demand for advanced paper chemicals. Recycling programs help develop the industry in the long-term.
Chile
The forestry sector in Chile is competitive, and its paper production potential is improving at a continuous rate across the country. Increased use of environmentally friendly paper processing resin technologies is promoted by sustainable production methods. The demand for packaging continues to rise, and the capacity continues to be invested in specialty paper manufacturing plants. The export industry is a key to sustaining regional market growth.
Middle East & Africa Paper Processing Resins Market Growth Factor
The Middle East & Africa paper processing resins market size was estimated at USD 0.30 billion in 2025 and is projected to reach USD 0.59 billion by 2035, growing at a CAGR of 7.00% from 2026 to 2035.The Middle East & Africa held 5% market share in 2025 and is expected to grow at a CAGR of 5.90% during the forecast period, due to an increase in investments in packaging production and industrial diversification programs. The greater shift towards food processing led to a rise in the need for durable and sustainable paper packaging materials. Domestic manufacturing was promoted through the adoption of a supportive industrial development policy and infrastructure investments by the government.
Saudi Arabia
Saudi Arabia is continuing its efforts to diversify its industry under Vision 2030 through major industrial diversification projects. Advanced paper processing resins are used in numerous industries with the growth of packaging production. Investment in sustainable manufacturing reinforces the use of environmentally friendly chemical technologies. Support for the food and consumer goods sectors remains to expand the market.
South Africa
South Africa has a long history of a paper manufacturing sector that caters to packaging, printing, and consumer paper applications. Recycling programs continue to grow and are driving an increase in demand for specialty resins to enhance the quality of recycled paper. Manufacturers invest in sustainable production technologies to improve environmental performance.
Competitive Analysis
The global chemical manufacturers and specialty paper solution providers are in the process of launching new sustainable product innovations, bio-based resin technologies, and strategic capacity expansion, thus creating a moderately consolidated paper processing resins market. Businesses are able to compete by continuing to innovate their wet strength, dry strength, barrier, and coating resins, as well as enhancing their regional manufacturing capabilities and partnerships with paper manufacturers. Global markets are still being driven to a large degree by the investments made in recyclable packaging solutions, low-emission chemistries, and circular economy initiatives that are driving competitive differentiation.
- For instance, in December 2025, Mitsubishi Chemical Corporation (MCC) developed a SoarnoL™ resin coating technology for paper substrates that offers superior gas barrier and oil-resistant properties, which will be useful in future sustainable food packaging.(Source: www.mcgc.com)
- For instance, in May 2026, CJ Biomaterials introduced PHACT™ CB0504A, an all-PHA extrusion coating resin for paper food serviceware, which meets certification for home, industrial, and marine biodegradability, and supports the development of compostable paper packaging solutions.(Source:www.globenewswire.com)
Recent Developments
- In March 2026, GE Vernova (Italy) made a USD 30 million investment to increase its plant capacity in Italy by introducing new production lines for advanced Resin Impregnated Paper (RIP) and Resin Impregnated Synthetic (RIS) technologies. Source: capacityglobal.com)
- In January 2026, Samsung Electronics debuted the 13-inch Samsung Color E-Paper, which uses the world's first phytoplankton-based bio-resin housing, to further a strategy of sustainable materials in ultra-low-power digital signage applications.(Source: news.samsung.com)
Top Players in the Market & Their Offerings
| Company | Major Headquarters | Geographic Presence | Paper Processing Resins Offerings | Key Offering / Strength |
| BASF SE | Germany | Global | Paper coating binders and functional resins | Strong R&D and sustainable resin innovations. |
| Dow Inc. | United States | Global | Latex binders and barrier technologies | Advanced polymer and coating innovations. |
| Seiko PMC Corporation | Japan | Asia, Europe, Americas | Paper strengthening resins | Strong presence in paper chemicals and functional polymers. |
Other Key Players
- Kemira
- Ashland Inc.
- Solenis
- Buckman
- Clariant
- CJ Biomaterials
- Nouryon
- Archroma
- Ecolab
- Mitsubishi Chemical Corporation
- Wacker Chemie AG
- DIC Corporation
Segment Covered in the Report
By Resin Type
- Wet Strength Resins
- Polyamide Epichlorohydrin (PAE)
- Urea Formaldehyde (UF)
- Melamine Formaldehyde (MF)
- Dry Strength Resins
- Polyacrylamide (PAM)
- Starch-Based Resins
- Glyoxylated Polyacrylamide (GPAM)
- Sizing Resins
- Alkyl Ketene Dimer (AKD)
- Alkenyl Succinic Anhydride (ASA)
- Rosin Resins
- Coating Binders
- Styrene Butadiene Latex (SB Latex)
- Acrylic Resins
- Vinyl Acetate Resins
- Functional & Specialty Resins
- Barrier Resins
- Water-Resistant Resins
- Oil & Grease Resistant Resins
- Bio-based Resins
By Chemistry
- Synthetic Resins
- Natural Resins
- Bio-based Resins
- Hybrid Resins
By Function
- Wet Strength Enhancement
- Dry Strength Enhancement
- Surface Sizing
- Pigment Binding
- Barrier Coating
- Water Resistance
- Oil & Grease Resistance
By Paper Type
- Packaging Paper & Paperboard
- Containerboard
- Folding Cartons
- Corrugated Board
- Printing & Writing Paper
- Tissue Paper
- Specialty Paper
- Label Paper
- Release Paper
- Décor Paper
- Electrical Insulation Paper
- Newsprint
By Application
- Packaging
- Printing
- Hygiene Products
- Industrial Paper
- Food Contact Paper
- Labels & Release Liners
- Others
By End-use Industry
- Packaging Industry
- Food & Beverage
- Consumer Goods
- Healthcare
- E-commerce
- Printing & Publishing
- Industrial Manufacturing
- Others
By Distribution Channel
- Direct Sales
- Distributors
- Chemical Suppliers
- Online Sales
By Regions
- North America
- U.S.
- Canada
- Europe
- Germany
- UK
- France
- Italy
- Spain
- Sweden
- Denmark
- Norway
- Asia Pacific
- China
- Japan
- India
- South Korea
- Thailand
- Latin America
- Brazil
- Mexico
- Argentina
- Middle East & Africa
- South Africa
- UAE
- Saudi Arabia
- Kuwait
A Seven-Phase Framework
Our methodology is designed to be universally applicable across commodity chemicals, specialty chemicals, petrochemicals, construction chemicals, coatings, electronic chemicals, industrial gases, agrochemicals, water treatment chemicals, and performance materials. Each phase builds upon the last, creating a layered validation structure that minimizes estimation error and maximizes analytical confidence.
The framework ensures comprehensive market coverage, robust cross-validation, and reliable long-term forecasting — producing market estimates that withstand scrutiny from investors, regulators, and corporate strategy teams.

Seven-Phase Framework — Analytical Effort Distribution
Relative analytical effort allocated across each phase of the Chemicals & Materials research framework

Phase 1 - Secondary Research: Establishing the Foundation
Secondary research collects and evaluates publicly available information from authoritative sources, establishing the foundational understanding of market structure, value chain dynamics, competitive landscape, and end-use demand patterns. Every source is evaluated for credibility, recency, geographic relevance, and methodological soundness before inclusion.
Industry Associations
Sources include ACC, CEFIC, ICCA, JCIA, CPCIF, and SOCMA providing production volumes, consumption trends, capacity developments, and sustainability initiatives.
Company Disclosures
Annual reports, investor presentations, earnings transcripts, and regulatory filings reveal product portfolios, manufacturing footprints, capacity expansions, and revenue segmentation.
Government Databases
National statistical offices, customs authorities, environmental agencies, and industrial production databases provide verified statistics on output, trade flows, and regulatory compliance.
Trade Databases
UN Comtrade, ITC, Eurostat, and national customs authorities enable assessment of global product movement, import dependency, and export competitiveness across regions.
Our Secondary Research Sources
- Ministry of Chemicals and Fertilizers
- European Chemicals Agency
- United States Department of Energy
- Ministry of Industry and Information Technology
- Ministry of Economy Trade and Industry
- Ministry of Trade Industry and Energy
- National Institute of Standards and Technology
- Council of Scientific and Industrial Research
- Fraunhofer Society
- National Institute for Materials Science
Phase 2 — Supply-Side Assessment: Mapping Production Capabilities
Production Capacity Analysis
All major manufacturers are assessed for existing installed capacity, planned additions, expansions, new plant announcements, and technology adoption — mapped at global, regional, and country levels.
Capacity Utilization Adjustment
Installed capacity is adjusted using utilization rates based on demand conditions, feedstock availability, plant operating rates, maintenance schedules, and regulatory restrictions.
Manufacturer Revenue Analysis
Product-specific revenues, segment-level performance, regional distribution, average selling prices, and margin trends are evaluated to establish market value estimates.
Supply-Side Assessment — Capacity vs. Effective Production by Region
Illustrative comparison of installed capacity vs. effective production volume (after utilization rate adjustment) across major regions

Phase 3 — Demand-Side Assessment: Quantifying Chemical Consumption
Demand-side analysis quantifies chemical consumption across industries, applications, and geographies — identifying where and how chemicals are consumed throughout the value chain with precision.
End-Use Industry Analysis
Chemical demand is evaluated across automotive, construction, packaging, electronics, agriculture, healthcare, consumer goods, industrial manufacturing, energy and utilities, and water treatment. Industry output, production trends, and consumption intensity are analyzed to determine demand patterns.
Consumption Modeling
Demand is estimated using measurable indicators: kilograms per vehicle, kilograms per square meter of construction, dosage per cubic meter of water treated, kilograms per hectare of agricultural land, and kilograms per ton of manufactured products. Consumption factors are validated through industry publications and primary interviews.
Application Analysis
The market is segmented by application area to understand product performance requirements, formulation trends, technology adoption, customer preferences, and regulatory requirements improving demand accuracy and segmentation granularity.
Demand-Side Assessment — End-Use Industry Demand Distribution
Illustrative distribution of chemical & materials demand across key end-use industries

Phase 4 - Trade Flow Analysis: Balancing Regional Supply and Demand
Trade flow analysis reconciles regional supply and demand estimates through import and export data, identifying net supply positions, regional dependencies, and market imbalances. It serves as an independent validation layer that tests the consistency of supply-side and demand-side estimates.
Import Analysis
Import data is evaluated to determine volumes, source countries, product dependency, regional supply gaps, and pricing trends — identifying markets that rely heavily on external supply and where domestic production is insufficient to meet demand.
Export Analysis
Export assessments reveal production surplus, export competitiveness, regional manufacturing strength, and global market participation. Export patterns also help validate domestic production estimates and identify net exporting regions.
Apparent Consumption Model
Regional consumption is assessed using the standard apparent consumption formula:
Results identify net importing regions, net exporting regions, regional deficits, and surpluses — serving as an independent validation of supply and demand estimates.
Trade Flow Analysis — Net Supply Position by Region
Illustrative apparent consumption vs. domestic production across major regions — positive gap indicates net import dependency

Phase 5 — Primary Research: The Critical Validation Layer
Primary research tests and refines findings from secondary research through direct engagement with industry participants across the supply chain, demand side, and expert community. It captures intelligence that no database or published report can provide — the real-world experience of manufacturers, buyers, and specialists operating in the market.

Supply-Side Interviews
Conversations with chemical manufacturers, raw material suppliers, contract manufacturers, technology providers, and plant operators cover production trends, capacity utilization, pricing developments, technology shifts, and competitive dynamics.

Demand-Side Interviews
Engagement with OEMs, industrial consumers, procurement managers, distributors, formulators, and end-use manufacturers focuses on consumption trends, purchasing behavior, product substitution, demand outlook, and emerging applications.

Industry Expert Consultations
Additional interviews with industry consultants, independent experts, regulatory specialists, technical professionals, and research institutions provide deeper market context and validate key analytical assumptions.
Focus Areas of Primary Research:
Market Size & Forecast Validation
Revenue estimates, volume consumption, growth rates, forecast assumptions, regional demand.Supply Chain & Value Chain Assessment
Raw material sourcing, supply chain challenges, distribution networks, procurement practices.Production & Capacity Analysis
Manufacturing capacity, utilization rates, expansion projects, plant investments.Pricing & Cost Structure Analysis
Product pricing trends, feedstock costs, energy costs, margin pressures, pricing outlook.Competitive Landscape Assessment
Volume and value estimates confirmed to be fully consistent with one another before publicationInterview Volume by Market Scope
| Study Scope | Number of Interviews |
|---|---|
| Niche Market | 20 – 30 |
| Mid-Sized Market | 30 – 50 |
| Global Market | 50 – 80 |
| Highly Fragmented Market | 80 – 120 |
Interview Details:
Category : Manufacturers, Suppliers, Distributors, End Users, Experts/Associations
Average Duration : 30–60 Minutes
Interview Mode : Video calls, telephonic interviews, expert consultations
Interview Format : Structured / Semi-Structured questionnaire
Focus Areas of Primary Research:
Market Size & Forecast Validation :
Revenue estimates, volume consumption, growth rates, forecast assumptions, regional demand.
Supply Chain & Value Chain Assessment :
Raw material sourcing, supply chain challenges, distribution networks, procurement practices.
Production & Capacity Analysis :
Manufacturing capacity, utilization rates, expansion projects, plant investments.
Pricing & Cost Structure Analysis :
Product pricing trends, feedstock costs, energy costs, margin pressures, pricing outlook.
Competitive Landscape Assessment :
Market share, competitor positioning, strategic initiatives, partnerships, acquisitions.
Primary Research — Stakeholder Coverage by Category
Distribution of interview respondents across stakeholder categories (% share from PPT data)

Primary Research — Respondent Designation Profile
Seniority breakdown of interview respondents (% share from PPT data)

Primary Research — Geographic Coverage of Interviews
Regional distribution of primary research engagement (% share from PPT data)

Phase 6 — Data Triangulation and Market Validation
No single methodology is relied upon in isolation. Multiple independent estimation approaches are combined and reconciled to ensure consistency, accuracy, and analytical defensibility. Any material deviations between approaches are investigated and adjusted through additional validation cycles.
The final market size is derived through weighted triangulation of all validated methodologies. Any material deviations between approaches are investigated and adjusted through additional validation cycles. The outcome represents the most realistic assessment of the market based on available evidence and expert confirmation ensuring that volume and value estimates are fully consistent with one another.
Triangulation Framework — Input Contribution Weight
Relative weight each sizing input contributes to the final reconciled market estimate

Phase 7 — Forecast Modeling: Projecting Future Market Evolution
Forecasting evaluates the future trajectory of the market using a combination of quantitative indicators and qualitative assessments across economic, industry, and regulatory dimensions. Rather than simple extrapolation, each driver is independently modeled and integrated into a composite forecast.
Macroeconomic Indicators
GDP growth, industrial production, manufacturing output, construction activity, consumer spending, and capital investment form the quantitative foundation of long-term demand projections. These are applied at country, regional, and global levels.
Industry Growth Drivers
Urbanization, infrastructure development, industrialization, technological innovation, sustainability initiatives, and evolving product performance requirements are assessed at regional and industry levels — capturing both structural and cyclical demand drivers.
Capacity Expansion Analysis
Announced plant expansions, new manufacturing facilities, technology upgrades, and strategic investments are evaluated to determine future supply-demand dynamics and potential market tightness or oversupply situations.
Regulatory & Sustainability
Environmental regulations, chemical safety standards, emission reduction targets, circular economy initiatives, and sustainability requirements are incorporated as they often influence product adoption rates and market growth trajectories.
Scenario Forecast Range — Indexed Market Growth (Year 1–10)
Illustrative indexed growth trajectories across Base, Optimistic, and Pessimistic scenarios over a 10-year forecast horizon

Forecast Drivers — Relative Impact Score by Category
Impact score (0–100) of each driver type on chemicals & materials market forecast




Comments
Share your thoughts, ask a question, or provide feedback about this report.