
Helium Market Size Analysis Report 2035
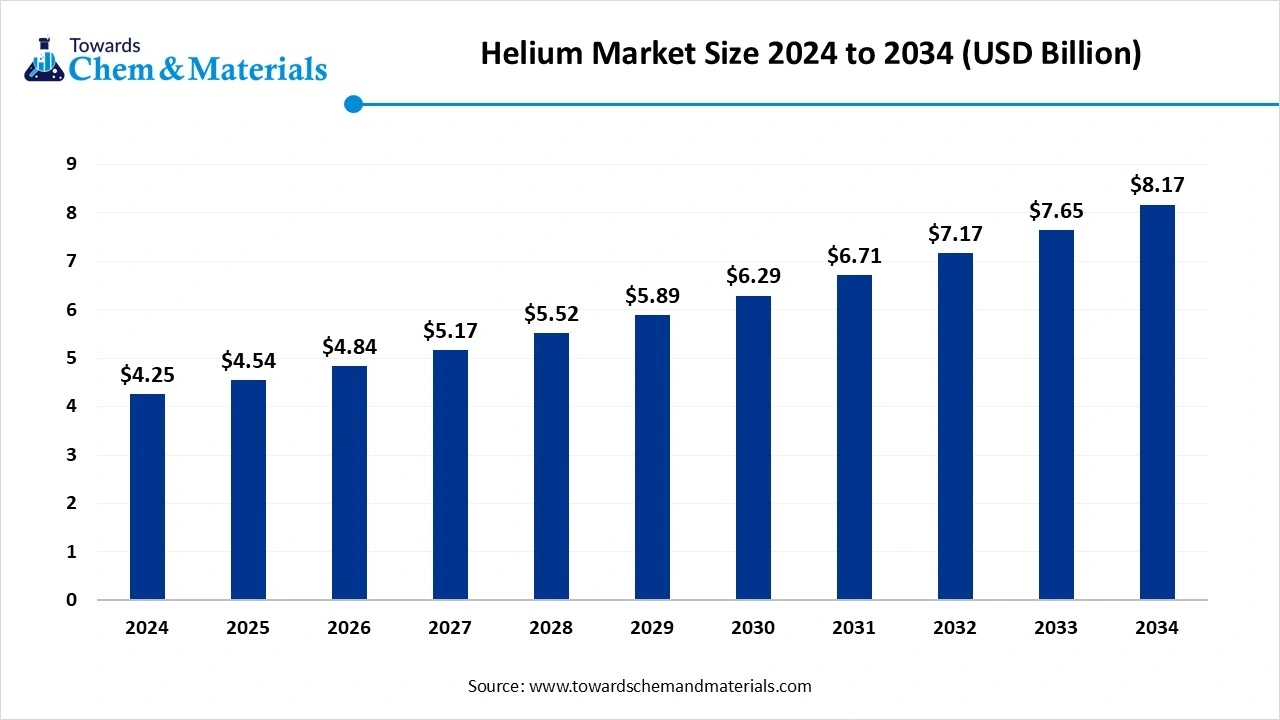
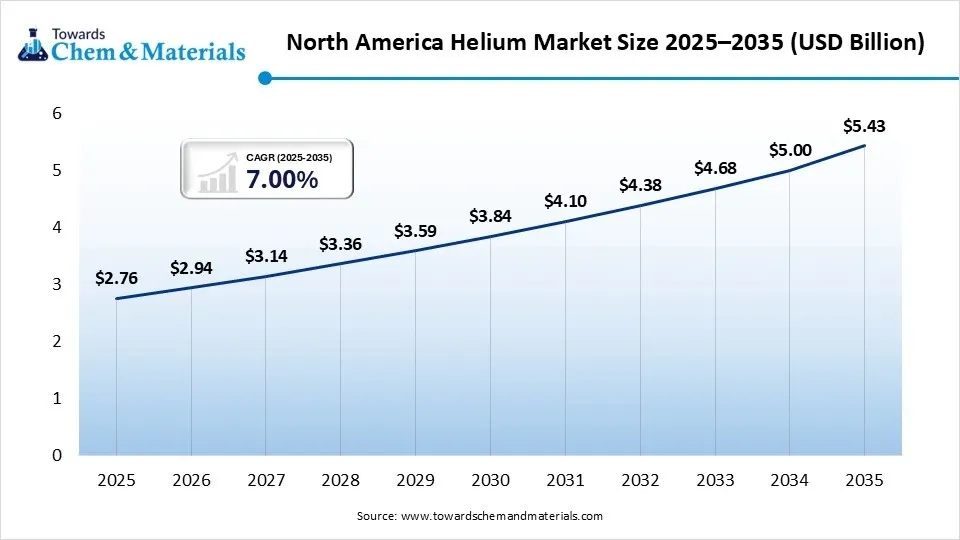
The global helium market size was valued at USD 8.35 billion in 2025, is estimated to reach USD 8.92 billion in 2026, and is projected to reach USD 16.20 billion by 2035, exhibiting a compound annual growth rate (CAGR) of 6.85% over the forecast period from 2026 to 2035.North America dominated the helium market with the largest revenue share of 33% in 2025 and is expected to grow at the fastest CAGR of 7.00% during the forecast period. The growing demand from the healthcare and high-tech sectors is the key factor driving market growth. Also, global expansion of healthcare infrastructure coupled with the innovations in recovery and recycling can fuel market growth further.
Market Highlights
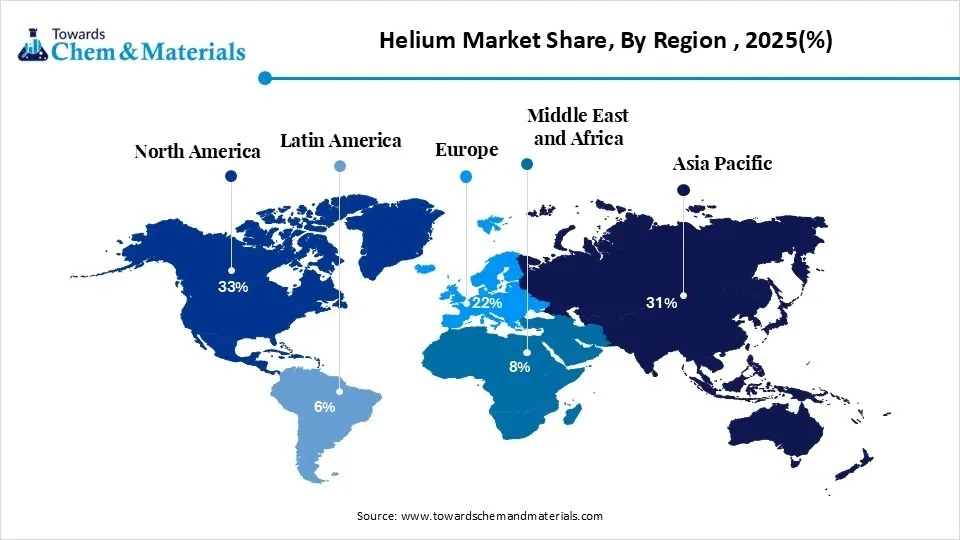
- By region, North America dominated the market with the largest share of 33% in 2025. The dominance of the region can be attributed to the growing healthcare imaging market.
- By region, Asia Pacific held a market share of 31% in 2025 and is expected to grow at the fastest CAGR of 8.20% over the forecast period. The growth of the region can be credited to the increasing investment in healthcare infrastructure.
- By phase, the gas segment dominated the market with the largest share of 72% in 2025. The dominance of the segment can be attributed to the growing consumption of gas across the globe.
- By phase, the liquid segment held a market share of 28% in 2025 and is expected to grow at the fastest CAGR of 7.60% in 2025. The growth of the segment can be credited to the growing demand for liquid helium from different sectors.
- By application, the cryogenics segment dominated the market with the largest share of 34% in 2025. The dominance of the segment can be linked to the growing adoption of quantum technology.
- By application, the leak detection segment held a market share of 12% in 2025 and is expected to grow at the fastest CAGR of 8.10% during the forecast period. The growth of the segment can be driven by growing aerospace inspection activities.
- By end use, the medical & healthcare segment dominated the market with the largest share of 31% in 2025. The dominance of the segment is owing to the increasing demand for diagnostic imaging.
- By end use, the electronics & electrical segment held a market share of 25% in 2025 and is expected to grow at the fastest CAGR of 8.40% during the projected period. The growth of the segment is due to ongoing expansion of semiconductor capacity.
The Power of Helium in Industries and Science
Helium is a chemical element that is a nontoxic, tasteless, odourless, and colorless gas. It is lighter than air and possesses very low chemical reactivity. The atomic number of helium is two, and its atomic weight is 4.002602. These properties of helium play a pivotal role in national defense, the medical industry, space exploration, and high technology manufacturing. Helium is liquid at a temperature near absolute zero. It is widely used to fill party and parade balloons. Neon lasers made up of helium are used in eye surgery, and helium is also used in rare document preservation. It is used as an inert gas for welding metals like aluminium. The growing demand for applications like welding, leak detection, and cryogenics increases the demand for helium. The growing demand for semiconductor manufacturing helps in the market growth. Factors like advancements in electronics, growing demand from healthcare, rising adoption of renewable energy sources, and growing investment in the aerospace & defense sector contribute to the overall growth of the helium market.
MRI Healthcare Infrastructure Growth Supports Market Growth
The surge in consumption of helium by the healthcare sector due to the need for liquid helium for the effective functioning of MRI systems is presenting lucrative opportunities in the market. The fast growth of manufacturing facilities in the semiconductor sector becomes a strong factor for market expansion.
- In April 2026, Rift Helium Plc officially joined Londons AIM market after securing £8.1 million through an initial public offering. This capitalization allows the Tanzania-focused explorer to fund the next phase of development at its Upepo helium project, which includes upcoming 3D seismic programs and preparation for drilling.(Source:www.proactiveinvestors.com)
The company said the fundraising, completed through a placement and direct subscription, will support growth further.
Market Trends
- The growing demand from the healthcare sector: The growing expansion of the healthcare sector and increasing prevalence of chronic diseases fuel demand for helium for various applications. Helium is widely used in MRI machines, respiratory treatments, laparoscopic surgeries, and imaging techniques.
- The growing space exploration: The increasing global investment in space exploration increases demand for helium. In space exploration, helium is used in leak detection, fuel tank pressurization, and cooling systems in spacecraft & rockets.
- The increasing demand for industrial applications: The growing demand for various industrial applications like leak detection, welding, and instrumentation increases demand for helium.
Report Scope
| Report Attributes | Details |
| Market Size in 2026 | USD 8.92 Billion |
| Market Size by 2035 | USD 16.20 Billion |
| Growth Rate from 2025 to 2035 | CAGR 6.85% |
| Base Year of Estimation | 2025 |
| Forecast Period | 2025 - 2035 |
| High Impact Region | North America |
| Segment Covered | By Phase, By Application, By End Use, By Region |
| Key Companies Profiled | Linde Plc, Messer Group, MESA Specialty Gases & Equipment, Air Products and Chemicals, Inc., Air Liquide, Taiyo Nippon Sanso India, Matheson Tri-Gas Inc., Gazprom PJSC, IACX Energy, Iwatani corporation, Gulf Cryo S.A.L. |
Supply Chain Analysis of the Helium Market
Production & Processing
- Helium is not directly mined; rather, it is recovered as a byproduct during natural gas processing. As a geologically finite and non-renewable resource, its production and refinement pipeline require highly specialized, capital-intensive infrastructure and are also controlled by a limited number of vertically integrated industrial gas conglomerates.
- Linde plc: One of the largest industrial gas companies globally. Linde manages extensive upstream and downstream capabilities, including massive helium storage caverns and large-scale liquefaction plants.
- Other Key Players: Messer Group, QatarEnergy LNG
Quality Testing and Certification
- This refers to the strict methodologies employed to quantify gas composition and identify micro-leaks. It serves to validate that the product adheres to rigorous global industry regulations prior to commercial distribution.
- Air Products: A dominant vendor providing bulk gas, specialty materials, and testing equipment to the global electronics sector.
- Other Key Players: Pfeiffer Vacuum, INFICON
Distribution to Industrial Users
- It involves distributing purified helium in gaseous or liquid states from primary refiners to end-users across critical sectors, including healthcare, electronics, and aerospace. Because of the elements high volatility and susceptibility to boil-off, this logistical phase strictly necessitates specialized cryogenic equipment.
- QatarEnergy: Operating out of the Middle East, it is a primary manufacturer producing helium as a byproduct of natural gas, supplying raw and refined liquid helium to major global distributors.
- Other Key Players: Iwatani Corporation, Messer Group
Market Opportunity
The Growing Expansion of the Semiconductor Industry
The growing expansion of the semiconductor industry increases the demand for helium. The growing demand for semiconductor manufacturing fuels the demand for helium to ensure optimal performance and prevent overheating. The growing advancements in the semiconductor industry, like quantum computing, AI, and others, increase demand for helium. Helium controls temperature during wafer production. The growing demand for cooling agents for semiconductor production increases the adoption of helium to maintain optimal temperature. It prevents oxidation during the manufacturing of semiconductors.
The growing demand for cooling components in advanced technologies like quantum computing increases the demand for helium cryogenic processes. Helium creates protective atmospheres during semiconductor manufacturing processes. The growing expansion of the semiconductor industry creates the opportunity for the growth of the helium market.
- India exported $2.07B of semiconductor devices in 2023. (Source: oec.world)
Market Challenge
Complex Extraction & Processing Limits Expansion of the Helium Market
Despite several benefits of helium across various industries, complex extraction & processing restricts market growth. The cost of the process of extracting and processing helium is high. Helium is extracted from natural gas byproducts. The extraction of helium involves various processes like pre-treatment of natural gas, cryogenic distillation, purification, and additional methods like adsorption & membrane separation, which are complex. Helium extraction is completely dependent on the production of natural gas. The complex extraction processes require a number of facilities. Pre-treatment of the natural gas process includes initial purification and heavy hydrocarbon removal. Cryogenic distillation involves cooling, liquefication, and separation. Purification includes impurity removal & extraction of grade A helium. The complex extraction and processing hamper the growth of the market.
Segmental Insights
Phase Insights
The gas phase segment dominate the helium market in 2025. The growing production of modern electronic devices and semiconductors increases demand for helium gas. The growing demand from a wide range of industries, like leak detection and welding, helps in the market growth. The growing need to create controlled environments during the manufacturing of semiconductors and electronics fuels demand for helium. The growing demand for purging and pressurizing tanks in the aerospace industry increases demand for helium, helping in the market growth. The growing utilization of medical imaging equipment, like lung ventilators and MRI, drives the growth of the overall market.
The liquid phase segment is the fastest growing in the market during the forecast period. The growing demand for MRI diagnostics and the increasing demand for cooling superconducting magnets fuel demand for liquid gas. The growing demand for maintaining extremely low temperatures in scientific research applications like space exploration, quantum computing, and particle accelerators helps in the market growth. The growing demand for MRI machines in various regions increases the demand for helium. The growing demand from various industrial applications like crystal growth, rocket fuel tanks, and many other applications increases the demand for helium. The growing expansion of the healthcare industry, especially in countries like India and China, increases demand for helium, driving the overall growth of the market.
Application Insights
Why Cryogenics Segment Dominate the Helium Market?
The cryogenics segment dominate the helium market in 2024. The growing demand for biological sample preservation, such as tissue samples, eggs, and embryos, increases demand for cryogenics. The increasing demand from medical applications like blood preservation, cryosurgery, cryotherapy, and tissue preservation helps in the market growth. The growing demand for electronic devices fuels the adoption of cryogenic cooling to enhance the performance of devices. The growing automotive industry and rising demand for various food & beverages increase demand for cryogenics for cooling certain components and preservation of food. The wide range of applications, like facilitating scientific experiments, regenerative medicine, cooling materials & equipment, and advancement in biotechnology, drives market growth. Additionally, the growing demand from space exploration for various purposes like spacecraft & cooling infrared detectors on telescopes supports the overall growth of the market.
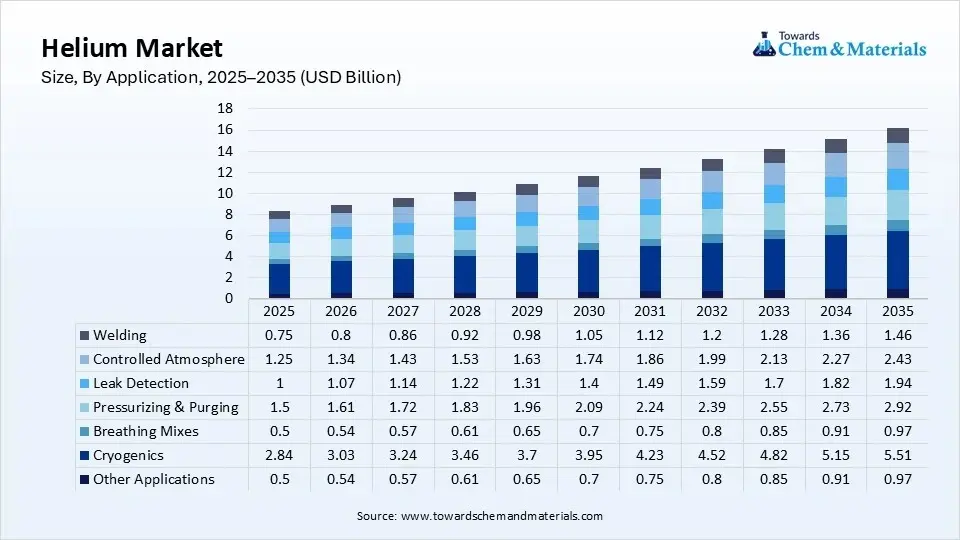
The leak detection segment experiences the fastest growth in the market during the forecast period. The stricter environmental regulations increase demand for leak detection. The growing demand from the automotive industry for testing of components like air conditioning systems, fuel lines, and engine components helps in the market growth. The rising technological advancements, like AI & automation integrations, are developing more advanced helium leak detectors. These detectors detect extremely low leak rates and identify the smallest defect in systems & components. Additionally, growing demand across various industries like medical devices, aerospace, construction, and electronics drives the overall growth of the market.
Helium Market Share, By Application, 2025(%)
| By Application | Market Share (%) |
| Cryogenics | 34% |
| Breathing Mixes | 6% |
| Pressurizing & Purging | 18% |
| Leak Detection | 12% |
| Controlled Atmosphere | 15% |
| Welding | 9% |
| Other Applications | 6% |
End Use Insights
The medical & healthcare segment dominated the helium market in 2025. The growing demand for MRI examinations and the increasing installation of MRI units in various healthcare settings help in the market growth. The growing various respiratory conditions like COPD & Asthma increases demand for breathing mixtures made from helium. The growing demand from various medical applications and the increasing demand for preserving biological samples fuel demand for helium cryogenics. The ongoing research in nuclear magnetic resonance spectroscopy increases demand for helium. Additionally, the growing expansion of healthcare infrastructure and the rising requirement for advanced imaging facilities support the overall growth of the market.
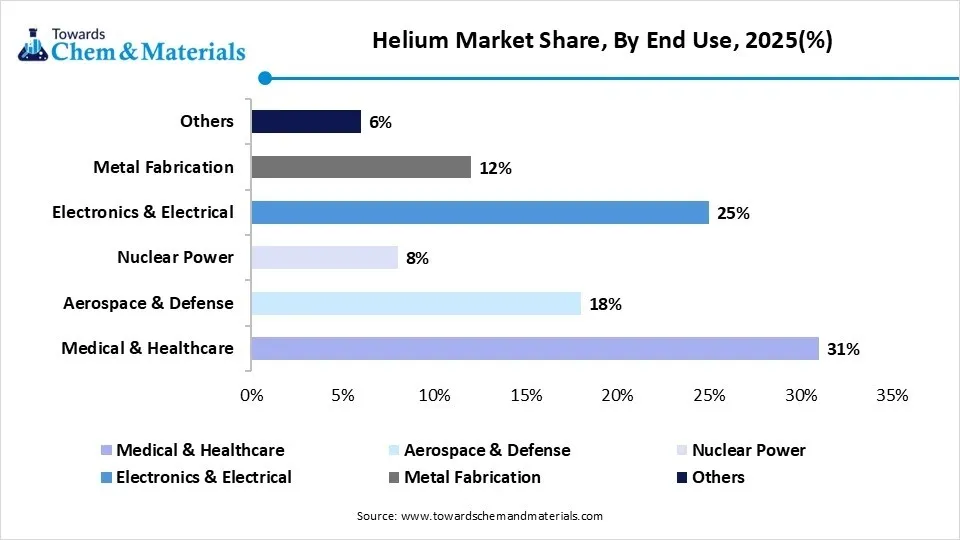
The electronics & electrical segment is the fastest growing in the market during the forecast period. The rising demand for LED screens fuels demand for helium for inert atmosphere and cooling, helping in the market growth. The growing demand for minimizing defects, cooling electronic components, and enhancing quality increases demand for helium. The growing adoption of high-performance functionality electronic devices fuels demand for helium. The increasing demand for leak detection in electrical parts helps in the market growth. Additionally, growing consumer electronics production, miniaturization of devices, and technological advancements support the market growth.
Helium Market Share, By End Use, 2025(%)
| By End Use | Market Share (%) |
| Medical & Healthcare | 31% |
| Aerospace & Defense | 18% |
| Nuclear Power | 8% |
| Electronics & Electrical | 25% |
| Metal Fabrication | 12% |
| Others | 6% |
Regional Insights
How Did North America dominate the Helium Market in 2025?
The North America helium market size was estimated at USD 2.76 billion in 2025 and is projected to reach USD 5.43 billion by 2035, growing at a CAGR of 7.00% from 2026 to 2035.North America dominated the market with the largest share of 33% in 2025. The dominance of the region can be attributed to the growing healthcare imaging, semiconductor manufacturing, and aerospace/defense sectors. In addition, the region hosts prominent aerospace corporations and defense contractors. Helium is essential in this sector for pressurizing liquid propellant tanks, purging gas lines, and facilitating satellite launches.
United States
- U.S. foundries increasingly use high-purity gaseous helium as a carrier gas, reaction moderator, and coolant for wafer manufacturing.
- The U.S. operates the worlds largest installed base of MRI scanners, needing vast amounts of liquid helium to maintain superconducting magnets.
Canada
- The growth of the global semiconductor industry is directly boosting helium consumption due to its use in extreme thermal management and wafer manufacturing.
- Canadas federal and provincial governments are heavily investing in the sector, offering companies such as Helium to accelerate resource exploration and production.
Asia Pacific held a market share of 31% in 2025 and was expected to grow at the fastest CAGR of 8.20% over the forecast period. The growth of the region can be credited to the increasing investment in healthcare infrastructure and expanding semiconductor manufacturing, coupled with the investments in quantum computing laboratories. The rapid expansion of aerospace and satellite launch initiatives in nations such as China and Japan is generating a substantial increase in the demand for high-purity helium.
China
- Chinas rapidly growing fab footprint needs immense volumes of helium for wafer cooling and to create inert environments during chip fabrication.
- Expanding healthcare infrastructure has led to a surge in the installation of MRI machines, which depends entirely on liquid helium to maintain superconducting magnets.
India
- The growing healthcare infrastructure in India needs massive amounts of liquid helium to cool and operate superconducting magnets in MRIs.
- Indias push to become a global electronics manufacturing hub heavily fuels the demand for high-purity helium.
Europe held a market share of 22% in 2025. The growth of the region can be linked to the escalating requirement for advanced, non-invasive diagnostic capabilities, which has created a robust global market for state-of-the-art MRI hardware and software solutions. Also, the European aerospace and defense sectors, boosted by initiatives of the European Space Agency (ESA), depend heavily on helium.
Germany
- Germany’s world-class healthcare system depends heavily on liquid helium to maintain the superconductivity of magnets in MRI and NMR systems.
- Germany has a strong domestic and foreign presence in semiconductor manufacturing. Heliums unique thermal conductivity and inertness are strictly required for wafer cooling.
France
- France has a highly developed aerospace industry, such as the operations surrounding the European Space Agency.
- Helium is heavily used in Frances advanced manufacturing for controlled atmosphere welding and specialized leak testing for the growing electric vehicle (EV) battery sector.
Latin America held a market share of 6% in 2025. The growth of the region can be driven by ongoing urbanization and the expanding healthcare industry, coupled with the surge in investments in the aerospace and defense sectors. The continuous expansion of regional university and scientific research infrastructure needs a reliable pipeline of both liquid and gaseous helium to facilitate low-temperature physics experiments and analytical instrumentation.
Brazil
- Brazil is witnessing a rise in high-tech manufacturing, requiring liquid and gaseous helium for wafer cooling, plasma etching, and leak detection in chip fabrication.
- The countrys expanding petrochemical, automotive, and nuclear energy sectors use helium for metal welding and strict leak detection processes.
Argentina
- Argentinas industrial and automotive sectors heavily use helium-shielded welding and leak detection, such as in HVAC systems and alternative fuel vehicle manufacturing.
- Growing cryogenics, quantum computing, and material sciences in local academic and research laboratories continuously drive secondary helium consumption.
The Middle East & Africa held a market share of 8% in 2025. The growth of the region can be attributed to the continuous growth of the aerospace and defense industries, along with ongoing initiatives to localize critical resource supply chains. Furthermore, major market players are heavily funding primary helium exploration programs in underdeveloped geological zones throughout Southern Africa, leading to regional growth soon.
Saudi Arabia
- The increasing prevalence of diagnostic imaging drives demand for liquid helium to cool the superconducting magnets in MRI machines.
- Investments into new scientific research facilities, aerospace projects, and advanced technology parks further stimulate localized specialty gas consumption.
UAE
The UAE governments strategic push into aerospace, satellite programs, and advanced scientific research needs continuous supplies of helium for various pressurization operations.
The UAEs emphasis on premium medical infrastructure creates steady demand for liquid helium, which is non-substitutable for cooling superconducting magnets in MRI machines.
Recent Developments
- In April 2026, the ambassador of Turkmenistan to Japan, Atadurdy Bayramov, convened a formal meeting with Professor Hideomi Koinuma, president of the Turkmen Japanese Scientific and Technological Association, and representatives from partner Japanese corporations. The high-level session focused on evaluating the technical and economic viability of an innovative joint project dedicated to the industrial extraction of helium from liquefied natural gas.(Source:business.com.tm)
Top Companies List
- Linde Plc
- Messer Group
- MESA Specialty Gases & Equipment
- Air Products and Chemicals, Inc.
- Air Liquide
- Taiyo Nippon Sanso India
- Matheson Tri-Gas Inc.
- Gazprom PJSC
- IACX Energy
- Iwatani corporation
- Gulf Cryo S.A.L.
Segments Covered
- By Phase
- Gas
- Compressed Helium Gas
- High-Purity Helium Gas
- Ultra-High Purity Helium Gas
- Liquid
- Bulk Liquid Helium
- Research Grade Liquid Helium
- Medical Grade Liquid Helium
- Gas
- By Application
- Cryogenics
- MRI Cooling
- NMR Systems
- Scientific Research
- Superconducting Magnets
- Breathing Mixes
- Deep Sea Diving
- Medical Respiratory Mixtures
- Pressurizing & Purging
- Rocket Fuel Tanks
- Semiconductor Manufacturing
- Industrial Systems
- Leak Detection
- Automotive Testing
- Aerospace Testing
- Industrial Equipment Inspection
- Controlled Atmosphere
- Fiber Optics Manufacturing
- Semiconductor Production
- Metallurgical Processing
- Welding
- Arc Welding
- Laser Welding
- Specialty Metal Welding
- Other Applications
- Lifting Gas
- Analytical Instruments
- Carrier Gas Applications
- Cryogenics
- By End Use
- Medical & Healthcare
- MRI Systems
- Diagnostic Equipment
- Research Laboratories
- Aerospace & Defense
- Space Exploration
- Satellite Manufacturing
- Defense Systems
- Nuclear Power
- Reactor Cooling
- Nuclear Research Facilities
- Electronics & Electrical
- Semiconductor Manufacturing
- Fiber Optics
- Electronics Assembly
- Metal Fabrication
- Welding Operations
- Heat Treatment
- Industrial Processing
- Others
- Scientific Research
- Energy Sector
- Automotive Industry
- Medical & Healthcare
By Region
- North America
- U.S.
- Canada
- Europe
- Germany
- UK
- France
- Italy
- Spain
- Sweden
- Denmark
- Norway
- Asia Pacific
- China
- Japan
- India
- South Korea
- Thailand
- Latin America
- Brazil
- Mexico
- Argentina
- Middle East & Africa
- South Africa
- UAE
- Saudi Arabia
- Kuwait
Table of Contents
Chapter 1. Methodology and Scope
1.1. Market Segmentation & Scope
1.2. Market Definition
1.3. Information Procurement
1.3.1. Information Analysis
1.3.2. Market Formulation & Data Visualization
1.3.3. Data Validation & Publishing
1.4. Research Scope and Assumptions
1.4.1. List of Data Sources
Chapter 2. Executive Summary
2.1. Market Snapshot
2.2. Segmental Outlook
2.3. Competitive Outlook
Chapter 3. Market Variables, Trends, and Scope
3.1. Global Helium Market Outlook
3.2. Value Chain Analysis
3.2.1. Raw Material Outlook
3.2.2. Manufacturing/Technology Outlook
3.2.3. Sales Channel Analysis
3.3. Price Trend Analysis
3.3.1. Factors Influencing Prices
3.4. Regulatory Framework
3.4.1. Standards & Compliances
3.5. Market Dynamics
3.5.1. Market Driver Analysis
3.5.2. Market Restraint Analysis
3.5.3. Market Challenges Analysis
3.5.4. Market Opportunity Analysis
3.6. Porter’s Five Forces Analysis
3.6.1. Bargaining Power of Suppliers
3.6.2. Bargaining Power of Buyers
3.6.3. Threat of Substitution
3.6.4. Threat of New Entrants
3.6.5. Competitive Rivalry
3.7. PESTLE Analysis
3.7.1. Political
3.7.2. Economic
3.7.3. Social Landscape
3.7.4. Technology
3.7.5. Environmental
3.7.6. Legal
Chapter 4. Helium Market: Phase Estimates & Trend Analysis
4.1. Helium Market: Phase Movement Analysis, 2026 & 2035
4.2. Gas
4.2.1. Market estimates and forecasts, 2021 - 2035
4.3. Liquid
4.3.1. Market estimates and forecasts, 2021 - 2035
Chapter 5. Helium Market: Application Estimates & Trend Analysis
5.1. Helium Market: Phase Movement Analysis, 2026 & 2035
5.2. Breathing Mixes
5.2.1. Market estimates and forecasts, 2021 - 2035
5.3. Cryogenics
5.3.1. Market estimates and forecasts, 2021 - 2035
5.4. Leak Detection
5.4.1. Market estimates and forecasts, 2021 - 2035
5.5. Pressurizing & Puring
5.5.1. Market estimates and forecasts, 2021 - 2035
5.6. Welding
5.6.1. Market estimates and forecasts, 2021 - 2035
5.7. Controlled Atmosphere
5.7.1. Market estimates and forecasts, 2021 - 2035
5.8. Other Applications
5.8.1. Market estimates and forecasts, 2021 - 2035
Chapter 6. Helium Market: End Use Estimates & Trend Analysis
6.1. Helium Market: End Use Movement Analysis, 2026 & 2035
6.2. Aerospace & Defense
6.2.1. Market estimates and forecasts, 2021 - 2035
6.3. Medical & Healthcare
6.3.1. Market estimates and forecasts, 2021 - 2035
6.4. Electronics & Electrical
6.4.1. Market estimates and forecasts, 2021 - 2035
6.5. Nuclear Power
6.5.1. Market estimates and forecasts, 2021 - 2035
6.6. Metal Fabrication
6.6.1. Market estimates and forecasts, 2021 - 2035
6.7. Other End Uses
6.7.1. Market estimates and forecasts, 2021 - 2035
Chapter 7. Helium Market: Regional Estimates & Trend Analysis
7.1. Regional Analysis, 2026 & 2035
7.2. North America
7.2.1. Market estimates and forecasts, 2021 - 2035
7.2.2. Market estimates and forecasts, by phase, 2021 - 2035
7.2.3. Market estimates and forecasts, by application, 2021 - 2035
7.2.4. Market estimates and forecasts, by end use, 2021 - 2035
7.2.5. U.S.
7.2.5.1. Market estimates and forecasts, 2021 - 2035
7.2.5.2. Market estimates and forecasts, by phase, 2021 - 2035
7.2.5.3. Market estimates and forecasts, by application, 2021 - 2035
7.2.5.4. Market estimates and forecasts, by end use, 2021 - 2035
7.2.6. Canada
7.2.6.1. Market estimates and forecasts, 2021 - 2035
7.2.6.2. Market estimates and forecasts, by phase, 2021 - 2035
7.2.6.3. Market estimates and forecasts, by application, 2021 - 2035
7.2.6.4. Market estimates and forecasts, by end use, 2021 - 2035
7.2.7. Mexico
7.2.7.1. Market estimates and forecasts, 2021 - 2035
7.2.7.2. Market estimates and forecasts, by phase, 2021 - 2035
7.2.7.3. Market estimates and forecasts, by application, 2021 - 2035
7.2.7.4. Market estimates and forecasts, by end use, 2021 - 2035
7.3. Europe
7.3.1. Market estimates and forecasts, 2021 - 2035
7.3.2. Market estimates and forecasts, by phase, 2021 - 2035
7.3.3. Market estimates and forecasts, by application, 2021 - 2035
7.3.4. Market estimates and forecasts, by end use, 2021 - 2035
7.3.5. Germany
7.3.5.1. Market estimates and forecasts, 2021 - 2035
7.3.5.2. Market estimates and forecasts, by phase, 2021 - 2035
7.3.5.3. Market estimates and forecasts, by application, 2021 - 2035
7.3.5.4. Market estimates and forecasts, by end use, 2021 - 2035
7.3.6. UK
7.3.6.1. Market estimates and forecasts, 2021 - 2035
7.3.6.2. Market estimates and forecasts, by phase, 2021 - 2035
7.3.6.3. Market estimates and forecasts, by application, 2021 - 2035
7.3.6.4. Market estimates and forecasts, by end use, 2021 - 2035
7.3.7. France
7.3.7.1. Market estimates and forecasts, 2021 - 2035
7.3.7.2. Market estimates and forecasts, by phase, 2021 - 2035
7.3.7.3. Market estimates and forecasts, by application, 2021 - 2035
7.3.7.4. Market estimates and forecasts, by end use, 2021 - 2035
7.3.8. Italy
7.3.8.1. Market estimates and forecasts, 2021 - 2035
7.3.8.2. Market estimates and forecasts, by phase, 2021 - 2035
7.3.8.3. Market estimates and forecasts, by application, 2021 - 2035
7.3.8.4. Market estimates and forecasts, by end use, 2021 - 2035
7.3.9. Spain
7.3.9.1. Market estimates and forecasts, 2021 - 2035
7.3.9.2. Market estimates and forecasts, by phase, 2021 - 2035
7.3.9.3. Market estimates and forecasts, by application, 2021 - 2035
7.3.9.4. Market estimates and forecasts, by end use, 2021 - 2035
7.4. Asia Pacific
7.4.1. Market estimates and forecasts, 2021 - 2035
7.4.2. Market estimates and forecasts, by phase, 2021 - 2035
7.4.3. Market estimates and forecasts, by application, 2021 - 2035
7.4.4. Market estimates and forecasts, by end use, 2021 - 2035
7.4.5. China
7.4.5.1. Market estimates and forecasts, 2021 - 2035
7.4.5.2. Market estimates and forecasts, by phase, 2021 - 2035
7.4.5.3. Market estimates and forecasts, by application, 2021 - 2035
7.4.5.4. Market estimates and forecasts, by end use, 2021 - 2035
7.4.6. India
7.4.6.1. Market estimates and forecasts, 2021 - 2035
7.4.6.2. Market estimates and forecasts, by phase, 2021 - 2035
7.4.6.3. Market estimates and forecasts, by application, 2021 - 2035
7.4.6.4. Market estimates and forecasts, by end use, 2021 - 2035
7.4.7. Japan
7.4.7.1. Market estimates and forecasts, 2021 - 2035
7.4.7.2. Market estimates and forecasts, by phase, 2021 - 2035
7.4.7.3. Market estimates and forecasts, by application, 2021 - 2035
7.4.7.4. Market estimates and forecasts, by end use, 2021 - 2035
7.4.8. South Korea
7.4.8.1. Market estimates and forecasts, 2021 - 2035
7.4.8.2. Market estimates and forecasts, by phase, 2021 - 2035
7.4.8.3. Market estimates and forecasts, by application, 2021 - 2035
7.4.8.4. Market estimates and forecasts, by end use, 2021 - 2035
7.5. Latin America
7.5.1. Market estimates and forecasts, 2021 - 2035
7.5.2. Market estimates and forecasts, by phase, 2021 - 2035
7.5.3. Market estimates and forecasts, by application, 2021 - 2035
7.5.4. Market estimates and forecasts, by end use, 2021 - 2035
7.5.5. Brazil
7.5.5.1. Market estimates and forecasts, 2021 - 2035
7.5.5.2. Market estimates and forecasts, by phase, 2021 - 2035
7.5.5.3. Market estimates and forecasts, by application, 2021 - 2035
7.5.5.4. Market estimates and forecasts, by end use, 2021 - 2035
7.5.6. Argentina
7.5.6.1. Market estimates and forecasts, 2021 - 2035
7.5.6.2. Market estimates and forecasts, by phase, 2021 - 2035
7.5.6.3. Market estimates and forecasts, by application, 2021 - 2035
7.5.6.4. Market estimates and forecasts, by end use, 2021 - 2035
7.6. Middle East & Africa
7.6.1. Market estimates and forecasts, 2021 - 2035
7.6.2. Market estimates and forecasts, by phase, 2021 - 2035
7.6.3. Market estimates and forecasts, by application, 2021 - 2035
7.6.4. Market estimates and forecasts, by end use, 2021 - 2035
7.6.5. Saudi Arabia
7.6.5.1. Market estimates and forecasts, 2021 - 2035
7.6.5.2. Market estimates and forecasts, by phase, 2021 - 2035
7.6.5.3. Market estimates and forecasts, by application, 2021 - 2035
7.6.5.4. Market estimates and forecasts, by end use, 2021 - 2035
7.6.6. South Africa
7.6.6.1. Market estimates and forecasts, 2021 - 2035
7.6.6.2. Market estimates and forecasts, by phase, 2021 - 2035
7.6.6.3. Market estimates and forecasts, by application, 2021 - 2035
7.6.6.4. Market estimates and forecasts, by end use, 2021 - 2035
Chapter 8. Competitive Landscape
8.1. Recent Developments by Key Market Participants
8.2. Company Categorization
8.3. Company Heat Map Analysis
8.4. Company Market Positioning Analysis, 2024
8.5. Strategy Mapping
8.6. Company Profiles/Listing
8.6.1. Air Products and Chemicals, Inc.
8.6.1.1. Company Overview
8.6.1.2. Financial Performance
8.6.1.3. Technology Benchmarking
8.6.2. Linde Plc
8.6.2.1. Company Overview
8.6.2.2. Financial Performance
8.6.2.3. Technology Benchmarking
8.6.3. Air Liquide
8.6.3.1. Company Overview
8.6.3.2. Financial Performance
8.6.3.3. Technology Benchmarking
8.6.4. Messer Group
8.6.4.1. Company Overview
8.6.4.2. Financial Performance
8.6.4.3. Technology Benchmarking
8.6.5. Taiyo Nippon Sanso India
8.6.5.1. Company Overview
8.6.5.2. Financial Performance
8.6.5.3. Technology Benchmarking
8.6.6. MESA Specialty Gases & Equipment
8.6.6.1. Company Overview
8.6.6.2. Financial Performance
8.6.6.3. Technology Benchmarking
8.6.7. Matheson Tri-Gas Inc.
8.6.7.1. Company Overview
8.6.7.2. Financial Performance
8.6.7.3. Technology Benchmarking
8.6.8. Iwatani Corporation
8.6.8.1. Company Overview
8.6.8.2. Financial Performance
8.6.8.3. Technology Benchmarking
8.6.9. Gazprom PJSC
8.6.9.1. Company Overview
8.6.9.2. Financial Performance
8.6.9.3. Technology Benchmarking
8.6.10. Gulf Cryo S.A.L.
8.6.10.1. Company Overview
8.6.10.2. Financial Performance
8.6.10.3. Technology Benchmarking
8.6.11. IACX Energy
8.6.11.1. Company Overview
8.6.11.2. Financial Performance
8.6.11.3. Technology Benchmarking
A Seven-Phase Framework
Our methodology is designed to be universally applicable across commodity chemicals, specialty chemicals, petrochemicals, construction chemicals, coatings, electronic chemicals, industrial gases, agrochemicals, water treatment chemicals, and performance materials. Each phase builds upon the last, creating a layered validation structure that minimizes estimation error and maximizes analytical confidence.
The framework ensures comprehensive market coverage, robust cross-validation, and reliable long-term forecasting — producing market estimates that withstand scrutiny from investors, regulators, and corporate strategy teams.

Seven-Phase Framework — Analytical Effort Distribution
Relative analytical effort allocated across each phase of the Chemicals & Materials research framework

Phase 1 - Secondary Research: Establishing the Foundation
Secondary research collects and evaluates publicly available information from authoritative sources, establishing the foundational understanding of market structure, value chain dynamics, competitive landscape, and end-use demand patterns. Every source is evaluated for credibility, recency, geographic relevance, and methodological soundness before inclusion.
Industry Associations
Sources include ACC, CEFIC, ICCA, JCIA, CPCIF, and SOCMA providing production volumes, consumption trends, capacity developments, and sustainability initiatives.
Company Disclosures
Annual reports, investor presentations, earnings transcripts, and regulatory filings reveal product portfolios, manufacturing footprints, capacity expansions, and revenue segmentation.
Government Databases
National statistical offices, customs authorities, environmental agencies, and industrial production databases provide verified statistics on output, trade flows, and regulatory compliance.
Trade Databases
UN Comtrade, ITC, Eurostat, and national customs authorities enable assessment of global product movement, import dependency, and export competitiveness across regions.
Our Secondary Research Sources
- Ministry of Chemicals and Fertilizers
- European Chemicals Agency
- United States Department of Energy
- Ministry of Industry and Information Technology
- Ministry of Economy Trade and Industry
- Ministry of Trade Industry and Energy
- National Institute of Standards and Technology
- Council of Scientific and Industrial Research
- Fraunhofer Society
- National Institute for Materials Science
Phase 2 — Supply-Side Assessment: Mapping Production Capabilities
Production Capacity Analysis
All major manufacturers are assessed for existing installed capacity, planned additions, expansions, new plant announcements, and technology adoption — mapped at global, regional, and country levels.
Capacity Utilization Adjustment
Installed capacity is adjusted using utilization rates based on demand conditions, feedstock availability, plant operating rates, maintenance schedules, and regulatory restrictions.
Manufacturer Revenue Analysis
Product-specific revenues, segment-level performance, regional distribution, average selling prices, and margin trends are evaluated to establish market value estimates.
Supply-Side Assessment — Capacity vs. Effective Production by Region
Illustrative comparison of installed capacity vs. effective production volume (after utilization rate adjustment) across major regions

Phase 3 — Demand-Side Assessment: Quantifying Chemical Consumption
Demand-side analysis quantifies chemical consumption across industries, applications, and geographies — identifying where and how chemicals are consumed throughout the value chain with precision.
End-Use Industry Analysis
Chemical demand is evaluated across automotive, construction, packaging, electronics, agriculture, healthcare, consumer goods, industrial manufacturing, energy and utilities, and water treatment. Industry output, production trends, and consumption intensity are analyzed to determine demand patterns.
Consumption Modeling
Demand is estimated using measurable indicators: kilograms per vehicle, kilograms per square meter of construction, dosage per cubic meter of water treated, kilograms per hectare of agricultural land, and kilograms per ton of manufactured products. Consumption factors are validated through industry publications and primary interviews.
Application Analysis
The market is segmented by application area to understand product performance requirements, formulation trends, technology adoption, customer preferences, and regulatory requirements improving demand accuracy and segmentation granularity.
Demand-Side Assessment — End-Use Industry Demand Distribution
Illustrative distribution of chemical & materials demand across key end-use industries

Phase 4 - Trade Flow Analysis: Balancing Regional Supply and Demand
Trade flow analysis reconciles regional supply and demand estimates through import and export data, identifying net supply positions, regional dependencies, and market imbalances. It serves as an independent validation layer that tests the consistency of supply-side and demand-side estimates.
Import Analysis
Import data is evaluated to determine volumes, source countries, product dependency, regional supply gaps, and pricing trends — identifying markets that rely heavily on external supply and where domestic production is insufficient to meet demand.
Export Analysis
Export assessments reveal production surplus, export competitiveness, regional manufacturing strength, and global market participation. Export patterns also help validate domestic production estimates and identify net exporting regions.
Apparent Consumption Model
Regional consumption is assessed using the standard apparent consumption formula:
Results identify net importing regions, net exporting regions, regional deficits, and surpluses — serving as an independent validation of supply and demand estimates.
Trade Flow Analysis — Net Supply Position by Region
Illustrative apparent consumption vs. domestic production across major regions — positive gap indicates net import dependency

Phase 5 — Primary Research: The Critical Validation Layer
Primary research tests and refines findings from secondary research through direct engagement with industry participants across the supply chain, demand side, and expert community. It captures intelligence that no database or published report can provide — the real-world experience of manufacturers, buyers, and specialists operating in the market.

Supply-Side Interviews
Conversations with chemical manufacturers, raw material suppliers, contract manufacturers, technology providers, and plant operators cover production trends, capacity utilization, pricing developments, technology shifts, and competitive dynamics.

Demand-Side Interviews
Engagement with OEMs, industrial consumers, procurement managers, distributors, formulators, and end-use manufacturers focuses on consumption trends, purchasing behavior, product substitution, demand outlook, and emerging applications.

Industry Expert Consultations
Additional interviews with industry consultants, independent experts, regulatory specialists, technical professionals, and research institutions provide deeper market context and validate key analytical assumptions.
Focus Areas of Primary Research:
Market Size & Forecast Validation
Revenue estimates, volume consumption, growth rates, forecast assumptions, regional demand.Supply Chain & Value Chain Assessment
Raw material sourcing, supply chain challenges, distribution networks, procurement practices.Production & Capacity Analysis
Manufacturing capacity, utilization rates, expansion projects, plant investments.Pricing & Cost Structure Analysis
Product pricing trends, feedstock costs, energy costs, margin pressures, pricing outlook.Competitive Landscape Assessment
Volume and value estimates confirmed to be fully consistent with one another before publicationInterview Volume by Market Scope
| Study Scope | Number of Interviews |
|---|---|
| Niche Market | 20 – 30 |
| Mid-Sized Market | 30 – 50 |
| Global Market | 50 – 80 |
| Highly Fragmented Market | 80 – 120 |
Interview Details:
Category : Manufacturers, Suppliers, Distributors, End Users, Experts/Associations
Average Duration : 30–60 Minutes
Interview Mode : Video calls, telephonic interviews, expert consultations
Interview Format : Structured / Semi-Structured questionnaire
Focus Areas of Primary Research:
Market Size & Forecast Validation :
Revenue estimates, volume consumption, growth rates, forecast assumptions, regional demand.
Supply Chain & Value Chain Assessment :
Raw material sourcing, supply chain challenges, distribution networks, procurement practices.
Production & Capacity Analysis :
Manufacturing capacity, utilization rates, expansion projects, plant investments.
Pricing & Cost Structure Analysis :
Product pricing trends, feedstock costs, energy costs, margin pressures, pricing outlook.
Competitive Landscape Assessment :
Market share, competitor positioning, strategic initiatives, partnerships, acquisitions.
Primary Research — Stakeholder Coverage by Category
Distribution of interview respondents across stakeholder categories (% share from PPT data)

Primary Research — Respondent Designation Profile
Seniority breakdown of interview respondents (% share from PPT data)

Primary Research — Geographic Coverage of Interviews
Regional distribution of primary research engagement (% share from PPT data)

Phase 6 — Data Triangulation and Market Validation
No single methodology is relied upon in isolation. Multiple independent estimation approaches are combined and reconciled to ensure consistency, accuracy, and analytical defensibility. Any material deviations between approaches are investigated and adjusted through additional validation cycles.
The final market size is derived through weighted triangulation of all validated methodologies. Any material deviations between approaches are investigated and adjusted through additional validation cycles. The outcome represents the most realistic assessment of the market based on available evidence and expert confirmation ensuring that volume and value estimates are fully consistent with one another.
Triangulation Framework — Input Contribution Weight
Relative weight each sizing input contributes to the final reconciled market estimate

Phase 7 — Forecast Modeling: Projecting Future Market Evolution
Forecasting evaluates the future trajectory of the market using a combination of quantitative indicators and qualitative assessments across economic, industry, and regulatory dimensions. Rather than simple extrapolation, each driver is independently modeled and integrated into a composite forecast.
Macroeconomic Indicators
GDP growth, industrial production, manufacturing output, construction activity, consumer spending, and capital investment form the quantitative foundation of long-term demand projections. These are applied at country, regional, and global levels.
Industry Growth Drivers
Urbanization, infrastructure development, industrialization, technological innovation, sustainability initiatives, and evolving product performance requirements are assessed at regional and industry levels — capturing both structural and cyclical demand drivers.
Capacity Expansion Analysis
Announced plant expansions, new manufacturing facilities, technology upgrades, and strategic investments are evaluated to determine future supply-demand dynamics and potential market tightness or oversupply situations.
Regulatory & Sustainability
Environmental regulations, chemical safety standards, emission reduction targets, circular economy initiatives, and sustainability requirements are incorporated as they often influence product adoption rates and market growth trajectories.
Scenario Forecast Range — Indexed Market Growth (Year 1–10)
Illustrative indexed growth trajectories across Base, Optimistic, and Pessimistic scenarios over a 10-year forecast horizon

Forecast Drivers — Relative Impact Score by Category
Impact score (0–100) of each driver type on chemicals & materials market forecast




Comments
Share your thoughts, ask a question, or provide feedback about this report.