
Fire Protection Materials Market Overview and Insight
The global fire protection materials market size was valued at USD 5.20 billion in 2025, is estimated to reach USD 5.69 billion in 2026, and is projected to reach USD 12.71 billion by 2035, exhibiting a compound annual growth rate (CAGR) of 9.35% over the forecast period from 2026 to 2035. Smaller building sizes and stricter building safety requirements, the development of infrastructure, urbanization, and the ever-growing use of passive fire protection systems all contribute to current expansion in the market. Commercial construction is the largest end-use segment, while residential construction is the fastest-growing end-use segment.
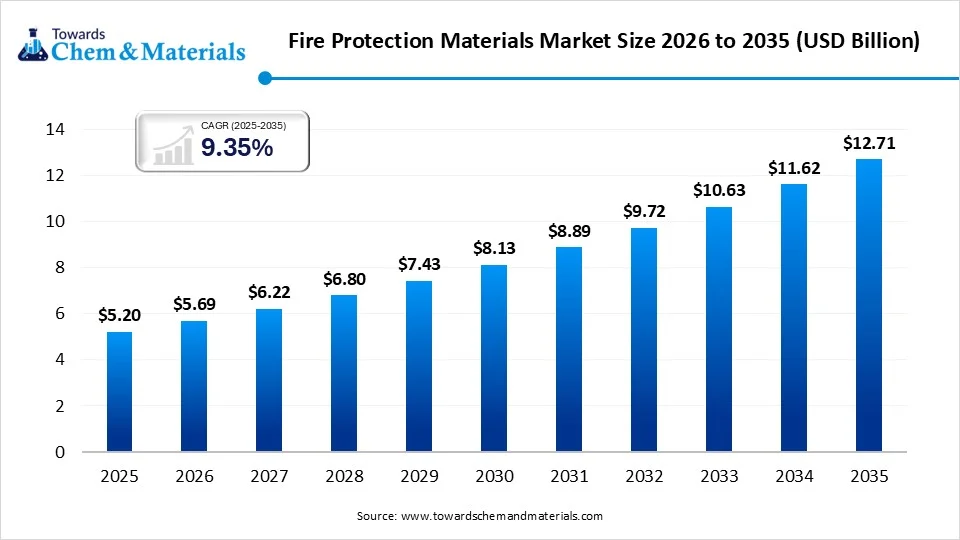
The global fire protection materials market is undergoing a change, and the increasing pace of infrastructure development, urbanization, and regulations for building safety are driving the market. Various materials such as intumescent coatings, mortars, boards, sprays, and special barriers offer protection against heat, flames, smoke, and structural degradation. North America has shown high demand and high regulatory compliance, and Asia Pacific is the biggest regional market with renovation activities.
Key Takeaways
- Asia Pacific dominated the fire protection materials market by holding a 32% share in 2025 and is expected to grow at a CAGR of 8.8% during the forecast period.
- North America held a 29% market share in 2025 and is expected to grow at the fastest CAGR of 10.2% during the forecast period.
- By product, the sealants segment dominated the market with the largest share of 27.5% in 2025 and is expected to grow at a CAGR of 9.3% during the forecast period.
- By product, the spray segment held 17.8% market share in 2025 and is expected to grow at the fastest CAGR of 9.8% during the forecast period.
- By end-use, the commercial construction segment dominated the market with the largest share of 42% in 2025 and is expected to grow at a CAGR of 9.3% during the forecast period.
- By end-use, the residential construction segment held a 24.5% market share in 2025 and is expected to grow at the fastest CAGR of 10.2% during the forecast period.
Global Investment Movement for the Fire Protection Materials Market
- More investment is going towards low-VOC, halogen-free, recyclable, mineral-derived, and bio-derived materials to meet sustainable building requirements.
- Thin film, thick film, hydrocarbon-resistant, and powder technology for specialized industrial applications are being supported by capital deployment.
- The investment is aimed at IoT-based firestopping, BIM-based material selection, digital twin, and intelligent monitoring for firestopping management.
- Specialized investments are being targeted in data centers and EV battery plants to develop thermal barriers and advanced materials that combat new fire hazards.
- For instance, in August 2025, DuPont was among the three companies to receive 2025 R&D 100 Awards for innovative technology in the Mechanical/Materials category for performance and customer value.
Fire Protection Materials Market Trends
- Building codes and standards are updated to increasingly require fire-rated buildings, whether commercial, residential, or industrial, to be designed and built with fire-rated infrastructure.
- Demand for fire protection materials in Asia Pacific is driven by the high rate of infrastructure development in the region, which also includes residential, commercial, and transportation projects.
- The rising manufacturing of EVs and battery infrastructure is increasing the demand for specialized thermal barrier solutions that are engineered to combat thermal runaway risks.
- Intumescent coatings with lightweight and low film thicknesses are becoming a more and more popular method to provide structural protection while ensuring the architectural requirements and minimizing application burdens.
Key Technological Shifts and AI in the Fire Protection Materials Market
AI is transforming the fire protection materials development process, from predictive, simulation-based strategies to data-driven approaches, in both material research and formulation. Chemical structures can be assessed, and the properties of flammability, thermal stability, toxicity, limiting oxygen index, and char-forming performance can be predicted using machine learning. Optimization using AI can evaluate formulation combinations including blowing agents, catalysts, and binders. Digital twins can be used to simulate the behavior of a structure during a fire and the degradation of materials prior to the actual testing.
Supply Chain Analysis of the Fire Protection Materials Market
Feedstock Procurement
- Feedstock procurement is the sourcing of chemical inputs, minerals, and elemental materials such as phosphorus, nitrogen, graphite, and silicon into fire-resistant products.
- Stable feedstock supply ensures continual formulation of materials, chemical processing, and production of fire protection products.
- BASF SE provides chemical precursors, base polymers, and specialty additives to enable production of flame-retardant materials downstream. Other Key Players: Dow Chemical Company, Clariant AG, and Albemarle Corporation.
Chemical Synthesis and Processing.
- Chemical synthesis involves using reaction chemistry and a molecular engineering approach to develop compounds that have flame-retardant or intumescent properties using petrochemicals and minerals.
- This stage develops the chemical properties necessary for thermal resistance, flame suppression, insulation, and protection of structures.
- Sika AG produces its own elastic polymers and fire-resistant chemical agents for use in protective structural matrices.
- Other Key Players: LANXESS AG, AkzoNobel N.V., and Hempel A/S.
Formulation and Blending
- Compound formulation refers to the process of mixing together all the fire-retardant chemicals, binders, pigments, carriers, and additives that create a fire protection product.
- Application properties, coatings, sealants, foams, pillows, putties, and related protection systems are created by blending.
- 3M develops passive fire barriers, moldable putties, and extremely intumescent firestop pillows that expand when subjected to high heat.
- Other Key Players: The Sherwin-Williams Company, Hilti Group, and PPG Industries Inc.
Sustainability Analysis:
To be sustainable, materials should be used in a way that balances life safety performance with considerations for the environment, economy, and society across their life cycles. Manufacturing can have significant environmental effects for two reasons: First, the production of synthetic polymers consumes significant amounts of resources, and second, the chemical processing and metal production are also demanding. Bio alternatives, made from cork shavings or aquaculture shellfish wastes, can help decrease reliance on virgin materials and offer thermal insulation.
What are fire Protection Materials?
Fire protection materials are specialized materials that are used to protect buildings and industrial facilities from heat, flames, smoke, and the propagation of fire. These include sealants, mortar, spray, boards, coatings, putty, barriers, pillows, wraps, and various other firestop systems.
Uses of Fire Protection Materials
- Intumescent coatings are applied to structural steel to withstand fire exposure by increasing in size when hot and creating insulating char layers, which slow the temperature-driven degradation of the structural steel when exposed to fire.
- Sealants, mortars, putties, and firestop products seal penetrations and joints to help fire-rated assemblies maintain fire-rated boundaries around pipes, cables, walls, floors, and assemblies.
- Oil, gas, chemical, power, mining, manufacturing, and other facilities benefit from protection enabled by specialized coating, barriers, and heavy-duty materials.
Pricing Analysis for the Fire Protection Materials Market
Long-term value, cost reduction, performance requirements, installation conditions, maintenance requirements, and life cycle costs all play a role in pricing and cost effectiveness. Present Net Value considers both capital costs and loss reduction expected in order to evaluate alternatives. According to the ALARP principle, reducing risks at the lowest reasonable practicable cost is considered. Systems may be either active or passive; active systems require installation and have periodic maintenance needs, whereas passive systems include protection as part of the structural elements.
Fire Protection Materials Market: Global Trade Analysis
The worldwide trade of fire protection materials is growing with construction, regulation, infrastructure construction, and industrial modernization. Coatings, boards, panels, sealants, putties, mortars, and cementitious sprays are used internationally. Major application fields include commercial buildings, industrial facilities, energy infrastructure, tunnels, airports, and transportation projects. Smart intumescent coatings, wireless detection systems, and hybrid protection solutions are also impacting product development and demand in cross-over regional markets.
Regulatory Framework: Fire Protection Materials Market
| Country Region | Regulatory Body | Key Regulations | Focus Areas |
| Asia Pacific | MoHURD / Ministry of Emergency Management | GB 50016 (Code for fire protection design of buildings) | Architectural fire design, spatial compartmentalization |
| North America | NFPA | NFPA 101 Life Safety Code, NFPA 72 | Egress, occupancy limits, fire alarms, sprinkler integration |
| European Union | European Commission / CEN | Construction Products Regulation (CPR) | CE marking, material reaction-to-fire classifications (A1 to F) |
Segmental Insights
Product Insights
Sealants Dominated the Fire Protection Materials Market with 27.5% of Market Share in 2025
The sealants segment dominated the market with the largest share of 27.5% in 2025 and is expected to grow at a CAGR of 9.3% during the forecast period, driven by the sealants segment, as it has a wide range of applications in various structural assemblies and cable openings in buildings, pipe penetrations, and between building joints. Firestop sealants are effective fire barriers that also help to prevent the spread of flames, smoke, and heat from one protected space to another. Commercial construction, infrastructure building and development, industrial facilities, renovation activities, and increasingly strict fire safety regulations are also driving the demand.
- For instance, in November 2025, OneClickDIY published its detailed fire-safety and building-code guide on DIY spray foam insulation, reinforcing best practices for installing do-it-yourself spray foam insulation projects.
The spray segment held a 17.8% market share in 2025 and is expected to grow at the fastest CAGR of 9.8% during the forecast period, due to its quick application times, flexibility of use, and suitability for structural and industrial surfaces. Cementitious sprays, intumescent sprays, spray-applied fire-resistive materials, foam-based protection sprays, and vermiculite-based solutions are used to provide various types of thermal and structural protection. The growing construction industry, infrastructure modernization, industrialization, and demand for fireproofing solutions in a fast and effective manner are driving wider acceptance across commercial, industrial, and infrastructure applications.
End-Use Insights
The Commercial Construction Segment Dominated the Fire Protection Materials Market with 42% of Market Share in 2025
The commercial construction segment dominated the market with the largest share of 42% in 2025 and is expected to grow at a CAGR of 9.3% during the forecast period, because all commercial facilities therefore need extensive compartmentation, structural protection, penetration sealing, and fire-rated assemblies. Specialized fire protection solutions are needed in offices, retail, hotels, health-care, educational buildings, data centres, warehouses, logistics centres, airports, and transportation buildings. Other passive protection products such as coatings, sealants, boards, mortars, sprays, putties, barriers, etc. are increasingly integrated because of increasing safety requirements and modernization works.
The residential construction segment held a 24.5% market share in 2025 and is expected to grow at the fastest CAGR of 10.2% during the forecast period, driven by rising need for fire resistance in single-family homes, multi-family buildings, high-rise residences, affordable housing, and renovation. The demand for firestop sealants, boards, sprays, mortars, putties, and other protection materials is growing as buildings and structures being built for residential applications are incorporating more fire compartmentation and structural safety features.
Regional Insights
How Did the Asia Pacific Dominate the Fire Protection Materials Market In 2025?
Asia Pacific dominated the market with the largest share of 32% in 2025 and is expected to grow at a CAGR of 8.8% during the forecast period. The fire protection materials market in Asia Pacific is driven by the extensive development of infrastructure, urbanization, and growing focus on building safety, which in turn is boosting the industry's growth. Demand includes residential construction, commercial buildings, manufacturing facilities, transportation infrastructure, energy, and new technology facilities. The region also offers potential for specialized thermal barriers, fire-resistant coatings, sealants, boards, sprays, and other products to meet ever-changing construction and industrial needs.
- For instance, in March 2026, JinkoSolar launched its Five-Star fire-resistant module globally at PV Expo Japan in Tokyo, meeting stringent fire-safety requirements and the highest fire-resistance standard.
The fire protection material market is one of the major markets in Asia Pacific, as the market is driven by construction activities, industrial growth, infrastructure projects, and increasing demand for building safety. The applications include commercial buildings, residential developments, industrial facilities, energy, transportation, and special facilities. A range of fire-resistant coatings, sealants, boards, sprays, mortars, and barriers are used to aid compartmentation and structural protection in various types of construction.
India is a key market in Asia Pacific, fueled by construction, infrastructure modernisation, industrial growth, and research and development of advanced materials. Fire protection systems are used in a variety of commercial and residential structures, manufacturing, energy installations, transportation, and other industrial facilities.
- For instance, in July 2026, researchers from IIT Bhilai and IIT Patna created a multifunctional polymer coating that provides corrosion protection while also improving fire safety for advanced industrial applications.
North America Market Trends Analysis
North America held a 29% market share in 2025 and is expected to grow at the fastest CAGR of 10.2% during the forecast period as projects for reconstruction and renovation, industrial usage, modernization of infrastructure, and regulations for safety and security drive the market. Specialized passive protection materials are demanded for commercial buildings, industrial facilities, transportation infrastructure, data centres, and energy facilities.
- For instance, in July 2026, Saint-Gobain North America hosted the latest addition to its Innovation Hub North America, a state-of-the-art fire testing lab that enhances its capabilities in the region for fire testing and material development.
Fire protection materials are key products in the U.S. market for North American commercial construction, industrial facilities, infrastructure, energy projects, and specialized applications. Demand includes passive protection systems, such as fire-resistant coatings, sealants, boards, barriers, and sprays. The rising focus on the safety of lithium batteries is driving a greater market for specialized fire protection products for EVs, consumer electronics, energy systems, and facilities.
Canada is a well-established North American market with building-safety requirements, industrial facilities, infrastructure development, and construction regulations. FPM products are used in residential structures, commercial facilities, industrial applications, transportation, and renovations. In various construction environments, sealants, coatings, boards, mortars, sprays, and barriers provide fire compartmentation and structural protection.
Europe Market Trends Analysis
Europe held a 25% market share in 2025 and is expected to grow at a CAGR of 8.4% over the forecast period. Building codes, modernization of infrastructure, industrialization, and demand for technically appropriate protection systems represent important fire protection materials markets in Europe. Coatings, sealants, boards, mortars, sprays, barriers, and specialized passive fire protection solutions are all part of the regional market. Waterborne, low-emission, sustainable, advanced fire-resistant materials for construction and industrial applications are also being promoted because of environmental concerns.
Germany is a large European market with a broad base of industrial manufacturing and construction, specialty chemicals, infrastructure, and advanced materials development. Fire protection materials are used in commercial buildings, industrial facilities, energy infrastructure, transportation projects, and special applications.
- For instance, in July 2026, LANXESS announced that it would begin to produce Reolube fire-resistant hydraulic fluids locally at its Jhagadia plant, further establishing its position for customers in India, the Middle East, and worldwide markets
France is a key player in the European fire protection materials market, used in the construction industry, infrastructure, commercial buildings, industrial facilities, and in transport. Fire-resistant coatings, sealants, boards, sprays, mortars, and barriers provide assistance in the achievement of compartmentation and structural protection. In addition, European fire-performance needs spur product manufacturers to create items that can satisfy more stringent safety and environmental standards.
Latin America Market Trends Analysis
Latin America held an 8% market share in 2025 and is expected to grow ata CAGR of 9% over the forecast period. Latin America is an emerging market (evolving market), supported by major construction activity, infrastructure development, industrial plants, commercial buildings, and increased focus on fire safety. Coatings, sealants, boards, sprays, mortars, putties, barriers, and other fire-resistant materials are all in demand. Applications include commercial, residential, industrial, transportation, energy, and renovation projects with the need for better fire protection.
Brazil is an important market in the Latin American region, which has a varied application area, including the housing industry, commercial buildings, industrial facilities, infrastructure, and energy. Opportunities include many coatings, sealants, boards, sprays, mortars, putties, barriers, and other specialty products used in a wide range of construction and industrial applications.
Chile is playing its part in the Latin American fire protection materials market with use in construction, infrastructure, industrial facilities, transportation buildings, and specialized projects. Structural protection and compartmentation are provided by fire-resistant coatings, boards, sealants, mortars, sprays, putties, and barriers. Demand is related to projects that demand improved resistance to heat, flames, smoke & fire propagation.
Middle East & Africa Market Trends Analysis
The Middle East & Africa held a 6% market share in 2025 and is expected to grow at a CAGR of 9.2% over the forecast period, driven by construction, infrastructure development, industrial facilities, energy projects and building-safety needs. Demand includes structural coatings, firestop systems, sealants, boards, sprays, mortars, barriers, and other passive protection solutions. Special properties are required in these high-risk industrial and energy applications to ensure acceptable fire protection performance in an environment where performance requirements are high.
Saudi Arabia is an important market in the Middle East region where there are a lot of construction, infrastructure development, commercial facilities, industrial projects, and energy applications. The Saudi Building Code framework has included fire protection requirements, which stimulate the demand for fire-resistant materials. It can be used in structural coatings, firestop sealants, boards, barriers, sprays, mortars, and other building and infrastructure protection systems.
South Africa is an important market in Africa, and applications are found in residential, commercial, industrial, infrastructure, mining, and energy facilities. Fire protection materials are used for structural protection, compartmentation, penetration sealing, and thermal resistance. The demand for coatings, sealants, boards, mortars, sprays, putties, barriers, and special fire-resistant systems is used in a wide variety of building applications.
Market Competitive Analysis
The fire protection materials companies comprise diversified chemical, coatings, construction-material, specialty-material, and fire-protection companies. Competition is based on the performance of the product, formulation development, application efficiency, sustainability, testing capabilities, and special protection needs. BASF SE, Sika AG, 3M, Hempel A/S, LANXESS AG, AkzoNobel N.V., The Sherwin-Williams Company, Hilti Group and PPG Industries Inc. play various roles in the value chain. Product launches are increasingly emanating around issues of lithium-ion battery fires, passive structural protection, waterborne coatings, flame-retardant papers, and specific infrastructure needs.
- For instance, in August 2026, Britannia Fire unveiled a 6-litre AVD extinguisher and AVD fire blanket to help combat lithium-ion battery fire incidents in August 2026.
- For instance, in July 2026, Hempel launched Hempafire Optima 515, a waterborne cellulosic PFP to provide protection of interior steel structures and to minimize paint usage.
- For instance, in October 2025, Ahlstrom launched Flame-Gard technology in the production of flame-resistant paper for use in spray painting booths and industrial workshop fire safety applications.
Recent Developments
- In May 2026, Full Circle Lithium announced the introduction of its FCL-X lithium-ion battery fire extinguisher in partnership with a large home-improvement retailer in the United States, but without being exclusive to that retailer.
- In February 2026, FSi Promat is introducing a new slab-edge firestop system in February 2026, called Paraflam Ultra, for curtain-wall facades and other building-envelope fire protection applications.
Top Players in the Market & Their Offerings
| Company | Company Type/Position | Major Headquarters | Geographic Presence | Fire Protection Materials Offerings | Key Strength |
| 3M Company | Global Leader in Firestopping | Saint Paul, Minnesota, USA | Global | 3M Fire Barrier Sealant CP 25WB+ | Advanced intumescent technology (Hyper-GS) |
| AkzoNobel N.V. | Market Leader in Heavy Protective Coatings | Amsterdam, Netherlands | Over 80 countries spanning Europe, the Americas, and APAC | Chartek and Interchar premium intumescent fireproofing coatings | World-renowned hydrocarbon fire protection |
| BASF SE | Chemical Material Innovator | Ludwigshafen, Germany | Mass global footprint across all industrial zones | Intumescent paints, specialty flame retardant compounds | High emphasis on sustainability and eco-friendly chemistry that shields concrete |
Fire Protection Materials Market Key Players
- 3M Company
- AkzoNobel N.V.
- BASF SE
- Etex Group
- Hempel A/S
- Hilti Corporation
- Isolatek International
- Jotun Group
- Morgan Advanced Materials plc
- Owens Corning
- PPG Industries Inc.
- RPM International Inc. (Tremco)
- Saint-Gobain S.A.
- Sika AG
- Specified Technologies Inc.
Fire Protection Materials Market Segment Covered in the Report
By Product
- Sealants
- Acrylic Firestop Sealants
- Silicone Firestop Sealants
- Intumescent Sealants
- Polyurethane Firestop Sealants
- Hybrid Firestop Sealants
- Fire-Rated Joint Sealants
- Penetration Sealants
- Mortar
- Cementitious Firestop Mortar
- Gypsum-Based Firestop Mortar
- Lightweight Firestop Mortar
- High-Temperature Firestop Mortar
- Structural Fireproofing Mortar
- Spray
- Cementitious Spray
- Intumescent Spray
- Spray-Applied Fire-Resistive Material
- Foam-Based Fire Protection Spray
- Vermiculite-Based Spray
- Sheets/Boards
- Calcium Silicate Boards
- Gypsum Fire-Resistant Boards
- Mineral Wool Boards
- Vermiculite Boards
- Magnesium Oxide Boards
- Intumescent Boards
- Putty
- Firestop Putty
- Intumescent Putty
- Putty Pads
- Fire-Rated Electrical Putty
- Removable Firestop Putty
- Others
- Firestop Collars
- Firestop Wraps and Strips
- Cast-In Devices
- Firestop Plugs
- Fire-Resistant Pillows
- Fire Barriers and Blankets
By End Use
- Residential Construction
- Single-Family Housing
- Multi-Family Housing
- High-Rise Residential
- Affordable Housing
- Residential Renovation & Retrofit
- Commercial Construction
- Offices
- Retail & Shopping Centers
- Hotels & Hospitality
- Hospitals & Healthcare Facilities
- Educational Institutions
- Data Centers
- Warehouses & Logistics Centers
- Airports & Transportation Buildings
- Industrial Construction
- Manufacturing Facilities
- Chemical & Petrochemical Plants
- Oil & Gas Facilities
- Power Generation Facilities
- Mining & Metals Facilities
- Food & Beverage Plants
- Pharmaceutical Facilities
- Automotive Manufacturing
- Energy Storage & Battery Facilities
By Regions
- North America:
- U.S.
- Canada
- Mexico
- Rest of North America
- Latin America:
- Brazil
- Argentina
- Rest of Latin America
- Europe:
- Western Europe
- Germany
- Italy
- France
- Netherlands
- Spain
- Portugal
- Belgium
- Ireland
- UK
- Iceland
- Switzerland
- Poland
- Rest of Western Europe
- Eastern Europe
- Austria
- Russia & Belarus
- Türkiye
- Albania
- Rest of Eastern Europe
- Asia Pacific:
- India
- China
- Japan
- South Korea
- Taiwan
- Indonesia
- Vietnam
- Thailand
- Philippines
- Malaysia
- Singapore
- Australia
- MEA:
-
- GCC Countries
- Saudi Arabia
- United Arab Emirates (UAE)
- Qatar
- Kuwait
- Oman
- Bahrain
- South Africa
- Egypt
- Rest of MEA
- GCC Countries
A Seven-Phase Framework
Our methodology is designed to be universally applicable across commodity chemicals, specialty chemicals, petrochemicals, construction chemicals, coatings, electronic chemicals, industrial gases, agrochemicals, water treatment chemicals, and performance materials. Each phase builds upon the last, creating a layered validation structure that minimizes estimation error and maximizes analytical confidence.
The framework ensures comprehensive market coverage, robust cross-validation, and reliable long-term forecasting — producing market estimates that withstand scrutiny from investors, regulators, and corporate strategy teams.

Seven-Phase Framework — Analytical Effort Distribution
Relative analytical effort allocated across each phase of the Chemicals & Materials research framework

Phase 1 - Secondary Research: Establishing the Foundation
Secondary research collects and evaluates publicly available information from authoritative sources, establishing the foundational understanding of market structure, value chain dynamics, competitive landscape, and end-use demand patterns. Every source is evaluated for credibility, recency, geographic relevance, and methodological soundness before inclusion.
Industry Associations
Sources include ACC, CEFIC, ICCA, JCIA, CPCIF, and SOCMA providing production volumes, consumption trends, capacity developments, and sustainability initiatives.
Company Disclosures
Annual reports, investor presentations, earnings transcripts, and regulatory filings reveal product portfolios, manufacturing footprints, capacity expansions, and revenue segmentation.
Government Databases
National statistical offices, customs authorities, environmental agencies, and industrial production databases provide verified statistics on output, trade flows, and regulatory compliance.
Trade Databases
UN Comtrade, ITC, Eurostat, and national customs authorities enable assessment of global product movement, import dependency, and export competitiveness across regions.
Our Secondary Research Sources
- Ministry of Chemicals and Fertilizers
- European Chemicals Agency
- United States Department of Energy
- Ministry of Industry and Information Technology
- Ministry of Economy Trade and Industry
- Ministry of Trade Industry and Energy
- National Institute of Standards and Technology
- Council of Scientific and Industrial Research
- Fraunhofer Society
- National Institute for Materials Science
Phase 2 — Supply-Side Assessment: Mapping Production Capabilities
Production Capacity Analysis
All major manufacturers are assessed for existing installed capacity, planned additions, expansions, new plant announcements, and technology adoption — mapped at global, regional, and country levels.
Capacity Utilization Adjustment
Installed capacity is adjusted using utilization rates based on demand conditions, feedstock availability, plant operating rates, maintenance schedules, and regulatory restrictions.
Manufacturer Revenue Analysis
Product-specific revenues, segment-level performance, regional distribution, average selling prices, and margin trends are evaluated to establish market value estimates.
Supply-Side Assessment — Capacity vs. Effective Production by Region
Illustrative comparison of installed capacity vs. effective production volume (after utilization rate adjustment) across major regions

Phase 3 — Demand-Side Assessment: Quantifying Chemical Consumption
Demand-side analysis quantifies chemical consumption across industries, applications, and geographies — identifying where and how chemicals are consumed throughout the value chain with precision.
End-Use Industry Analysis
Chemical demand is evaluated across automotive, construction, packaging, electronics, agriculture, healthcare, consumer goods, industrial manufacturing, energy and utilities, and water treatment. Industry output, production trends, and consumption intensity are analyzed to determine demand patterns.
Consumption Modeling
Demand is estimated using measurable indicators: kilograms per vehicle, kilograms per square meter of construction, dosage per cubic meter of water treated, kilograms per hectare of agricultural land, and kilograms per ton of manufactured products. Consumption factors are validated through industry publications and primary interviews.
Application Analysis
The market is segmented by application area to understand product performance requirements, formulation trends, technology adoption, customer preferences, and regulatory requirements improving demand accuracy and segmentation granularity.
Demand-Side Assessment — End-Use Industry Demand Distribution
Illustrative distribution of chemical & materials demand across key end-use industries

Phase 4 - Trade Flow Analysis: Balancing Regional Supply and Demand
Trade flow analysis reconciles regional supply and demand estimates through import and export data, identifying net supply positions, regional dependencies, and market imbalances. It serves as an independent validation layer that tests the consistency of supply-side and demand-side estimates.
Import Analysis
Import data is evaluated to determine volumes, source countries, product dependency, regional supply gaps, and pricing trends — identifying markets that rely heavily on external supply and where domestic production is insufficient to meet demand.
Export Analysis
Export assessments reveal production surplus, export competitiveness, regional manufacturing strength, and global market participation. Export patterns also help validate domestic production estimates and identify net exporting regions.
Apparent Consumption Model
Regional consumption is assessed using the standard apparent consumption formula:
Results identify net importing regions, net exporting regions, regional deficits, and surpluses — serving as an independent validation of supply and demand estimates.
Trade Flow Analysis — Net Supply Position by Region
Illustrative apparent consumption vs. domestic production across major regions — positive gap indicates net import dependency

Phase 5 — Primary Research: The Critical Validation Layer
Primary research tests and refines findings from secondary research through direct engagement with industry participants across the supply chain, demand side, and expert community. It captures intelligence that no database or published report can provide — the real-world experience of manufacturers, buyers, and specialists operating in the market.

Supply-Side Interviews
Conversations with chemical manufacturers, raw material suppliers, contract manufacturers, technology providers, and plant operators cover production trends, capacity utilization, pricing developments, technology shifts, and competitive dynamics.

Demand-Side Interviews
Engagement with OEMs, industrial consumers, procurement managers, distributors, formulators, and end-use manufacturers focuses on consumption trends, purchasing behavior, product substitution, demand outlook, and emerging applications.

Industry Expert Consultations
Additional interviews with industry consultants, independent experts, regulatory specialists, technical professionals, and research institutions provide deeper market context and validate key analytical assumptions.
Focus Areas of Primary Research:
Market Size & Forecast Validation
Revenue estimates, volume consumption, growth rates, forecast assumptions, regional demand.Supply Chain & Value Chain Assessment
Raw material sourcing, supply chain challenges, distribution networks, procurement practices.Production & Capacity Analysis
Manufacturing capacity, utilization rates, expansion projects, plant investments.Pricing & Cost Structure Analysis
Product pricing trends, feedstock costs, energy costs, margin pressures, pricing outlook.Competitive Landscape Assessment
Volume and value estimates confirmed to be fully consistent with one another before publicationInterview Volume by Market Scope
| Study Scope | Number of Interviews |
|---|---|
| Niche Market | 20 – 30 |
| Mid-Sized Market | 30 – 50 |
| Global Market | 50 – 80 |
| Highly Fragmented Market | 80 – 120 |
Interview Details:
Category : Manufacturers, Suppliers, Distributors, End Users, Experts/Associations
Average Duration : 30–60 Minutes
Interview Mode : Video calls, telephonic interviews, expert consultations
Interview Format : Structured / Semi-Structured questionnaire
Focus Areas of Primary Research:
Market Size & Forecast Validation :
Revenue estimates, volume consumption, growth rates, forecast assumptions, regional demand.
Supply Chain & Value Chain Assessment :
Raw material sourcing, supply chain challenges, distribution networks, procurement practices.
Production & Capacity Analysis :
Manufacturing capacity, utilization rates, expansion projects, plant investments.
Pricing & Cost Structure Analysis :
Product pricing trends, feedstock costs, energy costs, margin pressures, pricing outlook.
Competitive Landscape Assessment :
Market share, competitor positioning, strategic initiatives, partnerships, acquisitions.
Primary Research — Stakeholder Coverage by Category
Distribution of interview respondents across stakeholder categories (% share from PPT data)

Primary Research — Respondent Designation Profile
Seniority breakdown of interview respondents (% share from PPT data)

Primary Research — Geographic Coverage of Interviews
Regional distribution of primary research engagement (% share from PPT data)

Phase 6 — Data Triangulation and Market Validation
No single methodology is relied upon in isolation. Multiple independent estimation approaches are combined and reconciled to ensure consistency, accuracy, and analytical defensibility. Any material deviations between approaches are investigated and adjusted through additional validation cycles.
The final market size is derived through weighted triangulation of all validated methodologies. Any material deviations between approaches are investigated and adjusted through additional validation cycles. The outcome represents the most realistic assessment of the market based on available evidence and expert confirmation ensuring that volume and value estimates are fully consistent with one another.
Triangulation Framework — Input Contribution Weight
Relative weight each sizing input contributes to the final reconciled market estimate

Phase 7 — Forecast Modeling: Projecting Future Market Evolution
Forecasting evaluates the future trajectory of the market using a combination of quantitative indicators and qualitative assessments across economic, industry, and regulatory dimensions. Rather than simple extrapolation, each driver is independently modeled and integrated into a composite forecast.
Macroeconomic Indicators
GDP growth, industrial production, manufacturing output, construction activity, consumer spending, and capital investment form the quantitative foundation of long-term demand projections. These are applied at country, regional, and global levels.
Industry Growth Drivers
Urbanization, infrastructure development, industrialization, technological innovation, sustainability initiatives, and evolving product performance requirements are assessed at regional and industry levels — capturing both structural and cyclical demand drivers.
Capacity Expansion Analysis
Announced plant expansions, new manufacturing facilities, technology upgrades, and strategic investments are evaluated to determine future supply-demand dynamics and potential market tightness or oversupply situations.
Regulatory & Sustainability
Environmental regulations, chemical safety standards, emission reduction targets, circular economy initiatives, and sustainability requirements are incorporated as they often influence product adoption rates and market growth trajectories.
Scenario Forecast Range — Indexed Market Growth (Year 1–10)
Illustrative indexed growth trajectories across Base, Optimistic, and Pessimistic scenarios over a 10-year forecast horizon

Forecast Drivers — Relative Impact Score by Category
Impact score (0–100) of each driver type on chemicals & materials market forecast




Comments
Share your thoughts, ask a question, or provide feedback about this report.