
Asia Pacific Water Soluble Fertilizers Market Size Analysis Report 2035
The Asia Pacific Water-Soluble Fertilizers market size was valued at USD 8.82 billion in 2025, is estimated to reach USD 9.36 billion in 2026, and is projected to reach USD 16.02 billion by 2035, exhibiting a compound annual growth rate (CAGR) of 6.15% over the forecast period from 2026 to 2035.Modern irrigation, increasing food demand, precision farming, and the development of horticulture support growth. Through fertigation, nutrients are distributed efficiently, and resource waste is minimised in all forms of agriculture.
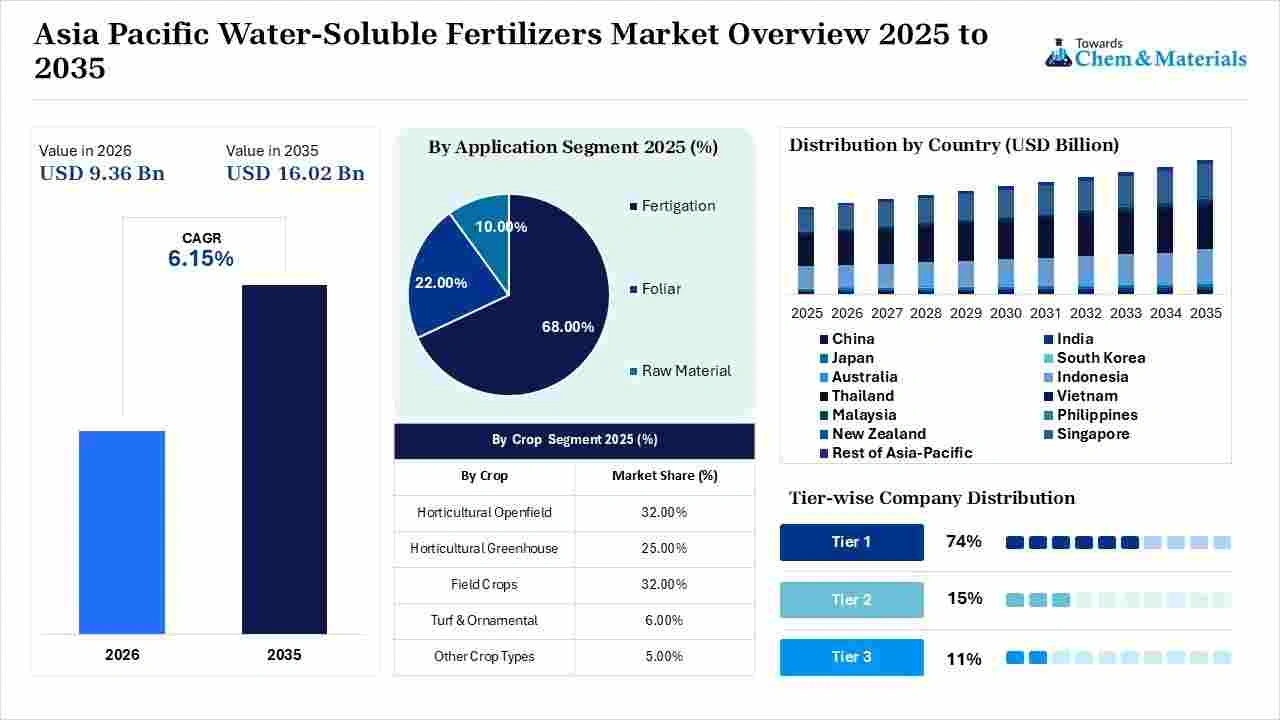
Product development is bolstered by polymer coatings, chelated micronutrients, automated irrigation, digital sensors, and AI-based scheduling. Customised formulations and protected cultivation are additional drivers behind the adoption of the crop wherever agricultural economies are flourishing in the region. These advances inspire manufacturers to enhance efficiency, product performance, and customized nutrient solutions.
Key Takeaways
- China dominated the Asia Pacific water-soluble fertilizers market by holding a 46% share in 2025 and is expected to grow at a CAGR of 6.6% during the forecast period.
- India held 24% market share in 2025 and is expected to grow at the fastest, with a CAGR of 7.2% during the forecast period.
- By product, the ammonium nitrate segment dominated the market with the largest share of 15% in 2025 and is expected to grow at a CAGR of 6.4% during the forecast period.
- By product, the potassium nitrate segment held a 12% market share in 2025 and is expected to grow at the fastest CAGR of 8.1% over the forecast period.
- By crop, the horticultural openfield segment dominated the market with the largest share of 32% in 2025 and is expected to grow at a CAGR of 7.2% during the forecast period.
- By crop, the horticultural greenhouse segment held 25% market share in 2025 and is expected to grow at the fastest CAGR of 8.6% over the forecast period.
- By application, the fertigation segment dominated the market with the largest share of 68% in 2025 and is expected to grow at a CAGR of 6.6% during the forecast period.
- By application, the foliar segment held a 22% market share in 2025 and is expected to grow at the fastest CAGR of 7.8% over the forecast period.
According to Towards Chemicals and Materials Analytics and Consulting, the asia pacific water-soluble fertilizers market volume was valued at 11.10 million metric tons in 2025 and is expected to surpass around 20.00 million metric tons by 2035, accelerating a compound annual growth rate (CAGR) of 6.06% over the forecast period from 2026 to 2035.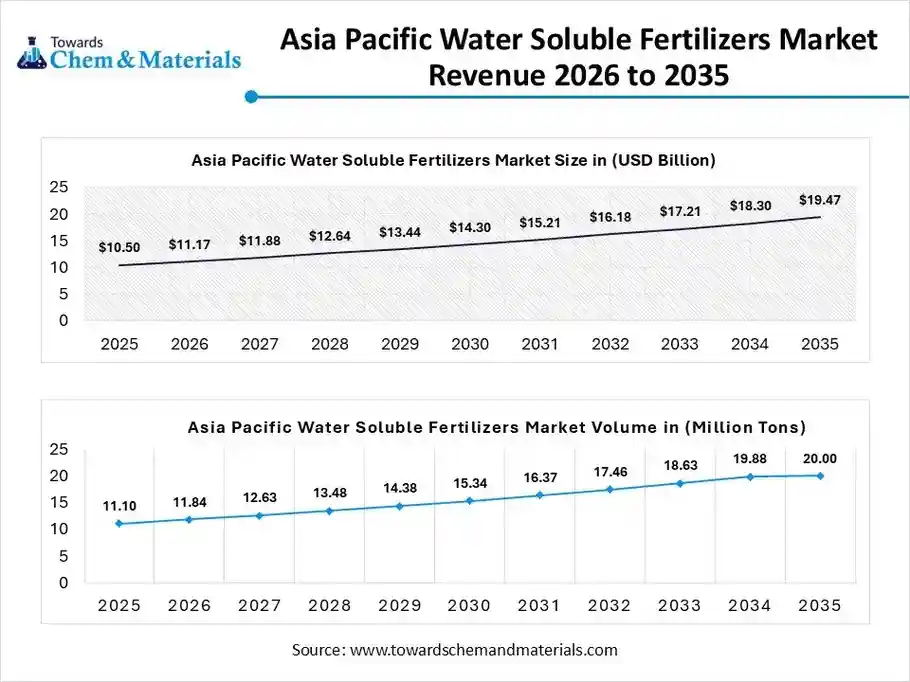
Market Overview
Asia Pacific water-soluble fertilizers market is growing at a fast pace, with farmers shifting towards modern farming methods. Specialized nutrient consumption is supported by the growing food demand in India and China for intensive cultivation. Fertigation and precision farming allow direct application of nutrients into irrigation systems, which helps to enhance nutrient use efficiency for a wide range of crops. Water-soluble fertilizers are completely dissolved and help plants absorb the nutrients via their roots and foliage as they are irrigated. However, regional needs for specialized nutrient formulations and efficient farming solutions are further bolstered by horticulture cultivation, resource shortages, and greenhouses/cultivation facilities.
- For instance, in April 2026, the National Academy of Agricultural Sciences held a brainstorming session on Atmanirbharta roadmap. The government departments, academia, representatives of the fertilizer industry, and the farmers highlighted the need for more self-reliance among the countrys own producers in this key industry.(Source: www.pib.gov.in )
Global Investment Movement for the Asia Pacific Water Soluble Fertilizers Market
The investment activities are mostly concerned with setting up a mixing and granulation plant in the main agricultural countries. Having localized production can help minimize the need for transport and increase regional availability of feed.Infrastructure is developed to process micronutrient blends and high-purity raw materials. These investments enhance overall specific fertilizer manufacturing capacity.There is a growing trend in involving companies in the sourcing and processing of agricultural products near the markets. Localizing supply chains can help mitigate exposure to delays in international trade and improve regional availability.Energy-efficient granulation equipment, low-emission production processes, automatic controls, and better formulations with boosted efficacy for better resource management are priorities.
Report Scope
| Report Attributes | Details |
| Market Size in 2026 | USD 9.36 Billion/ 11.77 Million Metric Tons |
| Expected Size in 2035 | USD 16.02 Billion/ 20.00 Million Metric Tons |
| Growth Rate | CAGR of 6.15% |
| Base Year of Estimation | 2025 |
| Forecast Period | 2025-2035 |
| Segment Covered | By Type, By Application |
| Key Companies Profiled | Coromandel International Limited, Gujarat State Fertilizers & Chemicals Limited, Deepak Fertilisers and Petrochemicals Corporation Limited, Indian Farmers Fertiliser Cooperative Limited, Kingenta Ecological Engineering Group Co., Ltd., Huaqiang Chemical Group Stock Co., Ltd., Incitec Pivot Limited, Sumitomo Chemical, Yara International ASA, ICL Group Ltd, Nutrien Ltd, Sociedad Química y Minera de Chile S.A. (SQM), Haifa Group |
Recent Market Trends
- The market for liquid water-soluble formats continues to rise as they have become easier to handle and are compatible with automated smart-irrigation and fertigation systems. These formats enable convenient nutrient integration.
- Chelated zinc, iron, and boron blends with NPK are more effective at correcting common soil deficiencies. These formulations can be used in targeted nutrient management under various production situations.
- Irrigation water application is an effective method of nutrient application that can help to reduce nutrient loss in the environment and increase nutrient utilization. The use of specialized fertilizers will be reinforced by fertigation and hydroponics.
- Crop nutrient budgeting is increasingly being applied by the major industry actors with digital tools and AI-driven platforms. These technologies enable accurate nutrient delivery and monitoring.
Key Technological Shifts and AI in the Asia Pacific Water Soluble Fertilizers Market
AI revolutionizes the use of water-soluble fertilizers by moving towards intelligent and real-time nutrient optimization in the agriculture sector. Information gathered from sensors on IoT devices, drones, and satellite data is fed into AI algorithms to get the right dosing. The technologies enable hyper-localized nutrient prescriptions and drip and foliar applications. More and more, soil moisture probes, weather forecasting, and automatic injection valves are integrated into platforms. Increased-efficiency formulations such as slow-release or full chelate formulations are complementary to digital nutrient-management technologies in agricultural systems.
Supply Chain Analysis of the Asia Pacific Water Soluble Fertilizers Market
Feedstock Procurement
- The procurement of feedstock such as high-purity potassium chloride, phosphate rock, ammonia, and phosphoric acid for the production of soluble nutrients is described.
Sustaining the consistent manufacturing of fertilizers and sustaining manufacturing operations for granulation and fluid in the region. - Coromandel International Limited arranges long-term import contracts for rock phosphate / phosphoric acid from around the world for the local manufacturing needs.
- Other Key Players: Nutrien Limited, SQM and ICL Group.
Chemical Synthesis & Processing
- Chemical processing involves reactions, neutralisation, and purification of raw inputs to make water-soluble intermediate nutrient compounds.
- The economic value is that effective processing allows for the manufacture of high-purity nitrate and specialty phosphate intermediates needed in downstream fertilizer formulation.
- Yara International: Advanced multi-stage processing technology is the secret to Yara International ASAs high-purity nitrate and specialty phosphate intermediates production process.
- Other Key Players: PhosAgro, EuroChem Group, K+S Aktiengesellschaft.
Improving Compound Formulation and Blending
- Formulation is the process of expertly creating graded nutrient ratios of macronutrients and micronutrients that are completely soluble and evenly distributed in nutrient products and solutions.
- The importance of accurate blending is that it allows for the creation of customized nutrient formulations that suit the needs of various crops, soil types, and agricultural uses.
- Kingenta Ecological Engineering Group has automated blending lines for tailored, slow-release and water-soluble crystal formulations.
- Other Key Players: Guangdong Kingenta, Compo Expert and Deepak Fertilisers.
Sustainability Analysis for the Asia Pacific Water Soluble Fertilizers Market
The manufacturing needs a significant amount of energy in the factory, which raises concerns about greenhouse gases. Product costs may be a challenge for small farms, and suitable safety equipment is still essential when handling products. Smart farming, drip irrigation, and eco-friendly formulations can help to make resources more efficient. Practicing controlled nutrient delivery allows for the reduction of nutrient losses and productive farming practices throughout the regional farming system.
What are Water Soluble Fertilizers?
Water-soluble fertilizers are specially formulated nutrient products that are fully water-soluble and can be easily used in the fields. They can be applied as a direct nutrient source via irrigation systems, fertigation, and foliar spray in order to supply soluble macro and micron nutrients to crops.
Uses of Water Soluble Fertilizers
- Fertilizers applied as water-soluble ones are the nutrients supplied directly by drip and sprinkler irrigation systems. This application can be used to target nutrients to the root zone and to optimize their placement in intensive agricultural production systems.
- Soluble nutrient formulations are suitable for fruits, vegetables, and horticultural crops as they enable intensive cultivation. Specific nutrient blends can be used to meet specific crop and soil needs.
- Water-soluble formulations are used in hydroponic growing systems to provide soluble nutrients to plants in controlled growing conditions. These applications will complement protected cultivation methods in agricultural markets.
- Soluble fertilizers may be applied in a foliar system, and thus nutrients can be applied directly to the surface of the plants. This is a great way to supplement root applications when there are special nutrient needs.
Pricing Analysis for the Asia Pacific Water Soluble Fertilizers Market
Water-solubles generally have a premium over conventional solid fertilizers in the Asia Pacific region. The price is variable based on energy feedstock expenses, export policies in the area, and plantation cycles throughout the season. Natural gas prices can affect costs for nitrogenous fertiliser production, and export restrictions may lead to supply scarcity. Peak applications could cause prices to rise again given the seasonal agricultural demand. Higher input costs can be partly compensated for by government irrigation subsidies and/or localized production.
Asia Pacific Water Soluble Fertilizers Market: Global Trade Analysis
There are evident signs of rising food demand, modern farming practices, and increasing needs for efficient crop production in the regional trade environment. China dominates the region in terms of production, and India focuses on smallholders in irrigation initiatives. Increasingly, Southeast Asian countries use soluble fertilizers for plantation crops, fruits, and other high-value crops. But market expansion may be limited by high prices, small farmers awareness deficits, technical and physical specifications of transportability, and trade barriers in the regional agricultural economies.
Regulatory Framework: Asia Pacific Water Soluble Fertilizers Market
| Country Region | Regulatory Body | Key Regulations | Focus Areas |
| China | Ministry of Agriculture and Rural Affairs (MARA) | Fertilizer Registration and Filing Administration Measures | Nutrient filing/registration, heavy metal limits |
| India | Ministry of Agriculture and Farmers Welfare | Fertiliser (Control) Order (FCO) | Grade specifications, mandatory nutrient percentages |
| Japan | Ministry of Agriculture, Forestry and Fisheries (MAFF) | Fertilizer Regulation Act | Nutrient use efficiency (NUE), safety standards |
Segmental Insights
Product Insights
The ammonium nitrate segment dominated the market with the largest share of 15% in 2025 and is expected to grow at a CAGR of 6.4% over the forecast period, as it was well established in various agricultural applications and was highly available for nutrient supply. The high position is indicative of demand for readily soluble nitrogen-based nutrition, especially in modern farming systems that are looking to optimize nutrient supply and nutrient development of various crops under a range of cultivation conditions.
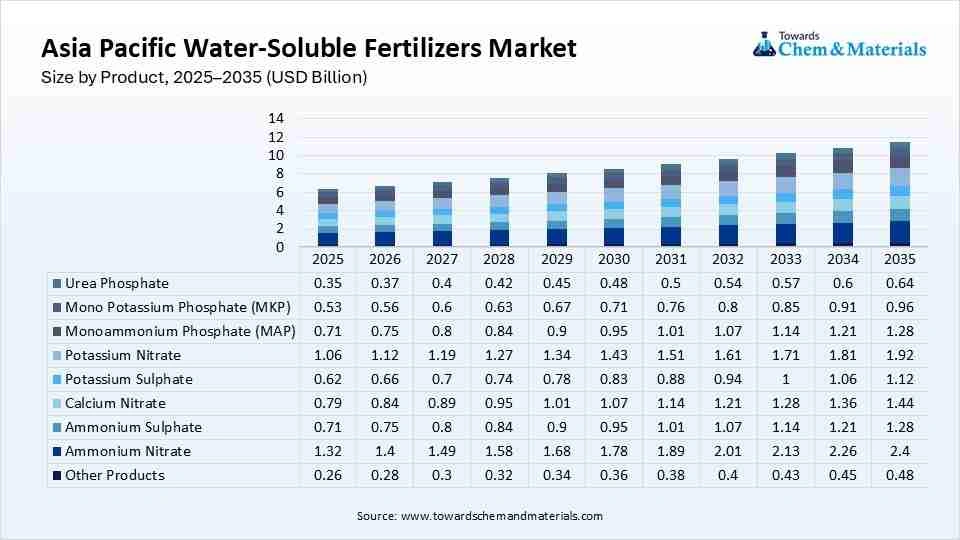
The potassium nitrate segment held a 12% market share in 2025 and is expected to grow at the fastest CAGR of 8.1% over the forecast period, owing to the rising demand for specialty nutrient formulations and balanced nutrient requirements. Its application is suitable for modern fertigation methods, and its delivery of potassium and nitrogen benefits crop development and precision nutrient management.
Asia Pacific Water Soluble Fertilizers Market Share, By Product, 2025(%)
| By Product | Market Share (%) |
| Ammonium Nitrate | 15.00% |
| Ammonium Sulphate | 8.00% |
| Calcium Nitrate | 9.00% |
| Potassium Sulphate | 7.00% |
| Potassium Nitrate | 12.00% |
| Monoammonium Phosphate (MAP) | 8.00% |
| Mono Potassium Phosphate (MKP) | 6.00% |
| Urea Phosphate | 4.00% |
| Magnesium Nitrate | 3.00% |
| Magnesium Sulfate | 4.00% |
| Water-soluble NPK | 11.00% |
| Urea | 5.00% |
| Urea Ammonium Nitrate | 5.00% |
| Other Products | 3.00% |
Crop Insights
The horticultural open-field segment dominated the market with the largest share of 32% in 2025 and is expected to grow at a CAGR of 7.2% over the forecast period, with a large area of fruits, vegetables, and other horticultural crops. Water-soluble fertilizers supply nutrients efficiently in open-field production systems and are suitable for irrigation systems, allowing nutrient supply to be targeted for nutrient and water use efficiency in various field production situations.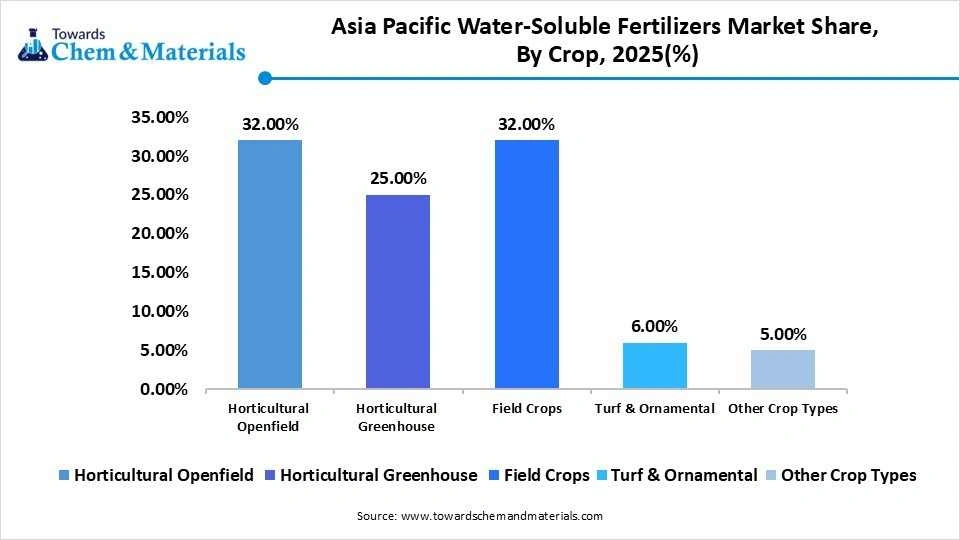
The horticultural greenhouse segment held a 25% market share in 2025 and is expected to grow at the fastest CAGR of 8.6% over the forecast period, due to the increasing protected and controlled cultivation. Precise nutrient management is essential in a greenhouse production system, and water-soluble fertilizers can be used for controlled irrigation and crop nutrition. The increasing adoption of intensive horticultural production further contributes to the development of the segments.
- For instance, from 11 to 17 July 2026, a mission was held in Japan by Dutch horticulture companies, knowledge institutions, government, and Japanese partners to further reinforce the longstanding collaboration in sustainable horticulture between the Netherlands and Japan.(Source: www.hortidaily.com)
Asia Pacific Water Soluble Fertilizers Market Share, By Crop, 2025(%)
| By Crop | Market Share (%) |
| Horticultural Openfield | 32.00% |
| Horticultural Greenhouse | 25.00% |
| Field Crops | 32.00% |
| Turf & Ornamental | 6.00% |
| Other Crop Types | 5.00% |
Application Insights
The fertigation segment dominated the market with the largest share of 68% in 2025 and is expected to grow at a CAGR of 6.6% over the forecast period, as water-soluble fertilizers are well integrated with water irrigation systems and are able to deliver nutrients. This application can be used for direct root zone nutrition and better use of fertilizers. Fertigation is further enhanced by the increasing use of drip and sprinkler irrigation systems throughout modern agricultural production systems in Asia Pacific.
- For instance, in March 2026, Netafim introduced its fifth-generation AI-based Dosing 5G systems in March 2026 which combine artificial intelligence with nutrient delivery technology to enhance fertilisation precision, automation, and agricultural control.(Source: www.global-agriculture.com )
The foliar segment held a 22% market share in 2025 and is expected to grow at the fastest CAGR of 7.8% over the forecast period, as farmers increasingly turn to direct and efficient nutrient supplementation. Foliar application helps to get nutrients to plant surfaces quickly, in addition to root nutrition. Given its ability to be used with specific formulations and precision farming, it is being adopted more widely in intensive farming and horticultural crops.
Asia Pacific Water Soluble Fertilizers Market Share, By Application, 2025(%)
| By Application | Market Share (%) |
| Fertigation | 68.00% |
| Foliar | 22.00% |
| Raw Material | 10.00% |
Regional Insights
How Did China Dominate the Asia Pacific Water Soluble Fertilizers Market in 2025?
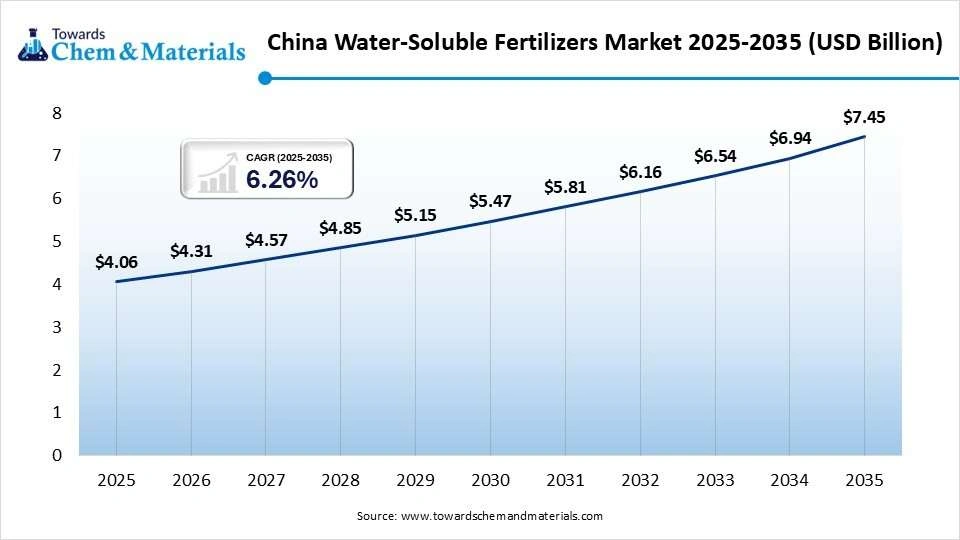
China water soluble fertilizers market size was estimated at USD 4.06 billion in 2025 and is projected to reach USD 7.45 billion by 2035, growing at a CAGR of 6.26% from 2026 to 2035.China dominated the market with the largest share of 46% in 2025 and is expected to grow at a CAGR of 6.6% during the forecast period. The region plays its primary role in China, guaranteed by large-scale production and intensive greenhouse farming. The use of water-soluble fertilizers in agricultural production continues to rise in China, driven further by the adoption of fertigation, the specificity of the nutrients, and increasingly modernized agricultural production.
India
India water soluble fertilizers market size was estimated at USD 2.12 billion in 2025 and is projected to reach USD 3.92 billion by 2035, growing at a CAGR of 6.34% from 2026 to 2035. India held a 24% market share in 2025 and is expected to grow at the fastest CAGR of 7.2% during the forecast period. Market development is fostered by smallholder irrigation schemes, growing food needs, and growing agricultural modernization. Indian formulation and domestic technology can further enhance the capability in specialized fertilizers and decrease reliance on imports.
- For instance, in 2025, after seven years of research, India built its first domestic water-soluble fertilizer technology in 2025, which can lessen reliance on China and enhance domestic capabilities in specialty fertilizers.(Source: economictimes.indiatimes.com)
Japan
Japan water soluble fertilizers market size was estimated at USD 0.71 billion in 2025 and is projected to reach USD 1.36 billion by 2035, growing at a CAGR of 6.72% from 2026 to 2035. Japan held an 8% market share in 2025 and is expected to grow at a CAGR of 4.8% over the forecast period. The utilization of advanced agricultural practices and requirements for efficient nutrient management favor ongoing use. There are water-soluble fertilizers for use in Japans agricultural fields, such as in fertigation, specialized formulations, and protected cultivation.
- For instance, in January 2026, during the study of polymer-coated fertilizer debris found throughout Japanese beaches by researchers from Tokyo Metropolitan University in January 2026, the rate of finding nearby applied PCFs near river mouths was around 0.2%.(Source: www.sciencedaily.com)
South Korea
South Korea held a 4.5% market share in 2025 and is expected to grow at a CAGR of 5.1% over the forecast period with market size was estimated at USD 0.40 billion in 2025 and is projected to reach USD 0.72 billion by 2035, growing at a CAGR of 6.05% from 2026 to 2035. Modern agricultural methods and requirements for efficient use of nutrients encourage the development of markets. The use of specialized soluble formulations can be used as a complement to precision agriculture, protected cultivation, and controlled nutrient delivery across relevant farming applications.
Australia
Australia held a 4% market share in 2025 and is expected to grow at a CAGR of 5.8% over the forecast period. Water-soluble fertilizers are promoted by water resource efficiency and the modern irrigation demand. Nutrient delivery can be efficient in meeting agricultural needs, as farmers are increasingly concerned about optimizing nutrient use and increasing nutrient productivity of the crop.
Competitive Analysis
The Asia Pacific water-soluble fertilizers market is still pretty competitive, with companies going after more specialized formulations, precision fertigation, and that “digital agriculture” vibe, plus a noticeable push toward sustainable crop nutrition, you know. A lot of the bigger players are leaning harder on fresh product ideas, localized production, digital connectivity, improved nutrient use efficiency, and agricultural solutions that feel tuned on purpose. In real life, these moves help manufacturers deal with shifting farmer needs across different regional farming markets, even when the planting cycles and soils are totally not the same.
- For instance, in April 2026, Haifa Group became a member of the European Biostimulants Industry Council, further strengthening its position in the field of advanced and sustainable plant nutrition. The development is indicative of the spread of knowledge about biostimulants in contemporary agriculture and resilient farming. (Source: www.haifa-group.com )
- In April 2026, Yara India increased its retailer onboarding with its Retailer Ordering System in Yara Connect. This development boosts the traceability of the products at the last mile and makes agricultural connections at the last mile digitally enabled in smallholder farming ecosystems.(Source: www.yara.in )
- In December 2025, Coromandel International introduced a next-generation water-soluble fertilizer with their special Smart Signalling Technology called Fertinex. The product facilitates precision fertigation, nutrient uptake efficiency, plant-microbe communication, and early crop resilience.(Source: www.coromandel.biz )
- In February 2026, Amarak Chemicals FZC is now operating a fully automated sulphur manufacturing plant in Jebel Ali Free Zone, Dubai. The development improves the Aries Group associate companys production and export capacities worldwide.(Source: www.global-agriculture.com )
Recent Developments
- In March 2026, ICL established a new specialty fertilizer plant in Maharashtra, India, contributing to greater supply security in the region. The development will help improve domestic availability despite being dependent on imports of fertilizer in the country and the geopolitical situation and disruptions in the Strait of Hormuz.(Source: www.businesswire.com )
Top Players in the Market & Their Offerings
| Company | Company Type/Position | Major Headquarters | Geographic Presence | Asia Pacific Water Soluble Fertilizers Offerings | Key Strength |
| Coromandel International | Regional | Secunderabad, India | Asia-Pacific | Fitsol, Gromor | Deep local expertise and crop-specific fertigation for smallholders |
| Kingenta Ecological Engineering | Regional | Linyi, China | Asia-Pacific | Controlled-release & Water-Soluble NPKs | Strong localized manufacturing capacity |
| Hebei Monband Water Soluble Fertilizer | Regional | Shijiazhuang, China | Asia-Pacific | Monband WSF Lines | Dedicated R&D in water-soluble technology |
Other Key Players
- Coromandel International Limited
- Gujarat State Fertilizers & Chemicals Limited
- Deepak Fertilisers and Petrochemicals Corporation Limited
- Indian Farmers Fertiliser Cooperative Limited
- Kingenta Ecological Engineering Group Co., Ltd.
- Huaqiang Chemical Group Stock Co., Ltd.
- Incitec Pivot Limited
- Sumitomo Chemical
- Yara International ASA
- ICL Group Ltd
- Nutrien Ltd
- Sociedad Química y Minera de Chile S.A. (SQM)
- Haifa Group
Segment Covered in the Report
By Product
- Ammonium Nitrate
- Standard Grade
- High-Purity Grade
- Fertigation Grade
- Ammonium Sulphate
- Standard Grade
- High-Purity Grade
- Calcium Nitrate
- Agricultural Grade
- Fertigation Grade
- Potassium Sulphate
- Standard SOP
- Water-Soluble SOP
- Potassium Nitrate
- Standard Grade
- Fertigation Grade
- High-Purity Grade
- Monoammonium Phosphate (MAP)
- Standard MAP
- Water-Soluble MAP
- Mono Potassium Phosphate (MKP)
- Standard MKP
- High-Purity MKP
- Urea Phosphate
- Standard Grade
- Fertigation Grade
- Magnesium Nitrate
- Standard Grade
- High-Purity Grade
- Magnesium Sulfate
- Standard Grade
- Soluble Grade
- Water-soluble NPK
- High-N NPK
- High-P NPK
- High-K NPK
- Balanced NPK
- Crop-Specific NPK
- Urea
- Prilled Urea
- Granular Urea
- Fully Soluble Urea
- Urea Ammonium Nitrate
- Standard UAN
- Stabilized UAN
- Other Products
- Micronutrient Fertilizers
- Specialty Secondary Nutrients
- Soluble Blended Fertilizers
By Crop
- Horticultural Openfield
- Fruits
- Vegetables
- Floriculture
- Horticultural Greenhouse
- Greenhouse Vegetables
- Greenhouse Fruits
- Flowers & Ornamentals
- Hydroponic Crops
- Field Crops
- Cereals & Grains
- Oilseeds
- Pulses
- Sugar Crops
- Turf & Ornamental
- Turf
- Landscape Plants
- Nursery Crops
- Other Crop Types
- Plantation Crops
- Specialty Crops
- Fodder Crops
By Application
- Fertigation
- Drip Fertigation
- Sprinkler Fertigation
- Hydroponic Fertigation
- Foliar
- Foliar NPK
- Foliar Micronutrients
- Foliar Specialty Formulations
- Raw Material
- Fertilizer Manufacturing
- Blending & Formulation
- Industrial Agricultural Inputs
A Seven-Phase Framework
Our methodology is designed to be universally applicable across commodity chemicals, specialty chemicals, petrochemicals, construction chemicals, coatings, electronic chemicals, industrial gases, agrochemicals, water treatment chemicals, and performance materials. Each phase builds upon the last, creating a layered validation structure that minimizes estimation error and maximizes analytical confidence.
The framework ensures comprehensive market coverage, robust cross-validation, and reliable long-term forecasting — producing market estimates that withstand scrutiny from investors, regulators, and corporate strategy teams.

Seven-Phase Framework — Analytical Effort Distribution
Relative analytical effort allocated across each phase of the Chemicals & Materials research framework

Phase 1 - Secondary Research: Establishing the Foundation
Secondary research collects and evaluates publicly available information from authoritative sources, establishing the foundational understanding of market structure, value chain dynamics, competitive landscape, and end-use demand patterns. Every source is evaluated for credibility, recency, geographic relevance, and methodological soundness before inclusion.
Industry Associations
Sources include ACC, CEFIC, ICCA, JCIA, CPCIF, and SOCMA providing production volumes, consumption trends, capacity developments, and sustainability initiatives.
Company Disclosures
Annual reports, investor presentations, earnings transcripts, and regulatory filings reveal product portfolios, manufacturing footprints, capacity expansions, and revenue segmentation.
Government Databases
National statistical offices, customs authorities, environmental agencies, and industrial production databases provide verified statistics on output, trade flows, and regulatory compliance.
Trade Databases
UN Comtrade, ITC, Eurostat, and national customs authorities enable assessment of global product movement, import dependency, and export competitiveness across regions.
Our Secondary Research Sources
- Ministry of Chemicals and Fertilizers
- European Chemicals Agency
- United States Department of Energy
- Ministry of Industry and Information Technology
- Ministry of Economy Trade and Industry
- Ministry of Trade Industry and Energy
- National Institute of Standards and Technology
- Council of Scientific and Industrial Research
- Fraunhofer Society
- National Institute for Materials Science
Phase 2 — Supply-Side Assessment: Mapping Production Capabilities
Production Capacity Analysis
All major manufacturers are assessed for existing installed capacity, planned additions, expansions, new plant announcements, and technology adoption — mapped at global, regional, and country levels.
Capacity Utilization Adjustment
Installed capacity is adjusted using utilization rates based on demand conditions, feedstock availability, plant operating rates, maintenance schedules, and regulatory restrictions.
Manufacturer Revenue Analysis
Product-specific revenues, segment-level performance, regional distribution, average selling prices, and margin trends are evaluated to establish market value estimates.
Supply-Side Assessment — Capacity vs. Effective Production by Region
Illustrative comparison of installed capacity vs. effective production volume (after utilization rate adjustment) across major regions

Phase 3 — Demand-Side Assessment: Quantifying Chemical Consumption
Demand-side analysis quantifies chemical consumption across industries, applications, and geographies — identifying where and how chemicals are consumed throughout the value chain with precision.
End-Use Industry Analysis
Chemical demand is evaluated across automotive, construction, packaging, electronics, agriculture, healthcare, consumer goods, industrial manufacturing, energy and utilities, and water treatment. Industry output, production trends, and consumption intensity are analyzed to determine demand patterns.
Consumption Modeling
Demand is estimated using measurable indicators: kilograms per vehicle, kilograms per square meter of construction, dosage per cubic meter of water treated, kilograms per hectare of agricultural land, and kilograms per ton of manufactured products. Consumption factors are validated through industry publications and primary interviews.
Application Analysis
The market is segmented by application area to understand product performance requirements, formulation trends, technology adoption, customer preferences, and regulatory requirements improving demand accuracy and segmentation granularity.
Demand-Side Assessment — End-Use Industry Demand Distribution
Illustrative distribution of chemical & materials demand across key end-use industries

Phase 4 - Trade Flow Analysis: Balancing Regional Supply and Demand
Trade flow analysis reconciles regional supply and demand estimates through import and export data, identifying net supply positions, regional dependencies, and market imbalances. It serves as an independent validation layer that tests the consistency of supply-side and demand-side estimates.
Import Analysis
Import data is evaluated to determine volumes, source countries, product dependency, regional supply gaps, and pricing trends — identifying markets that rely heavily on external supply and where domestic production is insufficient to meet demand.
Export Analysis
Export assessments reveal production surplus, export competitiveness, regional manufacturing strength, and global market participation. Export patterns also help validate domestic production estimates and identify net exporting regions.
Apparent Consumption Model
Regional consumption is assessed using the standard apparent consumption formula:
Results identify net importing regions, net exporting regions, regional deficits, and surpluses — serving as an independent validation of supply and demand estimates.
Trade Flow Analysis — Net Supply Position by Region
Illustrative apparent consumption vs. domestic production across major regions — positive gap indicates net import dependency

Phase 5 — Primary Research: The Critical Validation Layer
Primary research tests and refines findings from secondary research through direct engagement with industry participants across the supply chain, demand side, and expert community. It captures intelligence that no database or published report can provide — the real-world experience of manufacturers, buyers, and specialists operating in the market.

Supply-Side Interviews
Conversations with chemical manufacturers, raw material suppliers, contract manufacturers, technology providers, and plant operators cover production trends, capacity utilization, pricing developments, technology shifts, and competitive dynamics.

Demand-Side Interviews
Engagement with OEMs, industrial consumers, procurement managers, distributors, formulators, and end-use manufacturers focuses on consumption trends, purchasing behavior, product substitution, demand outlook, and emerging applications.

Industry Expert Consultations
Additional interviews with industry consultants, independent experts, regulatory specialists, technical professionals, and research institutions provide deeper market context and validate key analytical assumptions.
Focus Areas of Primary Research:
Market Size & Forecast Validation
Revenue estimates, volume consumption, growth rates, forecast assumptions, regional demand.Supply Chain & Value Chain Assessment
Raw material sourcing, supply chain challenges, distribution networks, procurement practices.Production & Capacity Analysis
Manufacturing capacity, utilization rates, expansion projects, plant investments.Pricing & Cost Structure Analysis
Product pricing trends, feedstock costs, energy costs, margin pressures, pricing outlook.Competitive Landscape Assessment
Volume and value estimates confirmed to be fully consistent with one another before publicationInterview Volume by Market Scope
| Study Scope | Number of Interviews |
|---|---|
| Niche Market | 20 – 30 |
| Mid-Sized Market | 30 – 50 |
| Global Market | 50 – 80 |
| Highly Fragmented Market | 80 – 120 |
Interview Details:
Category : Manufacturers, Suppliers, Distributors, End Users, Experts/Associations
Average Duration : 30–60 Minutes
Interview Mode : Video calls, telephonic interviews, expert consultations
Interview Format : Structured / Semi-Structured questionnaire
Focus Areas of Primary Research:
Market Size & Forecast Validation :
Revenue estimates, volume consumption, growth rates, forecast assumptions, regional demand.
Supply Chain & Value Chain Assessment :
Raw material sourcing, supply chain challenges, distribution networks, procurement practices.
Production & Capacity Analysis :
Manufacturing capacity, utilization rates, expansion projects, plant investments.
Pricing & Cost Structure Analysis :
Product pricing trends, feedstock costs, energy costs, margin pressures, pricing outlook.
Competitive Landscape Assessment :
Market share, competitor positioning, strategic initiatives, partnerships, acquisitions.
Primary Research — Stakeholder Coverage by Category
Distribution of interview respondents across stakeholder categories (% share from PPT data)

Primary Research — Respondent Designation Profile
Seniority breakdown of interview respondents (% share from PPT data)

Primary Research — Geographic Coverage of Interviews
Regional distribution of primary research engagement (% share from PPT data)

Phase 6 — Data Triangulation and Market Validation
No single methodology is relied upon in isolation. Multiple independent estimation approaches are combined and reconciled to ensure consistency, accuracy, and analytical defensibility. Any material deviations between approaches are investigated and adjusted through additional validation cycles.
The final market size is derived through weighted triangulation of all validated methodologies. Any material deviations between approaches are investigated and adjusted through additional validation cycles. The outcome represents the most realistic assessment of the market based on available evidence and expert confirmation ensuring that volume and value estimates are fully consistent with one another.
Triangulation Framework — Input Contribution Weight
Relative weight each sizing input contributes to the final reconciled market estimate

Phase 7 — Forecast Modeling: Projecting Future Market Evolution
Forecasting evaluates the future trajectory of the market using a combination of quantitative indicators and qualitative assessments across economic, industry, and regulatory dimensions. Rather than simple extrapolation, each driver is independently modeled and integrated into a composite forecast.
Macroeconomic Indicators
GDP growth, industrial production, manufacturing output, construction activity, consumer spending, and capital investment form the quantitative foundation of long-term demand projections. These are applied at country, regional, and global levels.
Industry Growth Drivers
Urbanization, infrastructure development, industrialization, technological innovation, sustainability initiatives, and evolving product performance requirements are assessed at regional and industry levels — capturing both structural and cyclical demand drivers.
Capacity Expansion Analysis
Announced plant expansions, new manufacturing facilities, technology upgrades, and strategic investments are evaluated to determine future supply-demand dynamics and potential market tightness or oversupply situations.
Regulatory & Sustainability
Environmental regulations, chemical safety standards, emission reduction targets, circular economy initiatives, and sustainability requirements are incorporated as they often influence product adoption rates and market growth trajectories.
Scenario Forecast Range — Indexed Market Growth (Year 1–10)
Illustrative indexed growth trajectories across Base, Optimistic, and Pessimistic scenarios over a 10-year forecast horizon

Forecast Drivers — Relative Impact Score by Category
Impact score (0–100) of each driver type on chemicals & materials market forecast




Comments
Share your thoughts, ask a question, or provide feedback about this report.