
What is the Asia Pacific Carbon Nanotube Reinforced Polymers Market Size and Share?
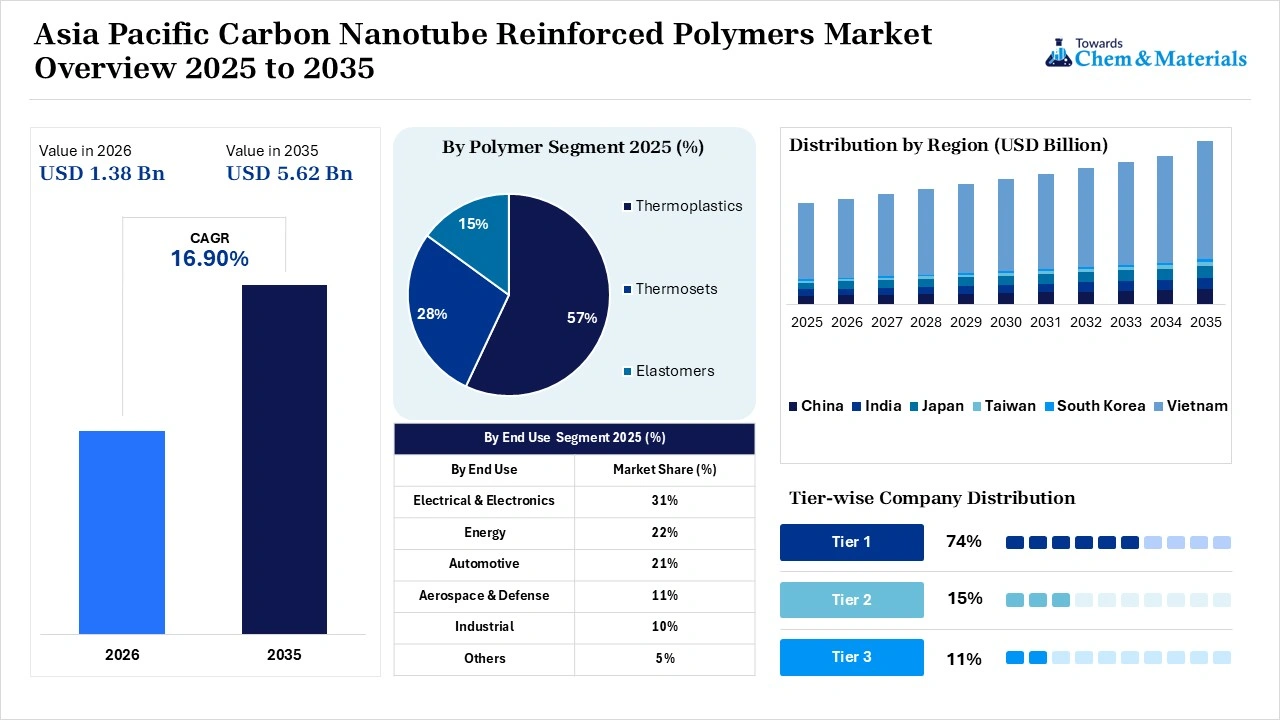
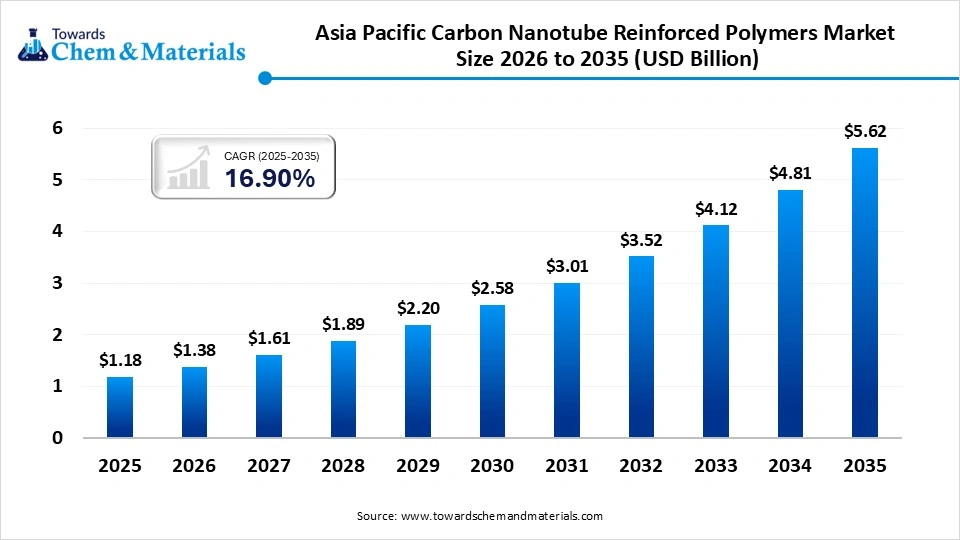
The Asia Pacific carbon nanotube reinforced polymers market size was valued at USD 1.18 billion in 2025 and is projected to grow from USD 1.38 billion in 2026 to USD 5.62 billion by 2035, exhibiting a CAGR of 16.90% during the forecast period. China dominated the carbon nanotube reinforced polymers industry with a 39% share in 2025.Application opportunities are increasing along with the rising demand for materials with low weight, electrical conductivity, thermal management, and electromagnetic interference shielding properties. Other developments to improve functionalization, dispersion, automated processing, and scalability of nanotubes are also supporting commercialization in a variety of polymer-based composite applications.
Market Highlights
- China dominated the Asia Pacific carbon nanotube-reinforced polymers market by holding a 39% share in 2025.
Japan held a 14% market share in 2025. - By polymer, the thermoplastics segment dominated the market with the largest share of 57% in 2025 and is expected to grow at a CAGR of 16.4% during the forecast period.
- By polymer, the elastomers segment held a 15% market share in 2025 and is expected to grow at the fastest CAGR of 18.9% over the forecast period.
- By end-use, the electrical & electronics segment dominated the market with the largest share of 31% in 2025 and is expected to grow at a CAGR of 18.1% during the forecast period.
- By end-use, the energy segment held a 22% market share in 2025 and is expected to grow at the fastest CAGR of 20.7% over the forecast period.
Market Overview
Carbon nanotube-reinforced polymers are composites of a polymer matrix and carbon nanotubes, which are lightweight, strong, conductive, and thermally capable. They are now used in increasingly diverse areas such as aerospace, automotive, electronics, energy, industrial equipment, and advanced manufacturing. In thermoplastic matrices, the polymer is used to create the matrix, requiring no additional curing steps. Single-walled carbon nanotubes and multi-walled carbon nanotubes offer a chance of electrical, mechanical, and thermal improvements.
Investment Movement for the Asia Pacific Carbon Nanotube Reinforced Polymers Market
Focus is increasingly on localized production capabilities, which can bolster supply for EVs, electronics, energy storage, and advanced industrial applications.Chemical companies are collaborating with industries further down the stream to create specific masterbatches and composite formulations to meet these dispersion and integration needs.Surface treatment, purification, and functionalization processes for enhancing nanotube compatibility, electrical conductivity, and mechanical properties are being supported by investment.As manufacturers respond to the growing expectations for sustainability, the investment also responds to the new requirements for environmental compliance and safer handling of nanomaterials.
Market Trends
- Although thermosets are important, it should be remembered that they are not the only materials that can be used for composite applications where the material must have a high mechanical strength and be lightweight, processable, and recyclable, since thermoplastics also have these properties.
- To disperse carbon nanotubes at low concentrations in a uniform manner in the polymer matrices, manufacturers are increasingly employing functionalization and advanced dispersion techniques.
- Carbon nanotube polymers are used for electrostatic discharge control, conductive components, thermal management, and electromagnetic interference shielding in electrical and electronics applications.
- Multiple-function (mechanical, electrical, thermal, sensing, protective) application-specific formulations are being developed increasingly by manufacturers.
Report Scope
| Report Attributes | Details |
| Market Size in 2026 | USD 1.38 Billion |
| Expected Size in 2035 | USD 5.62 Billion |
| Growth Rate | CAGR of 16.90% |
| Base Year of Estimation | 2025 |
| Forecast Period | 2025-2035 |
| Segment Covered | By Polymer, By End Use |
| Key Companies Profiled | Arkema S.A., Cabot Corporation, Carbon Solutions LLC, Cheap Tubes Inc., Jiangsu Cnano Technology Co. Ltd., LG Chem Ltd., Nanocyl SA, OCSiAl, Resonac Corporation, Toray International Inc. |
Key Technological Shifts and AI in the Asia Pacific Carbon Nanotube Reinforced Polymers Market
AI is revolutionizing the way carbon nanotube-reinforced polymers can be developed, thereby eliminating the need for conventional trial-and-error material optimization. AI can be used to aid with material discovery, formulation development, process optimization, quality evaluation, and application-specific composite design. A series of autonomous inverse design methods can be used to link the desired performance properties to materials structure and formulation. Physics-informed digital twins can aid in optimizing processes related to heat, pressure, and shear parameters.
Supply Chain Analysis of the Asia Pacific Carbon Nanotube Reinforced Polymers Market
Feedstock Procurement
- Feedstock procurement is the process of acquiring the hydrocarbons, the catalyst metals, the industrial gases, and the polymer resins that are needed for the production of nanotubes and composites.
- High-quality feedstock promotes reproducible nanotube production and robust performance of downstream polymer processing operations.
- Linde provides high-purity industrial gases and carbon feedstocks for use by major players.
- Other Key Players: Air Liquide, BASF, and Sabic.
Chemical Synthesis and Processing
- This stage includes the synthesis, purification, and functionalization of carbon nanotubes and preparation for their integration with a compatible polymer matrix.
- Processing has a significant impact on the quality of the nanotubes, their ability to be dispersed, the compatibility with polymers, and the performance of the composites, etc.
- OCSiAl Group is a manufacturer of high-purity single-walled carbon nanotubes and a developer of scalable liquid dispersion processing technologies.
- Other Key Players: LG Chem, Nanocyl and Arkema.
Compound Formulation and Blending
- Thermoplastic or thermoset materials are melt-blended, extruded, or otherwise treated by high shear with carbon nanotubes.
- Conductivity, mechanical performance, and commercial processing compatibility are related to the dispersion quality, which is a function of formulation and blending.
- Cabot Corporation offers conductive polymer masterbatches and special formulations for commercial extrusion uses
- Other Key Players: Toray Industries, Solvay, and Jiangsu Cnano Technology.
Sustainability Analysis:
Lightweighting and durability are the advantages of carbon nanotube-reinforced polymers, but their sustainability profile is complex. The energy needed for producing nanotubes can be significant, and greenhouse gas emissions can be a problem. But small amounts of fillers can enhance the properties of the composites and reduce material usage in the finished product. The ability to bond well between the nanotubes and polymer could also enhance durability and degradation resistance. Despite its difficulties, recycling is still possible due to the potential to complicate mechanical and chemical recovery processes with nanomaterials.
What are Carbon Nanotube Reinforced Polymers?
Carbon nanotube reinforced polymers are composite materials that can be formed based on a polymer matrix and carbon nanotubes. The final products have polymer processability and superior mechanical, electrical, and thermal properties.
Uses of Carbon Nanotube Reinforced Polymers
- Conductive/lightweight multifunctional materials include carbon nanotube-reinforced polymers for supporting conductive components, electronic housings, sensors, thermal management, EMI shielding, and electrostatic discharge.
- These composites are used for lithium-ion batteries, supercapacitors, fuel cells, solar systems, and energy storage materials that need conductivity, structural properties, and thermal management.
- The automotive market encompasses interior/exterior parts, under-the-hood parts, electric vehicle parts, lightweight structures, and electromagnetic protection systems that demand low weight and multi-functionality.
Pricing Analysis for the Asia Pacific Carbon Nanotube Reinforced Polymers Market
Carbon nanotube reinforced polymer prices vary by the type of carbon nanotubes used, their purity, how well they are dispersed in the polymer, the processing technique, and supply format. The higher production complexity of single-walled nanotubes, compared to multi-walled nanotubes, is a general rule. The costs may be increased further by advanced purification and functionalization. Additional costs may apply for masterbatches and liquid dispersions since they make downstream processing easier. The scale of manufacturing in a region can affect pricing, and quality standards and regulations may add to costs.
Asia Pacific Carbon Nanotube Reinforced Polymers Market: Global Trade Analysis
Trades involving carbon nanotube-reinforced polymer usage are still niche, as materials are often required to be used in high-performance electronics, aerospace, defense, automotive, and energy systems. Technologically advanced manufacturing areas and specialized suppliers are involved in trade flows. Among key exporting countries, the United States, Japan, Germany, and South Korea are recognized as key exporters, and among key demand countries, North America, Western Europe, Taiwan, China, and South Korea are recognized.
Segmental Insights
Polymer Insights
The thermoplastics segment dominated the market with the largest share of 57% in 2025 and is expected to grow at a CAGR of 16.4% over the forecast period. Thermoplastics have the advantage of being lightweight, processable, recyclable, and showing good mechanical properties. These products are used in electrical components, automotive parts, energy systems, electronics, and industrial products. This compatibility also makes them suitable for larger processing methods, ensuring their seamless integration into mass-produced composite manufacturing.
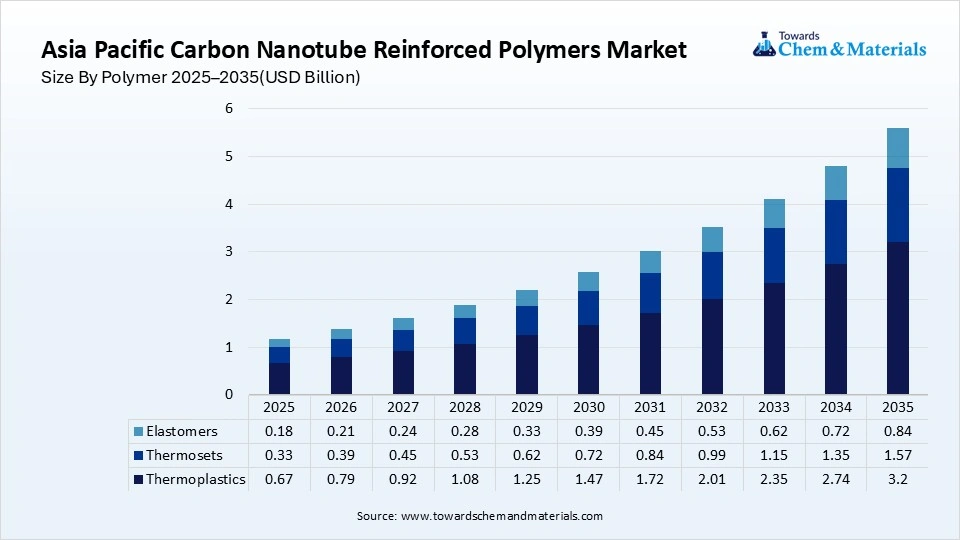
The elastomers segment held a 15% market share in 2025 and is expected to grow at the fastest CAGR of 18.9% over the forecast period. Elastomers are used in composite applications to offer flexibility, elasticity, and functionality. The use of carbon nanotubes can be useful in supporting conductivity, sensing, reinforcement, and advanced functionality of materials. They have potential applications in the automotive industry, healthcare, electronics, and specialized applications, which could provide opportunities for further elastomer-based formulations.
- In February 2026, Lignin Industries launched Renol TPV 70/30, an elastomer formulation for blending elastomer additives in polyolefin-based elastomers. (Source: interplasinsights.com)
Asia Pacific Carbon Nanotube Reinforced Polymers Market Share, By Polymer, 2025(%)
| By Polymer | Market Share (%) |
| Thermoplastics | 57% |
| Thermosets | 28% |
| Elastomers | 15% |
End-Use Insights
The electrical & electronics segment dominated the market with the largest share of 31% in 2025 and is expected to grow at a CAGR of 18.1% over the forecast period. Carbon nanotube-reinforced polymers are conductive, offer thermal management, are lightweight, and offer EMI/ESD shielding. These properties facilitate semiconductor elements, electronic enclosures, sensors, conductive elements, and highly functional electronic systems.
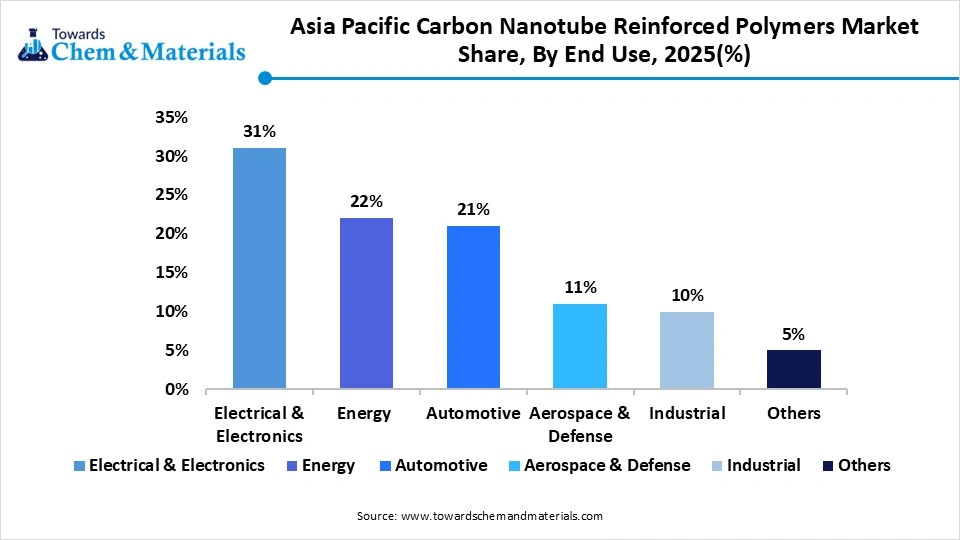
The energy segment held a 22% market share in 2025 and is expected to grow at the fastest CAGR of 20.7% over the forecast period. Conductive and structural applications are covered in lithium-ion batteries, supercapacitors, fuel cells, solar power systems, and energy storage systems for carbon nanotube-reinforced polymers. As the energy demands rise, new possibilities are emerging for multifunctional polymer composites, which possess conductivity, thermal management properties, and low weight.
Asia Pacific Carbon Nanotube Reinforced Polymers Market Share, By End Use, 2025(%)
| By End Use | Market Share (%) |
| Electrical & Electronics | 31% |
| Energy | 22% |
| Automotive | 21% |
| Aerospace & Defense | 11% |
| Industrial | 10% |
| Others | 5% |
Regional Insights
How Did China Dominate the Asia Pacific Carbon Nanotube Reinforced Polymers Market in 2025?
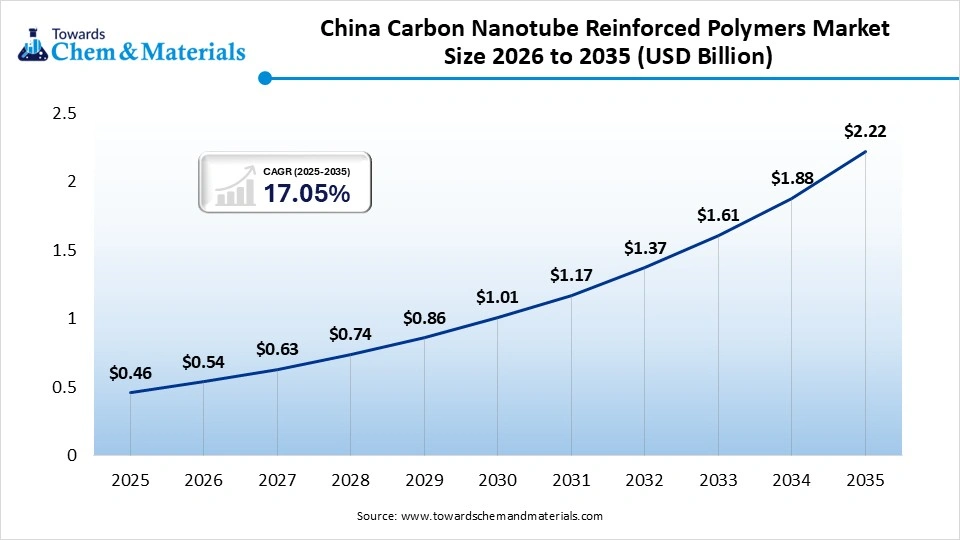
China Carbon Nanotube Reinforced Polymers market size was estimated at USD 0.46 billion in 2025 and is projected to reach USD 2.22 billion by 2035, growing at a CAGR of 17.05% from 2026 to 2035. China dominated the market with the largest share of 39% in 2025. The region has a history of chemical production, electronics manufacturing, polymer processing, and advanced materials. Market shares also include the Chinese production activities of Jiangsu Cnano Technology and Mitsubishi Chemical. These industrial capacities enable product and material development for composite products in energy, polymer compounds, electronic applications, vehicle components, and nanotube materials in the regional value chain.
- In April 2025, Mitsubishi Chemical increased its capacity for fire-resistant compounds for cable sheathing and other applications, using polyolefin and thermoplastic elastomer materials.
(Source: www.indianchemicalnews.com)
Japan
Japan Carbon Nanotube Reinforced Polymers market size was estimated at USD 0.17 billion in 2025 and is projected to reach USD 0.81 billion by 2035, growing at a CAGR of 16.90% from 2026 to 2035.Japan held a 14% market share in 2025. The nation has solid representation in advanced materials, automotive technologies, electronics, and composite manufacturing. Toray Industries contributes through advanced composite technologies and the development of carbon fibre. Additionally, opportunities for carbon nanotube-reinforced polymer applications that require thermal properties, conductivity, lightweight structures, and specialized manufacturing techniques are available due to the expertise developed by the Japanese in high-performance materials and manufacturing.
- In February 2026, Toray Industries developed and trialed new, faster CFRP bonding technology for aircraft applications, and Toray Composite Materials America (Toray CMA) qualified its 3960 prepreg system with NCAMP. (Source: www.jeccomposites.com)
South Korea
South Korea Carbon Nanotube Reinforced Polymers market size was estimated at USD 0.15 billion in 2025 and is projected to reach USD 0.76 billion by 2035, growing at a CAGR of 17.62% from 2026 to 2035.South Korea held a 13% market share in 2025. The country has made strides in participation in chemical manufacturing, electronics, advanced materials, and energy technologies. LG Chem is mentioned in the list of key carbon nanotube industry players. Other research from South Korea focuses on polymer carbon nanotube composites used for energy storage. These functions open up potential fields of application for advanced composite materials, which are used in batteries, electronics, conductive components, and special polymer formulations.
India
India Carbon Nanotube Reinforced Polymers market size was estimated at USD 0.12 billion in 2025 and is projected to reach USD 0.59 billion by 2035, growing at a CAGR of 17.26% from 2026 to 2035.India held a 10% market share in 2025. Domestic companies are involved in the production of carbon nanotubes in the country, including NoPo Nanotechnologies and Adnano Technologies. These companies offer single-walled and multi-walled carbon nanotubes for industrial use. India is now active in the market, indicating improvement in advanced materials, polymer technologies, electronics, automotive applications, and specialized nanomaterial development capabilities.
Asia Pacific Carbon Nanotube Reinforced Polymers Market Share, By Country, 2025(%)
| By Country | Market Share (%) |
| China | 39% |
| Japan | 14% |
| South Korea | 13% |
| India | 10% |
| Taiwan | 7% |
| Indonesia | 3% |
| Vietnam | 3% |
| Thailand | 3% |
| Philippines | 2% |
| Malaysia | 2% |
| Singapore | 2.0% |
| Australia | 2% |
Taiwan
Taiwan Carbon Nanotube Reinforced Polymers market size was estimated at USD 0.08 billion in 2025 and is projected to reach USD 0.42 billion by 2035, growing at a CAGR of 18.04% from 2026 to 2035.Taiwan held a 7% market share in 2025. The country is involved in high-end carbon nanotube applications via special activities related to nanomaterials and batteries. SiAT is provided as a market instance for Taoyuan to develop SWCNT conductive paste. Such activities bring together carbon nanotube technologies and lithium-ion batteries, electric vehicles, energy storage, and other advanced applications of conductive materials.
Indonesia
Indonesia held a 3% market share in 2025. The country contributes to market coverage in Asia Pacific and offers various application areas in automotive, electronics, energy, industrial, construction, and consumer segments. Indonesia did not provide any company or investment instances. So the analysis is restricted to the market applications and regional segmentation offered.
Vietnam
Vietnam held a 3% market share in 2025. The country is part of the Asia Pacific regional coverage, with possible demand regions in the electronics, automotive, industrial products, telecommunications, construction, and energy sectors. No Vietnam examples of companies, investment, or technology were provided. For this reason, the country analysis is based on the market segmentation provided without any company-specific or numerical assumptions.
Thailand
Thailand held a 3% market share in 2025. The country is part of the regional market coverage and links to the application categories of automotive, electronics, industrial equipment, energy, construction, and consumer products. No specific development or company instance was provided for Thailand. So, country-level analysis continues to look at the applications specifically included in the provided Asia Pacific market segmentation.
Philippines
Philippines held a 2% market share in 2025. The country is part of the Asia Pacific market scope and hence encompasses applications across the electronics, energy, automotive, industrial, telecom, construction, and marine sectors. Any example that involved investment, company development, or technology in the Philippines was not given. In such a way, the analysis steers clear of unsupported statements on a country-specific level while preserving the provided regional segmentation.
Malaysia
Malaysia held a 2% market share in 2025. The country is part of the Asia Pacific market segmentation, which could be applicable to various electronics, industrial manufacturing, automotive, energy, telecommunications, and construction applications. There was no example of a company or investment in Malaysia. For this reason, this country analysis does not include any quantitative information that may not be supported by the provided market scope and application categories.
Singapore
Singapore held a 2% market share in 2025. The nation is part of the Asia Pacific market coverage and includes applications like electronics, energy, telecommunications, industrial products, sensors, and advanced manufacturing. No Singapore-specific company or investment instance was provided. So the analysis doesn't cover the market applications and segmentation listed in the provided information.
Australia
Australia held a 2% market share in 2025. The country is part of the Asia Pacific market segmentation and offers applications in energy, industrial products, electronics, construction, marine applications, and sensors. No company, investment, or technological development was given specifically for Australia. Therefore, no unsupported claims are included in the analysis, and the applications listed in the provided market boundaries are kept.
Recent Developments
- In May 2025, Zeon and SiAT entered into a strategic alliance to help advance the SWCNT conductive paste market and next-generation lithium-battery industry.(Source: www.businesswire.com)
Competitive Analysis
Asia Pacific Carbon Nanotube Reinforced Polymers Market comprises specialized nanotube manufacturers, chemical manufacturers, polymer compound suppliers, and advanced-material companies. The competition focuses on quality, dispersion, functionalization, processing scalability, application-specific formulations, and manufacturing capacity of the nanotubes. The other participants represent various stages of the value chain, including OCSIal, LG Chem, Jiangsu Cnano Technology, Cabot Corporation, Toray Industries, etc.
- In February 2026, ARLANXEO opened a Therban HNBR production line in Changzhou, China, expanding elastomer manufacturing capacity in the region, supporting the development of new energy, new mobility and industrial applications.(Source: www.indianchemicalnews.com)
- In January 2026, Birla Carbon exhibited NanoTech 26 in Tokyo, featuring MWCNT solutions, as well as engineered Nanocyl formulations for energy storage, automotive, electronics, and transportation.
(Source: www.birlacarbon.com)
Top Players in the Market & Their Offerings
| Company | Company Type/Position | Major Headquarters | Geographic Presence | Asia Pacific Carbon Nanotube Reinforced Polymers Offerings | Key Strength |
| NoPo Nanotechnologies | Domestic | Bengaluru, Karnataka | India, USA, Global | HiPCO® Single-Walled Carbon Nanotubes | World-class expertise in small-diameter SWCNTs at scale |
| Adnano Technologies | Domestic Manufacturer / Supplier | Shimoga, Karnataka | Pan-India, APAC | MWCNT Powder, Functionalized CNTs | Deep focus on high-purity industrial scaling |
Other Key Players
- Arkema S.A.
- Cabot Corporation
- Carbon Solutions LLC
- Cheap Tubes Inc.
- Jiangsu Cnano Technology Co. Ltd.
- LG Chem Ltd.
- Nanocyl SA
- OCSiAl
- Resonac Corporation
- Toray International Inc.
Segment Covered in the Report
By Polymer
- Thermoplastics
- Polypropylene (PP)
- Polyethylene (PE)
- Polyamide (PA/Nylon)
- Polycarbonate (PC)
- Polyether ether ketone (PEEK)
- Polybutylene terephthalate (PBT)
- Polyetherimide (PEI)
- Acrylonitrile Butadiene Styrene (ABS)
- Other Thermoplastics
- Thermosets
- Epoxy
- Phenolic
- Polyester
- Vinyl Ester
- Polyurethane Thermosets
- Other Thermosets
- Elastomers
- Silicone Elastomers
- Thermoplastic Elastomers (TPE)
- Natural/Synthetic Rubber
- Fluoroelastomers
- Other Elastomers
By End Use
- Electrical & Electronics
- Semiconductor Components
- Electronic Housings
- EMI/ESD Shielding
- Conductive Components
- Thermal Management
- Sensors
- Energy
- Lithium-Ion Batteries
- Supercapacitors
- Fuel Cells
- Solar & Energy Systems
- Energy Storage Components
- Automotive
- Interior Components
- Exterior Components
- Under-the-Hood Components
- EV Components
- EMI/ESD Protection
- Lightweight Structural Components
- Aerospace & Defense
- Aircraft Components
- UAV/Drone Components
- Defense Electronics
- EMI/ESD Shielding
- Lightweight Structural Components
- Thermal Management Components
- Industrial
- Machinery Components
- Pipes & Tanks
- Industrial Electronics
- Conductive Components
- Coatings & Linings
- 3D Printing & Additive Manufacturing
- Others
- Healthcare
- Consumer Goods
- Telecommunications
- Construction
- Marine
- Sensors & Instrumentation
Global Data Center Market Intelligence Database
Build a continuously refreshed intelligence system connecting data center facilities, capacity, customer demand, pricing economics, power infrastructure, technology, supply chain, investment and M&A activity.
Data Center Intelligence Architecture
Seven integrated intelligence layers designed for market sizing, competitive intelligence, commercial strategy, investment analysis, procurement intelligence and recurring market monitoring.
Database Linkage
The architecture connects physical supply, demand, economics, infrastructure, technology, supply chain and capital markets into one intelligence system.
Built for Decision-Grade Intelligence
Precedence Research positions its research around actionable insights, customized analysis, strategy consulting and continuously updated intelligence.
Strategic Intelligence
Connect market structure with commercial opportunities, competitive dynamics and growth decisions.
Granular Data
Move beyond headline market numbers into facility, capacity, customer, project and supplier-level intelligence.
Continuous Intelligence
Architecture designed for recurring updates, validation and monitoring as market conditions change.
Customized Research
Adapt the intelligence architecture to specific client markets, geographies and strategic questions.
“The Precedence Research team showcased a deep understanding of our project objectives, ensuring alignment with our unique requirements.”
— GE“Precedence Research’s proactive approach and commitment to delivering high-quality results have been instrumental in achieving our research objectives effectively.”
— PfizerBuild Your Data Center Intelligence Program
Need facility-level data, capacity tracking, customer intelligence, pricing benchmarks, project pipelines, technology mapping, supplier intelligence or M&A monitoring? Precedence Research can develop a customized intelligence architecture around your business priorities.
Request Customized IntelligenceA Seven-Phase Framework
Our methodology is designed to be universally applicable across commodity chemicals, specialty chemicals, petrochemicals, construction chemicals, coatings, electronic chemicals, industrial gases, agrochemicals, water treatment chemicals, and performance materials. Each phase builds upon the last, creating a layered validation structure that minimizes estimation error and maximizes analytical confidence.
The framework ensures comprehensive market coverage, robust cross-validation, and reliable long-term forecasting — producing market estimates that withstand scrutiny from investors, regulators, and corporate strategy teams.

Seven-Phase Framework — Analytical Effort Distribution
Relative analytical effort allocated across each phase of the Chemicals & Materials research framework

Phase 1 - Secondary Research: Establishing the Foundation
Secondary research collects and evaluates publicly available information from authoritative sources, establishing the foundational understanding of market structure, value chain dynamics, competitive landscape, and end-use demand patterns. Every source is evaluated for credibility, recency, geographic relevance, and methodological soundness before inclusion.
Industry Associations
Sources include ACC, CEFIC, ICCA, JCIA, CPCIF, and SOCMA providing production volumes, consumption trends, capacity developments, and sustainability initiatives.
Company Disclosures
Annual reports, investor presentations, earnings transcripts, and regulatory filings reveal product portfolios, manufacturing footprints, capacity expansions, and revenue segmentation.
Government Databases
National statistical offices, customs authorities, environmental agencies, and industrial production databases provide verified statistics on output, trade flows, and regulatory compliance.
Trade Databases
UN Comtrade, ITC, Eurostat, and national customs authorities enable assessment of global product movement, import dependency, and export competitiveness across regions.
Our Secondary Research Sources
- Ministry of Chemicals and Fertilizers
- European Chemicals Agency
- United States Department of Energy
- Ministry of Industry and Information Technology
- Ministry of Economy Trade and Industry
- Ministry of Trade Industry and Energy
- National Institute of Standards and Technology
- Council of Scientific and Industrial Research
- Fraunhofer Society
- National Institute for Materials Science
Phase 2 — Supply-Side Assessment: Mapping Production Capabilities
Production Capacity Analysis
All major manufacturers are assessed for existing installed capacity, planned additions, expansions, new plant announcements, and technology adoption — mapped at global, regional, and country levels.
Capacity Utilization Adjustment
Installed capacity is adjusted using utilization rates based on demand conditions, feedstock availability, plant operating rates, maintenance schedules, and regulatory restrictions.
Manufacturer Revenue Analysis
Product-specific revenues, segment-level performance, regional distribution, average selling prices, and margin trends are evaluated to establish market value estimates.
Supply-Side Assessment — Capacity vs. Effective Production by Region
Illustrative comparison of installed capacity vs. effective production volume (after utilization rate adjustment) across major regions

Phase 3 — Demand-Side Assessment: Quantifying Chemical Consumption
Demand-side analysis quantifies chemical consumption across industries, applications, and geographies — identifying where and how chemicals are consumed throughout the value chain with precision.
End-Use Industry Analysis
Chemical demand is evaluated across automotive, construction, packaging, electronics, agriculture, healthcare, consumer goods, industrial manufacturing, energy and utilities, and water treatment. Industry output, production trends, and consumption intensity are analyzed to determine demand patterns.
Consumption Modeling
Demand is estimated using measurable indicators: kilograms per vehicle, kilograms per square meter of construction, dosage per cubic meter of water treated, kilograms per hectare of agricultural land, and kilograms per ton of manufactured products. Consumption factors are validated through industry publications and primary interviews.
Application Analysis
The market is segmented by application area to understand product performance requirements, formulation trends, technology adoption, customer preferences, and regulatory requirements improving demand accuracy and segmentation granularity.
Demand-Side Assessment — End-Use Industry Demand Distribution
Illustrative distribution of chemical & materials demand across key end-use industries

Phase 4 - Trade Flow Analysis: Balancing Regional Supply and Demand
Trade flow analysis reconciles regional supply and demand estimates through import and export data, identifying net supply positions, regional dependencies, and market imbalances. It serves as an independent validation layer that tests the consistency of supply-side and demand-side estimates.
Import Analysis
Import data is evaluated to determine volumes, source countries, product dependency, regional supply gaps, and pricing trends — identifying markets that rely heavily on external supply and where domestic production is insufficient to meet demand.
Export Analysis
Export assessments reveal production surplus, export competitiveness, regional manufacturing strength, and global market participation. Export patterns also help validate domestic production estimates and identify net exporting regions.
Apparent Consumption Model
Regional consumption is assessed using the standard apparent consumption formula:
Results identify net importing regions, net exporting regions, regional deficits, and surpluses — serving as an independent validation of supply and demand estimates.
Trade Flow Analysis — Net Supply Position by Region
Illustrative apparent consumption vs. domestic production across major regions — positive gap indicates net import dependency

Phase 5 — Primary Research: The Critical Validation Layer
Primary research tests and refines findings from secondary research through direct engagement with industry participants across the supply chain, demand side, and expert community. It captures intelligence that no database or published report can provide — the real-world experience of manufacturers, buyers, and specialists operating in the market.

Supply-Side Interviews
Conversations with chemical manufacturers, raw material suppliers, contract manufacturers, technology providers, and plant operators cover production trends, capacity utilization, pricing developments, technology shifts, and competitive dynamics.

Demand-Side Interviews
Engagement with OEMs, industrial consumers, procurement managers, distributors, formulators, and end-use manufacturers focuses on consumption trends, purchasing behavior, product substitution, demand outlook, and emerging applications.

Industry Expert Consultations
Additional interviews with industry consultants, independent experts, regulatory specialists, technical professionals, and research institutions provide deeper market context and validate key analytical assumptions.
Focus Areas of Primary Research:
Market Size & Forecast Validation
Revenue estimates, volume consumption, growth rates, forecast assumptions, regional demand.Supply Chain & Value Chain Assessment
Raw material sourcing, supply chain challenges, distribution networks, procurement practices.Production & Capacity Analysis
Manufacturing capacity, utilization rates, expansion projects, plant investments.Pricing & Cost Structure Analysis
Product pricing trends, feedstock costs, energy costs, margin pressures, pricing outlook.Competitive Landscape Assessment
Volume and value estimates confirmed to be fully consistent with one another before publicationInterview Volume by Market Scope
| Study Scope | Number of Interviews |
|---|---|
| Niche Market | 20 – 30 |
| Mid-Sized Market | 30 – 50 |
| Global Market | 50 – 80 |
| Highly Fragmented Market | 80 – 120 |
Interview Details:
Category : Manufacturers, Suppliers, Distributors, End Users, Experts/Associations
Average Duration : 30–60 Minutes
Interview Mode : Video calls, telephonic interviews, expert consultations
Interview Format : Structured / Semi-Structured questionnaire
Focus Areas of Primary Research:
Market Size & Forecast Validation :
Revenue estimates, volume consumption, growth rates, forecast assumptions, regional demand.
Supply Chain & Value Chain Assessment :
Raw material sourcing, supply chain challenges, distribution networks, procurement practices.
Production & Capacity Analysis :
Manufacturing capacity, utilization rates, expansion projects, plant investments.
Pricing & Cost Structure Analysis :
Product pricing trends, feedstock costs, energy costs, margin pressures, pricing outlook.
Competitive Landscape Assessment :
Market share, competitor positioning, strategic initiatives, partnerships, acquisitions.
Primary Research — Stakeholder Coverage by Category
Distribution of interview respondents across stakeholder categories (% share from PPT data)

Primary Research — Respondent Designation Profile
Seniority breakdown of interview respondents (% share from PPT data)

Primary Research — Geographic Coverage of Interviews
Regional distribution of primary research engagement (% share from PPT data)

Phase 6 — Data Triangulation and Market Validation
No single methodology is relied upon in isolation. Multiple independent estimation approaches are combined and reconciled to ensure consistency, accuracy, and analytical defensibility. Any material deviations between approaches are investigated and adjusted through additional validation cycles.
The final market size is derived through weighted triangulation of all validated methodologies. Any material deviations between approaches are investigated and adjusted through additional validation cycles. The outcome represents the most realistic assessment of the market based on available evidence and expert confirmation ensuring that volume and value estimates are fully consistent with one another.
Triangulation Framework — Input Contribution Weight
Relative weight each sizing input contributes to the final reconciled market estimate

Phase 7 — Forecast Modeling: Projecting Future Market Evolution
Forecasting evaluates the future trajectory of the market using a combination of quantitative indicators and qualitative assessments across economic, industry, and regulatory dimensions. Rather than simple extrapolation, each driver is independently modeled and integrated into a composite forecast.
Macroeconomic Indicators
GDP growth, industrial production, manufacturing output, construction activity, consumer spending, and capital investment form the quantitative foundation of long-term demand projections. These are applied at country, regional, and global levels.
Industry Growth Drivers
Urbanization, infrastructure development, industrialization, technological innovation, sustainability initiatives, and evolving product performance requirements are assessed at regional and industry levels — capturing both structural and cyclical demand drivers.
Capacity Expansion Analysis
Announced plant expansions, new manufacturing facilities, technology upgrades, and strategic investments are evaluated to determine future supply-demand dynamics and potential market tightness or oversupply situations.
Regulatory & Sustainability
Environmental regulations, chemical safety standards, emission reduction targets, circular economy initiatives, and sustainability requirements are incorporated as they often influence product adoption rates and market growth trajectories.
Scenario Forecast Range — Indexed Market Growth (Year 1–10)
Illustrative indexed growth trajectories across Base, Optimistic, and Pessimistic scenarios over a 10-year forecast horizon

Forecast Drivers — Relative Impact Score by Category
Impact score (0–100) of each driver type on chemicals & materials market forecast




Comments
Share your thoughts, ask a question, or provide feedback about this report.