
Agricultural Enzymes Market Size, Competitive Landscape Analysis Report 2035
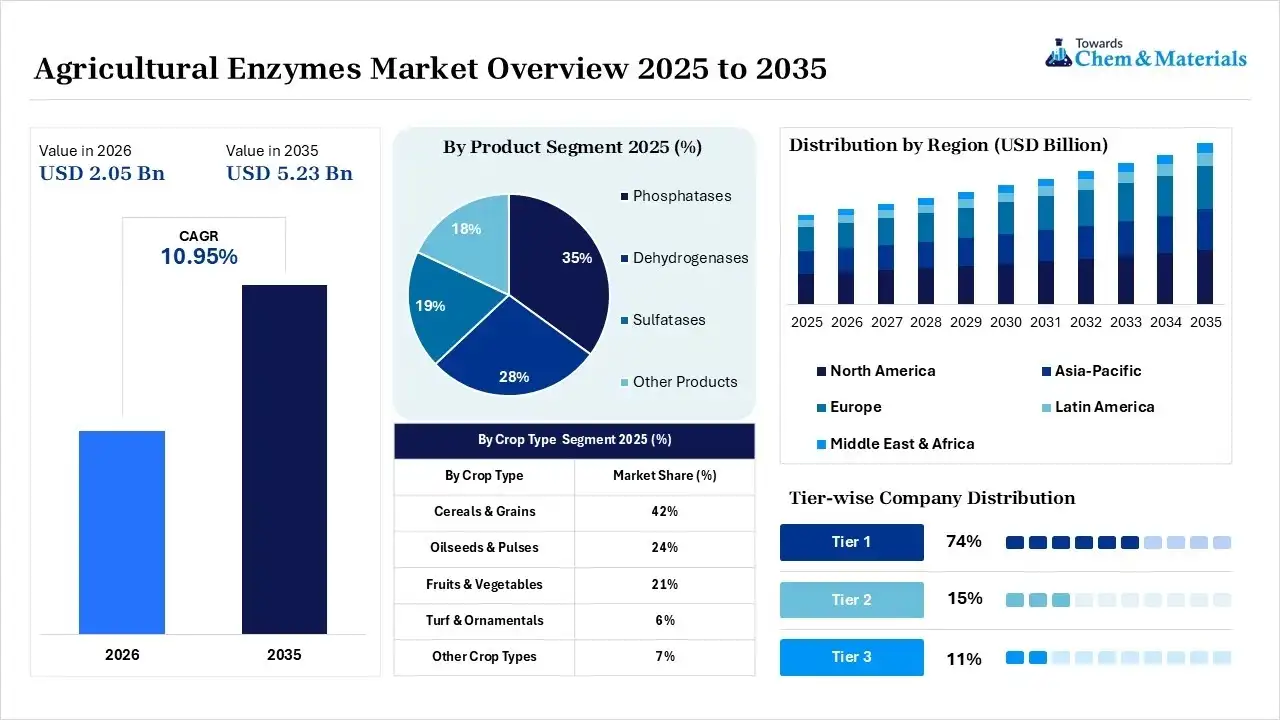
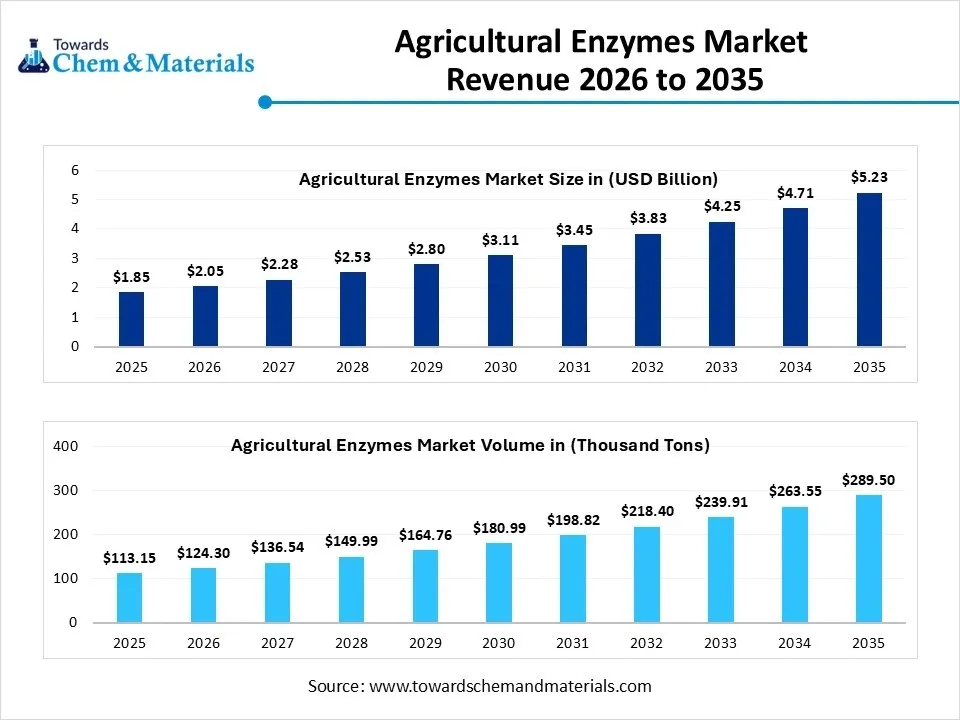
The global agricultural enzymes market size was valued at USD 1.85 billion in 2025, is estimated to reach USD 2.05 billion in 2026, and is projected to reach USD 5.23 billion by 2035, exhibiting a compound annual growth rate (CAGR) of 10.95% over the forecast period from 2026 to 2035.Asia Pacific dominated the agricultural enzymes market with the largest revenue share of 39% in 2025 and is expected to grow at the fastest CAGR of 11.14% during the forecast period. The increasing number of sustainable agriculture projects, adoption of sustainable agriculture, growing organic farming, higher demand for agro-biologicals, efficient nutrient management, and ongoing biotechnology innovation are the main factors stimulating the market. These bio-based solutions enhance soil fertility, crop productivity, water use efficiency, and synthetic fertilizer and pesticide dependency.
Market Highlights
- By region, Asia Pacific dominated the agricultural enzymes market by holding 39% share in 2025, driven by the large agricultural sector.
- By region, North America held 25% market share in 2025 and is expected to grow at the fastest with a CAGR of 11.8% during the forecast period, as the strong agri-biotechnology industry supports innovation.
- By product, the phosphatases segment dominated the market with the largest share of 35% in 2025, as it enhances nutrient uptake for crops.
- By product, the dehydrogenases segment held 28% market share in 2025 and is expected to grow at the fastest CAGR of 11.8% over the forecast period, driven by supports regenerative agriculture programs.
- By crop type, the cereals & grains segment dominated the market with the largest share of 42% in 2025, as higher yield requirements encourage biological inputs.
- By crop type, the fruits & vegetables segment held 21% market share in 2025 and is expected to grow at the fastest CAGR of 11.8% over the forecast period as organic farming expands rapidly.
- By functionality, the fertility products segment dominated the market with the largest share of 47% in 2025, as it improves soil fertility over multiple seasons.
- By functionality, the growth-enhancing products segment held 34% market share in 2025 and is expected to grow at the fastest CAGR of 11.9% over the forecast period, driven by stronger root development.
According to Towards Chemicals and Materials Analytics and Consulting, the global agricultural enzymes market volume was valued at 113.15 thousand tons in 2025 and is expected to surpass around 289.50 thousand tons by 2035, accelerating a compound annual growth rate (CAGR) of 9.85% over the forecast period from 2026 to 2035.
Market Overview
Farmers are increasingly turning to sustainable biological solutions, such as agricultural enzymes, to boost crop productivity while reducing environmental impact, driving the steady growth of the agricultural enzymes market. The enzymes like phosphatases, urethrases and dehydrogenases help to make phosphorus, nitrogen, and positive microbes available to plants, thus restoring soil fertility and enhancing crop production.
The increase of organic agriculture, the reduction of synthetic agrochemicals, and the growing world demand for food are still encouraging farmers to adopt organic agriculture. The development of new technologies such as microbial fermentation, enzyme immobilization, nanotechnology delivery systems, AI enzyme engineering, and genetically engineered microbial strains has helped to enhance enzyme stability and performance in the field.
- In October 2025, Proventus Bioscience announced the launch of LifeLore Pathways in October 2025, a new offering based on advanced bioscience, intelligent automation, and micro-fermentation technologies, helping to scale microbial innovation to sustainable enzymes, agricultural biologicals, alternative proteins, biopolymer precursors, and environmental applications in Montreal.(Source:www.proventusbioscience.com)
What Are the Key Trends Influencing the Agricultural Enzymes Market?
- The increasing adoption of precision agriculture by farmers is the major trend driving the market growth. This approach depends on the accumulation and process of data from different sources, like sensors, satellite imagery, and geographic information systems (GIS), to make firm decisions regarding crop management. This surge also impacts the agricultural enzyme demand.
- Technological advancement is another significant factor impacting market growth positively. Innovations in the production of enzymes and formulation technologies have facilitated the development of targeted and more effective enzyme products, creating a positive landscape for market expansion. Also, ongoing enhancements in enzyme stability, activity, and specificity are boosting market expansion further.
- The exponential surge in demand for food across the globe is the latest trend strengthening the market growth. This demographic pressure, climate change, and soil degradation require advanced resource efficiency. Moreover, enzymes found in livestock feed such as phytases, enhance the rapid absorption of nutrients, allowing farmers to produce milk, meat, and eggs while utilizing fewer resources.
Report Scope
| Report Attributes | Details |
| Market Size in 2026 | USD 2.05 Billion/ 124.30 Thousand Tons |
| Expected Market Size by 2035 | USD 5.23 Billion/ 289.50 Thousand Tons |
| Growth Rate from 2025 to 2035 | CAGR 10.95% |
| Base Year of Estimation | 2025 |
| Forecast Period | 2025 - 2035 |
| High Impact Region | Asia Pacific |
| Segment Covered | By Product, By Crop Type, By Functionality , By Region |
| Key Companies Profiled | AB Enzymes, Advanced Enzyme Technologies, Amano Enzymes Inc.,Antozyme Biotech Pvt Ltd., Biolaxi Enzymes Pvt Ltd., Biorizon Biotech,Creative Enzymes, Elemental Enzymes, Inc., Field International UK Limited, Grotech Production Ltd., Infinita Biotech Private Limited, Kemin Industries, Inc., Novozymes A/S |
How is the Government Supporting the Agricultural Enzymes Market?
The Indian government promotes the market by facilitating eco-friendly agricultural practices and investing heavily in bio-based technologies, to foster collaboration among different stakeholders. This support aims to minimize post-harvest losses, improve crop production, and enhance market access to promote sustainable market growth.
The BioE3 Policy introduces initiatives such as bio-foundry clusters, innovative biomanufacturing facilities, and bio-AI hubs to support the development of bio-based products and their commercialization. The policy focuses on ethical alignment and biosafety with global regulatory standards. It also emphasizes using local biomass to create jobs in tier-II and tier-III cities.
Supply Chain Analysis of the Agricultural Enzymes Market
Feedstock Procurement
- In this stage, the materials for the production of the enzyme-producing microorganisms, such as renewable sugar, starch, molasses, and agricultural biomass, are sourced as fermentation substrates.
- Corteva Agriscience: An agricultural feedstock supplier, using integrated agricultural partnerships as a basis for sourcing renewable agricultural feedstocks for biological products.
- Other Key Players: Cargill, ADM.
Chemical Synthesis and Processing:
- Agricultural enzymes with high activity and shelf life are developed by selected microbial strains after controlled fermentation at the industrial level, extraction and purification, concentration, and stabilization of the product.
- Novonesis: Developed and produced high-performance enzymes for sustainable agriculture by using advanced industrial fermentation technology.
- Other Key Players: BASF SE, AB Enzymes.
Compound Formulation and Blending
- Enzymes are purified and mixed with stabilizers, carriers, microbial inoculants, and appropriate agricultural ingredients to produce stable enzyme formulations for use in seed treatment, foliar spray, and soil application.
- Elemental Enzymes: Produces their own stabilized enzyme formulations, thereby enhancing enzyme efficacy and plant resilience.
- Other Key Players: Bayer AG, Syngenta AG.
Market Opportunity
Innovations in Biotechnological Research
Ongoing breakthroughs in biotechnology, particularly in genetic engineering and microbial fermentation have revolutionized the market by creating lucrative opportunities. These innovations have facilitated the creation of efficient, highly specific, and cost-effective enzyme formulations specific to different agricultural needs. Furthermore, Biotechnology optimizes the development of enzyme mixes specifically for crops like legumes, cereals, or fruits that are suited for distinct regions.
- In September 2024, The University of Queensland introduced an AU$45 million.ARC Centre of Excellence in Quantum Biotechnology to solve global problems in energy, health, and agriculture. The initiative involves partnering between government, industry, and five Australian universities.(Source: thequantuminsider)
Market Challenge
Competition from Synthetic Chemicals
Synthetic pesticides and fertilizers, while not eco-friendly are generally perceived as readily available and more efficient by farmers, which makes them a strong competitor to the market, hindering market expansion further. Moreover, the efficacy of agricultural enzymes mainly relies on environmental conditions like temperature, moisture levels, soil pH, and microbial activity which can constrain their overall performance.
Segmental Insight
Product Insights
The phosphatase segment led the market in 2025. The dominance of the segment can be attributed to the important role of phosphates in improving plant growth and soil fertility. These enzymes enable the breakdown of phosphorus compounds in the soil, to transform them into inorganic forms that can be easily absorbed by plants. In addition, the extensive applicability of phosphatases and their influence on crop yield can drive segment growth soon.
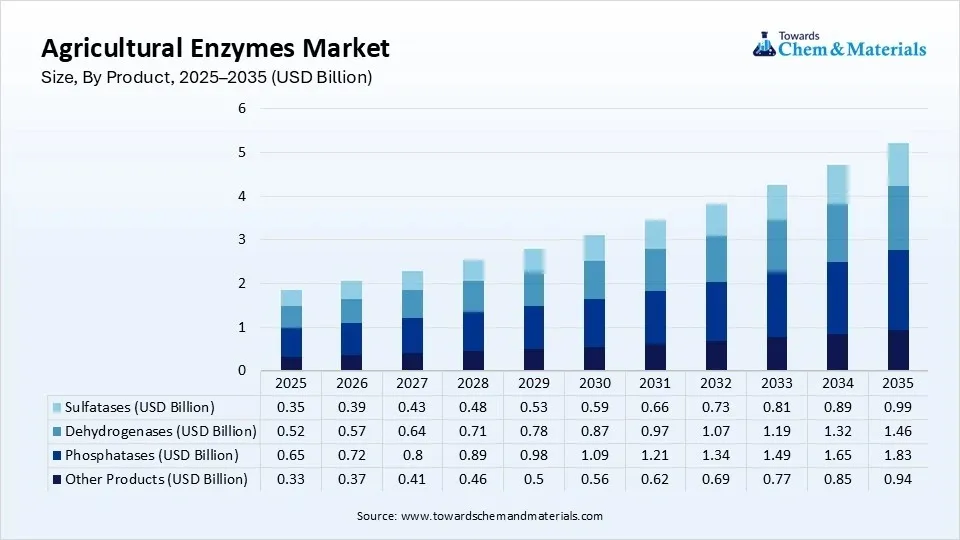
The dehydrogenase segment is expected to grow at the fastest CAGR over the forecast period over the forecast period. The growth of the segment can be linked to the increasing need for enzyme-based solutions to optimize restoration efforts and soil remediation. Moreover, dehydrogenase enzymes are crucial indicators of soil microbial activity, which is crucial for the decomposition of organic matter, soil health, and nutrient cycling.
Agricultural Enzymes Market Share, By Product, 2025(%)
| By Product | Market Share (%) |
| Phosphatases | 35% |
| Dehydrogenases | 28% |
| Sulfatases | 19% |
| Other Products | 18% |
Crop Type Insights
The cereals & grains segment dominated the market in 2025. The dominance of the segment can be credited to the increasing emphasis on eco-friendly farming practices which leads to the adoption of enzymes in grain and cereal cultivation. Additionally, enzymes utilized in grain and cereal farming improve nutrient uptake, enhance soil health, and optimize efficient growth. Products such as cellulases, glucanases, and esterases can disrupt mycotoxin production and degrade fungal cell walls, helping to tackle mycotoxin contamination.
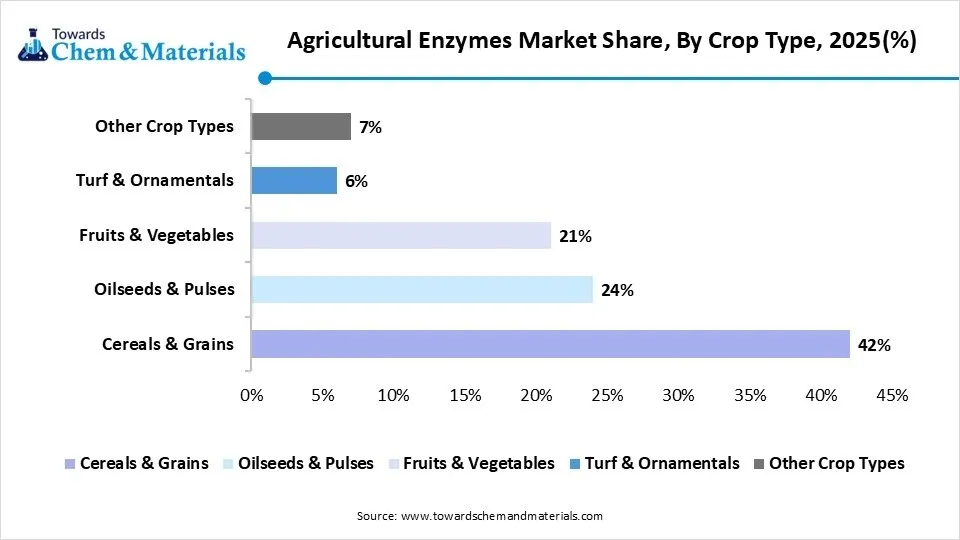
The oilseeds and pulses segment are expected to grow at the fastest CAGR over the forecast period. The growth of the segment can be driven by the increasing need for oil fuels and plant-based proteins boosts the demand for pulse production and oilseed. Furthermore, technological innovations in agricultural enzymes like the enhanced applications and development of new enzyme types are increasingly improving their effectiveness.
Agricultural Enzymes Market Share, By Crop Type, 2025(%)
| By Crop Type | Market Share (%) |
| Cereals & Grains | 42% |
| Oilseeds & Pulses | 24% |
| Fruits & Vegetables | 21% |
| Turf & Ornamentals | 6% |
| Other Crop Types | 7% |
Functionality Insights
Fertility products segment held the largest market share in 2025. The dominance of the segment is owning to the increasing adoption of soil fertility products to minimize its reliance on chemical fertilizers and enhance long-term soil quality. These products enhance nutrient availability, improve soil structure, and are rich in enzymes. The demand is especially strong in regions with extensive farming practices.
Growth growth-enhancing products segment is expected to grow at the fastest CAGR during the projected period. The growth of the segment is due to the ability of these enzymes to grow plant quality and productivity. Agricultural enzymes, particularly phosphatases help to unlock stored nutrients in the soil, which makes them easily available for plant uptake. Also, Enzymes can boost metabolic processes and photosynthesis which leads to faster plant growth.
- In June 2024, Basecamp Research, a global leader in AI-based design of proteins and biological systems, in collaboration with the Ferruz Laboratory announced the release of ZymCTRL, a ChatGPT-like tool that creates new sequences from scratch based on enzyme identification code.(Source: prnewswire)
Agricultural Enzymes Market Share, By Functionality, 2025(%)
| By Functionality | Market Share (%) |
| Fertility Products | 47% |
| Growth Enhancing Products | 34% |
| Control Products | 19% |
Regional Insights
How did the Asia Pacific dominate the Agricultural Enzymes Market in 2025?
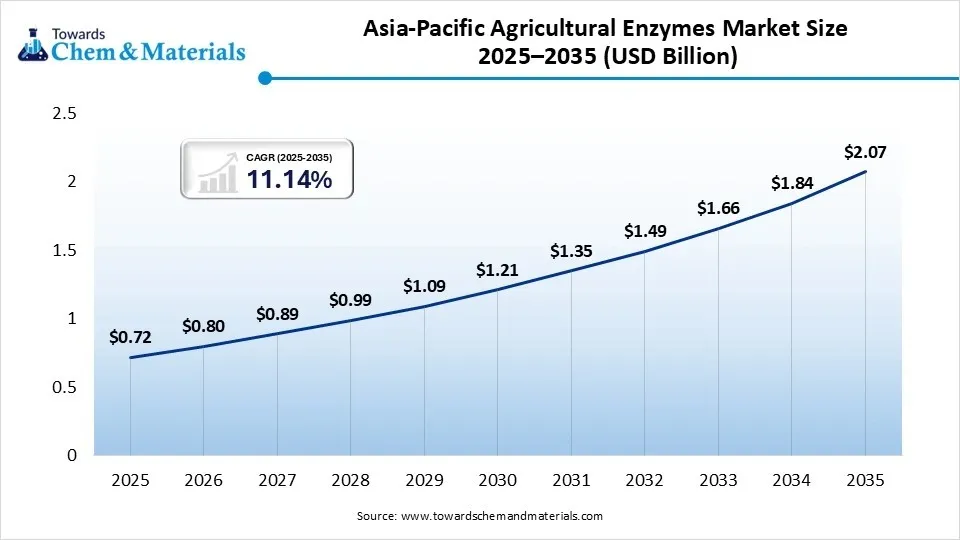
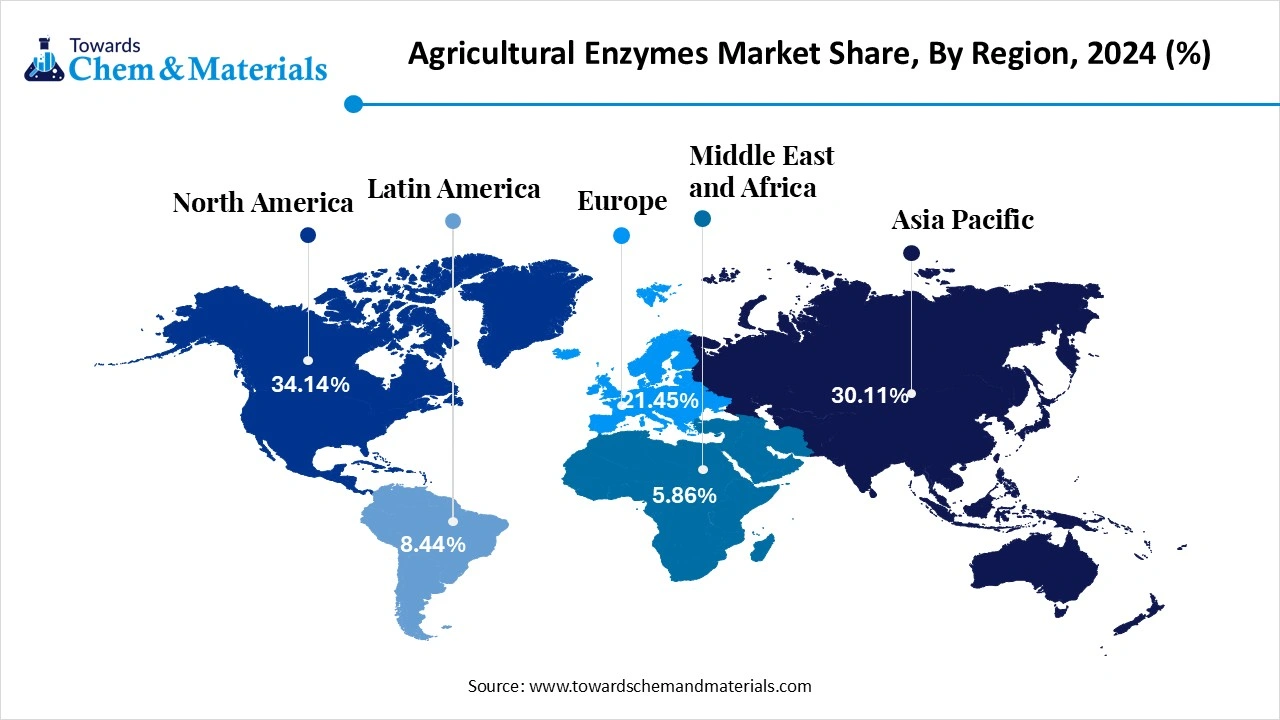
The Asia Pacific agricultural enzymes market size was estimated at USD 0.72 billion in 2025 and is projected to reach USD 2.07 billion by 2035, growing at a CAGR of 11.14% from 2026 to 2035.Asia Pacific dominated the market with the largest share of 39% in 2025, as it is the country with a large agricultural sector, with rising organic farming, along with the governments support towards sustainable agriculture. The market is expected to grow further in the region as food demand is on the rise, soil quality is on the decline, and bio-inputs are becoming more popular.
China
- Biological soil fertility solutions are in high demand due to large agricultural production.
- Sustainable farming programs encourage lower fertilizer use by the government.
- Agricultural enzyme commercialization is spurred by domestic biotechnology investment.
India
- The greater the growth of organic agriculture, the more agricultural products are used in agriculture based on enzymes.
- Government programmes for the promotion of bio-fertilizers and sustainable nutrient requirements in crops.
- The demand for enzymes is boosted by horticulture and cereal crop production.
North America held 25% market share in 2025 and is expected to grow at the fastest CAGR of 11.8% during the forecast period, resulting from greater overall adoption of biological crop protection, advanced agricultural biotechnology, and precision farming. The regions expansion in markets is further bolstered by continued investments in sustainable ag and microbial research.
United States
- Innovation and continuous changes in enzymes are enabled by the advanced biotechnology industry.
- Precision farming increases uptake of biological farm input.
- Agricultural enzymes are commercialised faster when there is strong R&D investment.
Canada
- Biological soil health products encouraged by sustainable farming policies.
- There is a positive correlation between organic farming and enzyme use.
- Biotechnology research in an agricultural field is encouraged by government funding, and advanced innovative solutions are created.
Europe held 22% market share in 2025, due to its rigorous environmental laws, high level of organic farming practices, and policies favoring sustainability in agriculture. The demand for synthetic agrochemicals has been declining while the investments in biological crop inputs continue to grow, which have been supporting regional market growth.
Germany
- Advanced agricultural enzyme solutions are developed by the strong biotechnology industry.
- Biological product demand rises due to the regulations for sustainable farming.
- There is ongoing innovation in agriculture as a result of extensive agricultural research.
France
- The expansion of organic farming results in a higher use of enzymes.
- Government supports environmentally friendly farming.
- The rising uptake of biological crop nutrition assists market growth.
Latin America held 9% market share in 2025, as sustainable farming practices gain awareness and groundswell, along with commercial agriculture and export-oriented crop production. The use of biological crop inputs has risen to boost soil fertility and agricultural productivity in the long term.
Brazil
- There is steady growth in Latin America, especially Brazil
- Enzymes are biological products that are based on the soybean crop.
- Increasing the supply of bio-inputs reinforces local supply.
- Sustainable agriculture programs promote the adoption of enzymes.
Chile
- High-value fruit farming leads to higher demand for biological inputs in the farming system.
- Sustainable agriculture technologies are encouraged through export-driven agriculture.
- Precision farming promotes efficient use of enzymes.
The Middle East & Africa held 5% market share in 2025, due to increasing water scarcity and low soil quality, along with food security issues, which are driving the adoption of sustainable agricultural technologies. In the face of challenging climatic conditions, agricultural enzymes can enhance the nutrients available, soil productivity, and crop resilience.
Saudi Arabia
- Water-efficient farming leads to more adoption of biological solutions.
- The government will encourage sustainable agriculture technologies.
- Protected agriculture is a factor that stimulates an increase in enzyme use.
South Africa
- Biological soil improvement products are adopted by commercial farming.
- The growth of horticulture is a factor that demands more enzymes from agriculture.
- Biological farming nutrition is supported by sustainable farming initiatives.
Recent Developments
- In June 2026, Elemental Enzymes and UPL unveiled a biological solution to control citrus greening (HLB) in Brazil, called Strakor®, which is based on peptides. The product gained a first in the country for being a biological product developed specifically for the control of citrus greening, alongside contributing to the sustainable production of citrus and disease management. (Source: www.global-agriculture.com)
- In May 2026, Agro 100 introduced its Pür portfolio of organic, biological fertilizers, enhancing its global business in biological agriculture. The products are capable of boosting plants natural enzyme and protein production and thereby promoting the health of crops, their ability to withstand stress, and their efficiency and sustainable productivity across a variety of farming systems. (Source: www.farms.com)
Companies List
- AB Enzymes
- Advanced Enzyme Technologies
- Amano Enzymes Inc.
- Antozyme Biotech Pvt Ltd.
- Biolaxi Enzymes Pvt Ltd.
- Biorizon Biotech
- Creative Enzymes
- Elemental Enzymes, Inc.
- Field International UK Limited
- Grotech Production Ltd.
- Infinita Biotech Private Limited
- Kemin Industries, Inc.
- Novozymes A/S
Segments Covered
By Product
- Phosphatases
- Acid Phosphatases
- Alkaline Phosphatases
- Dehydrogenases
- Oxidoreductase Dehydrogenases
- Soil Microbial Dehydrogenases
- Sulfatases
- Arylsulfatases
- Alkylsulfatases
- Other Products
- Ureases
- Proteases
- Cellulases
- Amylases
- Lipases
- Mixed Enzyme Formulations
By Crop Type
- Cereals & Grains
- Wheat
- Rice
- Corn (Maize)
- Barley
- Sorghum
- Oilseeds & Pulses
- Soybean
- Canola
- Sunflower
- Peas
- Lentils
- Fruits & Vegetables
- Fruits
- Leafy Vegetables
- Root & Tuber Crops
- Greenhouse Crops
- Turf & Ornamentals
- Turf Grass
- Ornamental Plants
- Landscaping
- Other Crop Types
- Sugar Crops
- Plantation Crops
- Fiber Crops
- Forage Crops
By Functionality
- Fertility Products
- Nutrient Mobilization
- Soil Health Improvement
- Growth Enhancing Products
- Root Development
- Plant Metabolism Enhancement
- Stress Resistance
- Control Products
- Disease Suppression
- Residue Degradation
- Biological Soil Conditioning
By Region
- North America
- U.S.
- Canada
- Europe
- Germany
- UK
- France
- Italy
- Spain
- Sweden
- Denmark
- Norway
- Asia Pacific
- China
- Japan
- India
- South Korea
- Thailand
- Latin America
- Brazil
- Mexico
- Argentina
- Middle East and Africa (MEA)
- South Africa
- UAE
- Saudi Arabia
- Kuwait
Table of Contents
Chapter 1. Methodology and Scope
1.1. Market Segmentation & Scope
1.2. Market Definition
1.3. Information Procurement
1.3.1. Purchased Database
1.3.2.TCM’s Internal Database
1.3.3. Secondary Sources & Third-Party Perspectives
1.3.4. Primary Research
1.4. Information Analysis
1.4.1. Data Analysis Models
1.5. Market Projection & Data Visualization
1.6. Data Validation & Publishing
Chapter 2. Executive Summary
2.1. Market Snapshot
2.2. Segment Snapshot
2.3. Competitive Landscape Snapshot
Chapter 3. Global Agricultural Enzymes Market Variables, Trends & Scope
3.1. Market Lineage Outlook
3.1.1. Global Enzymes Market Outlook
3.2. Industry Value Chain Analysis
3.2.1. Raw Material Trends
3.2.2. Manufacturing/ Technology Trends
3.2.3. Sales Channel Analysis
3.3. Vendor Landscape
3.3.1. List of Raw Material Suppliers
3.3.2. List of Distributors/Channel Partners
3.3.3. List of Potential End-Users
3.4. Regulatory Framework
3.5. Factors Influencing Prices
3.6. Market Dynamics
3.6.1. Market Driver Analysis
3.6.2. Market Restraint Analysis
3.6.3. Industry Challenges
3.6.4. Industry Opportunities
3.7. Industry Analysis Tools
3.7.1. Porter’s Five Forces Analysis
3.7.2. Macro-environmental Analysis
Chapter 4. Global Agricultural Enzymes Market: Product Estimates & Trend Analysis
4.1. Product Movement Analysis & Market Share, 2026 & 2035
4.2. Agricultural Enzymes Market Estimates & Forecast, By Product, 2021 - 2035
4.2.1. Phosphatases
4.2.1.1. Phosphatases Market Estimates and Forecasts, 2021 - 2035
4.2.2. Dehydrogenases
4.2.2.1. Dehydrogenases Market Estimates and Forecasts, 2021 - 2035
4.2.3. Sulfatases
4.2.3.1. Sulfatases Market Estimates and Forecasts, 2021 - 2035
4.2.4. Other Products
4.2.4.1. Other Agricultural Products Market Estimates and Forecasts, 2021 - 2035
Chapter 5. Global Agricultural Enzymes Market: Crop Type Estimates & Trend Analysis
5.1. Crop Type Movement Analysis & Market Share, 2026 & 2035
5.2. Agricultural Enzymes Market Estimates & Forecast, By Crop Type, 2021 - 2035
5.2.1. Cereals & Grains
5.2.1.1. Agricultural Enzymes Market Estimates and Forecasts, for Cereals & Grains, 2021 - 2035
5.2.2. Oilseeds & Pulses
5.2.2.1. Agricultural Enzymes Market Estimates and Forecasts, for Oilseeds & Pulses, 2021 - 2035
5.2.3. Fruits & Vegetables
5.2.3.1. Agricultural Enzymes Market Estimates and Forecasts, for Fruits & Vegetables, 2021 - 2035
5.2.4. Turf & Ornamentals
5.2.4.1. Agricultural Enzymes Market Estimates and Forecasts, for Turf & Ornamentals, 2021 - 2035
5.2.5. Other Crop Types
5.2.5.1. Agricultural Enzymes Market Estimates and Forecasts, for Other Crop Types, 2021 - 2035
Chapter 6. Global Agricultural Enzymes Market: Functionality Estimates & Trend Analysis
6.1. Functionality Movement Analysis & Market Share, 2026 & 2035
6.2. Agricultural Enzymes Market Estimates & Forecast, By Functionality, 2021 - 2035
6.2.1. Fertility Products
6.2.1.1. Agricultural Fertility Products Market Estimates and Forecasts, 2021 - 2035
6.2.2. Growth Enhancing Products
6.2.2.1. Agricultural Growth Enhancing Products Market Estimates and Forecasts, 2021 - 2035
6.2.3. Control Products
6.2.3.1. Agricultural Control Products Market Estimates and Forecasts, 2021 - 2035
Chapter 7. Global Agricultural Enzymes Market: Region Estimates & Trend Analysis
7.1. Region Movement Analysis & Market Share, 2026 & 2035
7.2. North America
7.2.1. North America Agricultural Enzymes Estimates & Forecast, 2021 - 2035
7.2.2. U.S.
7.2.2.1. U.S. Agricultural Enzymes Market Estimates & Forecast, 2021 - 2035
7.2.3. Canada
7.2.3.1. Canada Agricultural Enzymes Market Estimates & Forecast, 2021 - 2035
7.2.4. Mexico
7.2.4.1. Mexico Agricultural Enzymes Market Estimates & Forecast, 2021 - 2035
7.3. Europe
7.3.1. Europe Agricultural Enzymes Market Estimates & Forecast, 2021 - 2035
7.3.2. Germany
7.3.2.1. Germany Agricultural Enzymes Market Estimates & Forecast, 2021 - 2035
7.3.3. UK
7.3.3.1. UK Agricultural Enzymes Market Estimates & Forecast, 2021 - 2035
7.3.4. France
7.3.4.1. France Agricultural Enzymes Market Estimates & Forecast, 2021 - 2035
7.3.5. Italy
7.3.5.1. Italy Agricultural Enzymes Market Estimates & Forecast, 2021 - 2035
7.3.6. Spain
7.3.6.1. Spain Agricultural Enzymes Market Estimates & Forecast, 2021 - 2035
7.3.7. Russia
7.3.7.1. Russia Agricultural Enzymes Market Estimates & Forecast, 2021 - 2035
7.4. Asia Pacific
7.4.1. Asia Pacific Agricultural Enzymes Market Estimates & Forecast, 2021 - 2035
7.4.2. China
7.4.2.1. China Agricultural Enzymes Market Estimates & Forecast, 2021 - 2035
7.4.3. India
7.4.3.1. India Agricultural Enzymes Market Estimates & Forecast, 2021 - 2035
7.4.4. Japan
7.4.4.1. Japan Agricultural Enzymes Market Estimates & Forecast, 2021 - 2035
7.4.5. South Korea
7.4.5.1. South Korea Agricultural Enzymes Market Estimates & Forecast, 2021 - 2035
7.5. Central & South America
7.5.1. Central & South America Agricultural Enzymes Market Estimates & Forecast, 2021 - 2035
7.5.2. Brazil
7.5.2.1. Brazil Agricultural Enzymes Market Estimates & Forecast, 2021 - 2035
7.5.3. Argentina
7.5.3.1. Argentina Agricultural Enzymes Market Estimates & Forecast, 2021 - 2035
7.6. Middle East & Africa
7.6.1. Middle East & Africa Agricultural Enzymes Market Estimates & Forecast, 2021 - 2035
7.6.2. Saudi Arabia
7.6.2.1. Saudi Arabia Agricultural Enzymes Market Estimates & Forecast, 2021 - 2035
7.6.3. South Africa
7.6.3.1. South Africa Agricultural Enzymes Market Estimates & Forecast, 2021 - 2035
Chapter 8. Global Agricultural Enzymes Market - Competitive Landscape
8.1. Recent Developments & Impact Analysis, By Key Market Participants
8.2. Company Categorization
8.3. Company Market Share Analysis, 2023 (%)
8.4. Company Heat Map Analysis
8.5. Strategy Mapping
8.6. Company Profiles (Business Overview, Financial Performance, Product Benchmarking)
8.6.1. AB Enzymes
8.6.2. Advanced Enzyme Technologies
8.6.3. Amano Enzymes Inc.
8.6.4. Antozyme Biotech Pvt Ltd.
8.6.5. Biolaxi Enzymes Pvt Ltd.
8.6.6. Biorizon Biotech
8.6.7. Creative Enzymes
8.6.8. Elemental Enzymes, Inc.
8.6.9. Field International UK Limited
8.6.10. Grotech Production Ltd
8.6.11. Infinita Biotech Private Limited
8.6.12. Kemin Industries, Inc.
8.6.13. Novozymes A/S
A Seven-Phase Framework
Our methodology is designed to be universally applicable across commodity chemicals, specialty chemicals, petrochemicals, construction chemicals, coatings, electronic chemicals, industrial gases, agrochemicals, water treatment chemicals, and performance materials. Each phase builds upon the last, creating a layered validation structure that minimizes estimation error and maximizes analytical confidence.
The framework ensures comprehensive market coverage, robust cross-validation, and reliable long-term forecasting — producing market estimates that withstand scrutiny from investors, regulators, and corporate strategy teams.

Seven-Phase Framework — Analytical Effort Distribution
Relative analytical effort allocated across each phase of the Chemicals & Materials research framework

Phase 1 - Secondary Research: Establishing the Foundation
Secondary research collects and evaluates publicly available information from authoritative sources, establishing the foundational understanding of market structure, value chain dynamics, competitive landscape, and end-use demand patterns. Every source is evaluated for credibility, recency, geographic relevance, and methodological soundness before inclusion.
Industry Associations
Sources include ACC, CEFIC, ICCA, JCIA, CPCIF, and SOCMA providing production volumes, consumption trends, capacity developments, and sustainability initiatives.
Company Disclosures
Annual reports, investor presentations, earnings transcripts, and regulatory filings reveal product portfolios, manufacturing footprints, capacity expansions, and revenue segmentation.
Government Databases
National statistical offices, customs authorities, environmental agencies, and industrial production databases provide verified statistics on output, trade flows, and regulatory compliance.
Trade Databases
UN Comtrade, ITC, Eurostat, and national customs authorities enable assessment of global product movement, import dependency, and export competitiveness across regions.
Our Secondary Research Sources
- Ministry of Chemicals and Fertilizers
- European Chemicals Agency
- United States Department of Energy
- Ministry of Industry and Information Technology
- Ministry of Economy Trade and Industry
- Ministry of Trade Industry and Energy
- National Institute of Standards and Technology
- Council of Scientific and Industrial Research
- Fraunhofer Society
- National Institute for Materials Science
Phase 2 — Supply-Side Assessment: Mapping Production Capabilities
Production Capacity Analysis
All major manufacturers are assessed for existing installed capacity, planned additions, expansions, new plant announcements, and technology adoption — mapped at global, regional, and country levels.
Capacity Utilization Adjustment
Installed capacity is adjusted using utilization rates based on demand conditions, feedstock availability, plant operating rates, maintenance schedules, and regulatory restrictions.
Manufacturer Revenue Analysis
Product-specific revenues, segment-level performance, regional distribution, average selling prices, and margin trends are evaluated to establish market value estimates.
Supply-Side Assessment — Capacity vs. Effective Production by Region
Illustrative comparison of installed capacity vs. effective production volume (after utilization rate adjustment) across major regions

Phase 3 — Demand-Side Assessment: Quantifying Chemical Consumption
Demand-side analysis quantifies chemical consumption across industries, applications, and geographies — identifying where and how chemicals are consumed throughout the value chain with precision.
End-Use Industry Analysis
Chemical demand is evaluated across automotive, construction, packaging, electronics, agriculture, healthcare, consumer goods, industrial manufacturing, energy and utilities, and water treatment. Industry output, production trends, and consumption intensity are analyzed to determine demand patterns.
Consumption Modeling
Demand is estimated using measurable indicators: kilograms per vehicle, kilograms per square meter of construction, dosage per cubic meter of water treated, kilograms per hectare of agricultural land, and kilograms per ton of manufactured products. Consumption factors are validated through industry publications and primary interviews.
Application Analysis
The market is segmented by application area to understand product performance requirements, formulation trends, technology adoption, customer preferences, and regulatory requirements improving demand accuracy and segmentation granularity.
Demand-Side Assessment — End-Use Industry Demand Distribution
Illustrative distribution of chemical & materials demand across key end-use industries

Phase 4 - Trade Flow Analysis: Balancing Regional Supply and Demand
Trade flow analysis reconciles regional supply and demand estimates through import and export data, identifying net supply positions, regional dependencies, and market imbalances. It serves as an independent validation layer that tests the consistency of supply-side and demand-side estimates.
Import Analysis
Import data is evaluated to determine volumes, source countries, product dependency, regional supply gaps, and pricing trends — identifying markets that rely heavily on external supply and where domestic production is insufficient to meet demand.
Export Analysis
Export assessments reveal production surplus, export competitiveness, regional manufacturing strength, and global market participation. Export patterns also help validate domestic production estimates and identify net exporting regions.
Apparent Consumption Model
Regional consumption is assessed using the standard apparent consumption formula:
Results identify net importing regions, net exporting regions, regional deficits, and surpluses — serving as an independent validation of supply and demand estimates.
Trade Flow Analysis — Net Supply Position by Region
Illustrative apparent consumption vs. domestic production across major regions — positive gap indicates net import dependency

Phase 5 — Primary Research: The Critical Validation Layer
Primary research tests and refines findings from secondary research through direct engagement with industry participants across the supply chain, demand side, and expert community. It captures intelligence that no database or published report can provide — the real-world experience of manufacturers, buyers, and specialists operating in the market.

Supply-Side Interviews
Conversations with chemical manufacturers, raw material suppliers, contract manufacturers, technology providers, and plant operators cover production trends, capacity utilization, pricing developments, technology shifts, and competitive dynamics.

Demand-Side Interviews
Engagement with OEMs, industrial consumers, procurement managers, distributors, formulators, and end-use manufacturers focuses on consumption trends, purchasing behavior, product substitution, demand outlook, and emerging applications.

Industry Expert Consultations
Additional interviews with industry consultants, independent experts, regulatory specialists, technical professionals, and research institutions provide deeper market context and validate key analytical assumptions.
Focus Areas of Primary Research:
Market Size & Forecast Validation
Revenue estimates, volume consumption, growth rates, forecast assumptions, regional demand.Supply Chain & Value Chain Assessment
Raw material sourcing, supply chain challenges, distribution networks, procurement practices.Production & Capacity Analysis
Manufacturing capacity, utilization rates, expansion projects, plant investments.Pricing & Cost Structure Analysis
Product pricing trends, feedstock costs, energy costs, margin pressures, pricing outlook.Competitive Landscape Assessment
Volume and value estimates confirmed to be fully consistent with one another before publicationInterview Volume by Market Scope
| Study Scope | Number of Interviews |
|---|---|
| Niche Market | 20 – 30 |
| Mid-Sized Market | 30 – 50 |
| Global Market | 50 – 80 |
| Highly Fragmented Market | 80 – 120 |
Interview Details:
Category : Manufacturers, Suppliers, Distributors, End Users, Experts/Associations
Average Duration : 30–60 Minutes
Interview Mode : Video calls, telephonic interviews, expert consultations
Interview Format : Structured / Semi-Structured questionnaire
Focus Areas of Primary Research:
Market Size & Forecast Validation :
Revenue estimates, volume consumption, growth rates, forecast assumptions, regional demand.
Supply Chain & Value Chain Assessment :
Raw material sourcing, supply chain challenges, distribution networks, procurement practices.
Production & Capacity Analysis :
Manufacturing capacity, utilization rates, expansion projects, plant investments.
Pricing & Cost Structure Analysis :
Product pricing trends, feedstock costs, energy costs, margin pressures, pricing outlook.
Competitive Landscape Assessment :
Market share, competitor positioning, strategic initiatives, partnerships, acquisitions.
Primary Research — Stakeholder Coverage by Category
Distribution of interview respondents across stakeholder categories (% share from PPT data)

Primary Research — Respondent Designation Profile
Seniority breakdown of interview respondents (% share from PPT data)

Primary Research — Geographic Coverage of Interviews
Regional distribution of primary research engagement (% share from PPT data)

Phase 6 — Data Triangulation and Market Validation
No single methodology is relied upon in isolation. Multiple independent estimation approaches are combined and reconciled to ensure consistency, accuracy, and analytical defensibility. Any material deviations between approaches are investigated and adjusted through additional validation cycles.
The final market size is derived through weighted triangulation of all validated methodologies. Any material deviations between approaches are investigated and adjusted through additional validation cycles. The outcome represents the most realistic assessment of the market based on available evidence and expert confirmation ensuring that volume and value estimates are fully consistent with one another.
Triangulation Framework — Input Contribution Weight
Relative weight each sizing input contributes to the final reconciled market estimate

Phase 7 — Forecast Modeling: Projecting Future Market Evolution
Forecasting evaluates the future trajectory of the market using a combination of quantitative indicators and qualitative assessments across economic, industry, and regulatory dimensions. Rather than simple extrapolation, each driver is independently modeled and integrated into a composite forecast.
Macroeconomic Indicators
GDP growth, industrial production, manufacturing output, construction activity, consumer spending, and capital investment form the quantitative foundation of long-term demand projections. These are applied at country, regional, and global levels.
Industry Growth Drivers
Urbanization, infrastructure development, industrialization, technological innovation, sustainability initiatives, and evolving product performance requirements are assessed at regional and industry levels — capturing both structural and cyclical demand drivers.
Capacity Expansion Analysis
Announced plant expansions, new manufacturing facilities, technology upgrades, and strategic investments are evaluated to determine future supply-demand dynamics and potential market tightness or oversupply situations.
Regulatory & Sustainability
Environmental regulations, chemical safety standards, emission reduction targets, circular economy initiatives, and sustainability requirements are incorporated as they often influence product adoption rates and market growth trajectories.
Scenario Forecast Range — Indexed Market Growth (Year 1–10)
Illustrative indexed growth trajectories across Base, Optimistic, and Pessimistic scenarios over a 10-year forecast horizon

Forecast Drivers — Relative Impact Score by Category
Impact score (0–100) of each driver type on chemicals & materials market forecast




Comments
Share your thoughts, ask a question, or provide feedback about this report.