Research Methodology Overview
Healthcare industry markets require a fundamentally different analytical framework from pharmaceutical markets. Demand here is driven not by patient treatment protocols, but by infrastructure utilization — testing activity, procedure volumes, installed equipment, and technology adoption cycles. Our methodology is built around these realities, integrating eight independent research streams before any market estimate is produced.
Final market estimates are published only after all independent methodologies are reconciled and validated against primary research and healthcare infrastructure data.
8-Stage Healthcare Research Methodology Framework
Sequential process — each stage is independently executed before reconciliation and final publication
Pharmaceutical Research Methodology — Key Takeaways
A seven-phase end-to-end framework from secondary research through forecast modeling.
Universally applicable across commodity chemicals, specialty chemicals, petrochemicals, coatings, electronic chemicals, industrial gases, agrochemicals, and performance materials.
Supply-side formula: Effective Production Volume = Installed Capacity × Capacity Utilization Rate.
Demand quantified using measurable consumption indicators: kg/vehicle, kg/m², dosage/m³, kg/hectare, and kg/ton of manufactured product.
Trade flow validation via the Apparent Consumption formula: [Domestic Production + Imports] − Exports.
Primary research spans 20–120 interviews depending on market scope, with 30–60 minute sessions via video, telephonic, or expert consultations.
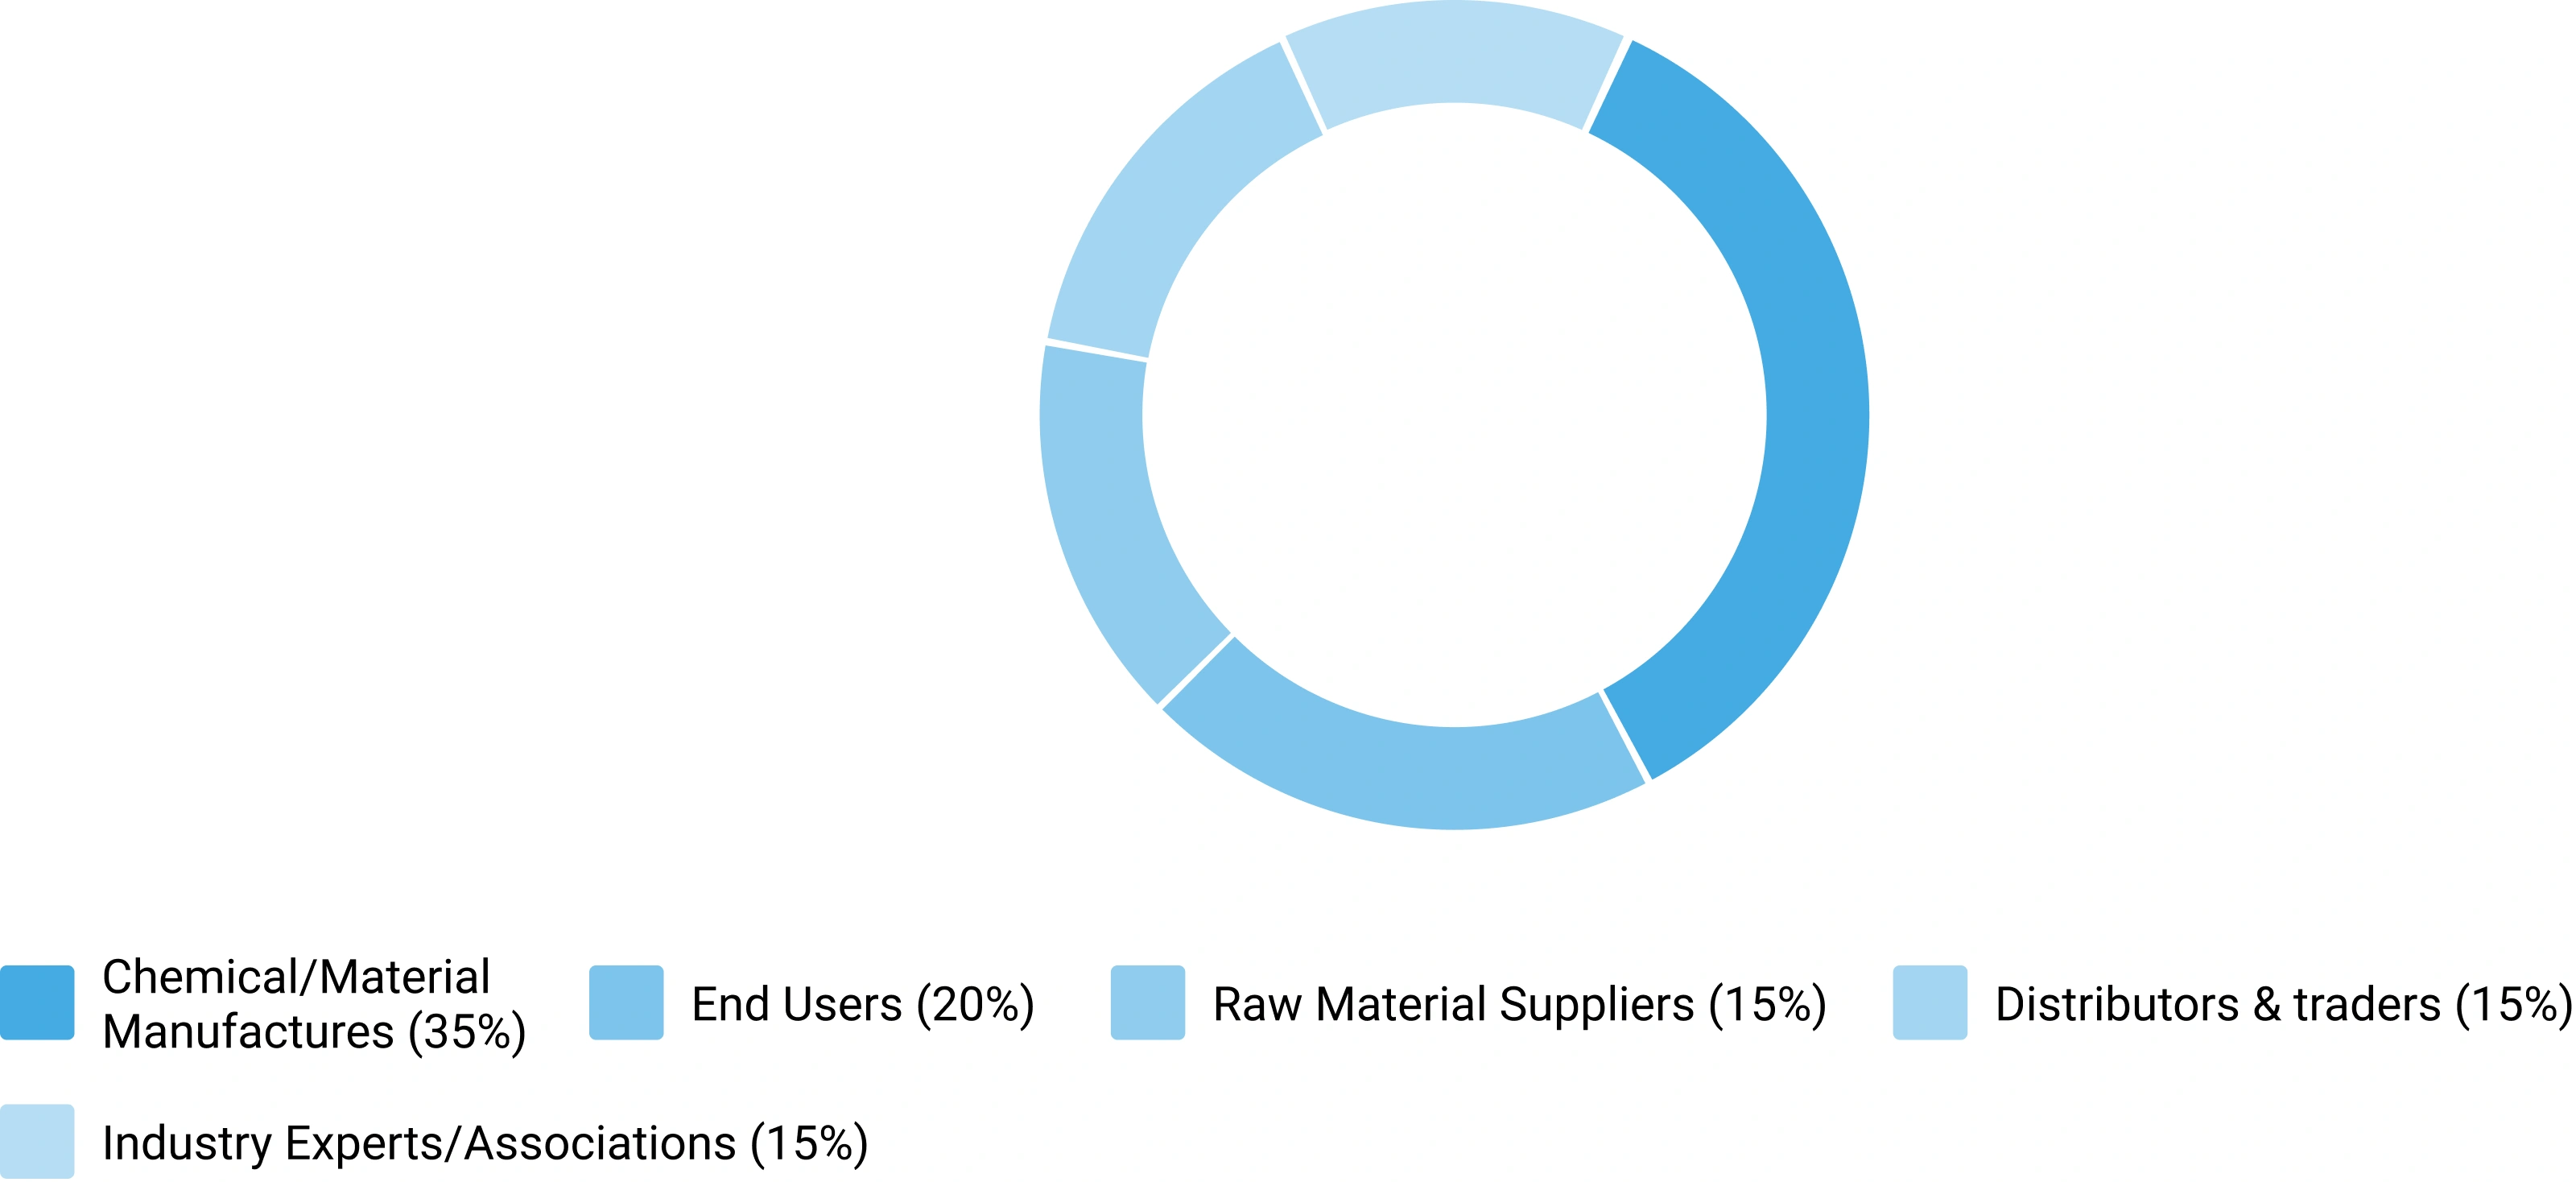
Five stakeholder categories covered: Manufacturers (35%), End Users (20%), Raw Material Suppliers (15%), Distributors & Traders (15%), and Industry Experts (15%).
Final revenue derived through weighted triangulation: Revenue = Volume × Average Selling Price (ASP), benchmarked across all methods.
Phase 1 — Secondary Research: Establishing the Foundation
Secondary research collects and evaluates publicly available information from authoritative sources, establishing the foundational understanding of market structure, value chain dynamics, competitive landscape, and end-use demand patterns. Every source is evaluated for credibility, recency, geographic relevance, and methodological soundness before inclusion.
Industry Associations
Sources include ACC, CEFIC, ICCA, JCIA, CPCIF, and SOCMA providing production volumes, consumption trends, capacity developments, and sustainability initiatives.
Company Disclosures
Annual reports, investor presentations, earnings transcripts, and regulatory filings reveal product portfolios, manufacturing footprints, capacity expansions, and revenue segmentation.
Government Databases
National statistical offices, customs authorities, environmental agencies, and industrial production databases provide verified statistics on output, trade flows, and regulatory compliance.
Trade Databases
UN Comtrade, ITC, Eurostat, and national customs authorities enable assessment of global product movement, import dependency, and export competitiveness across regions.
Our Secondary Research Sources
- Ministry of Chemicals and Fertilizers
- European Chemicals Agency
- United States Department of Energy
- Ministry of Industry and Information Technology
- Ministry of Economy Trade and Industry
- Ministry of Trade Industry and Energy
- National Institute of Standards and Technology
- Council of Scientific and Industrial Research
- Fraunhofer Society
- National Institute for Materials Science
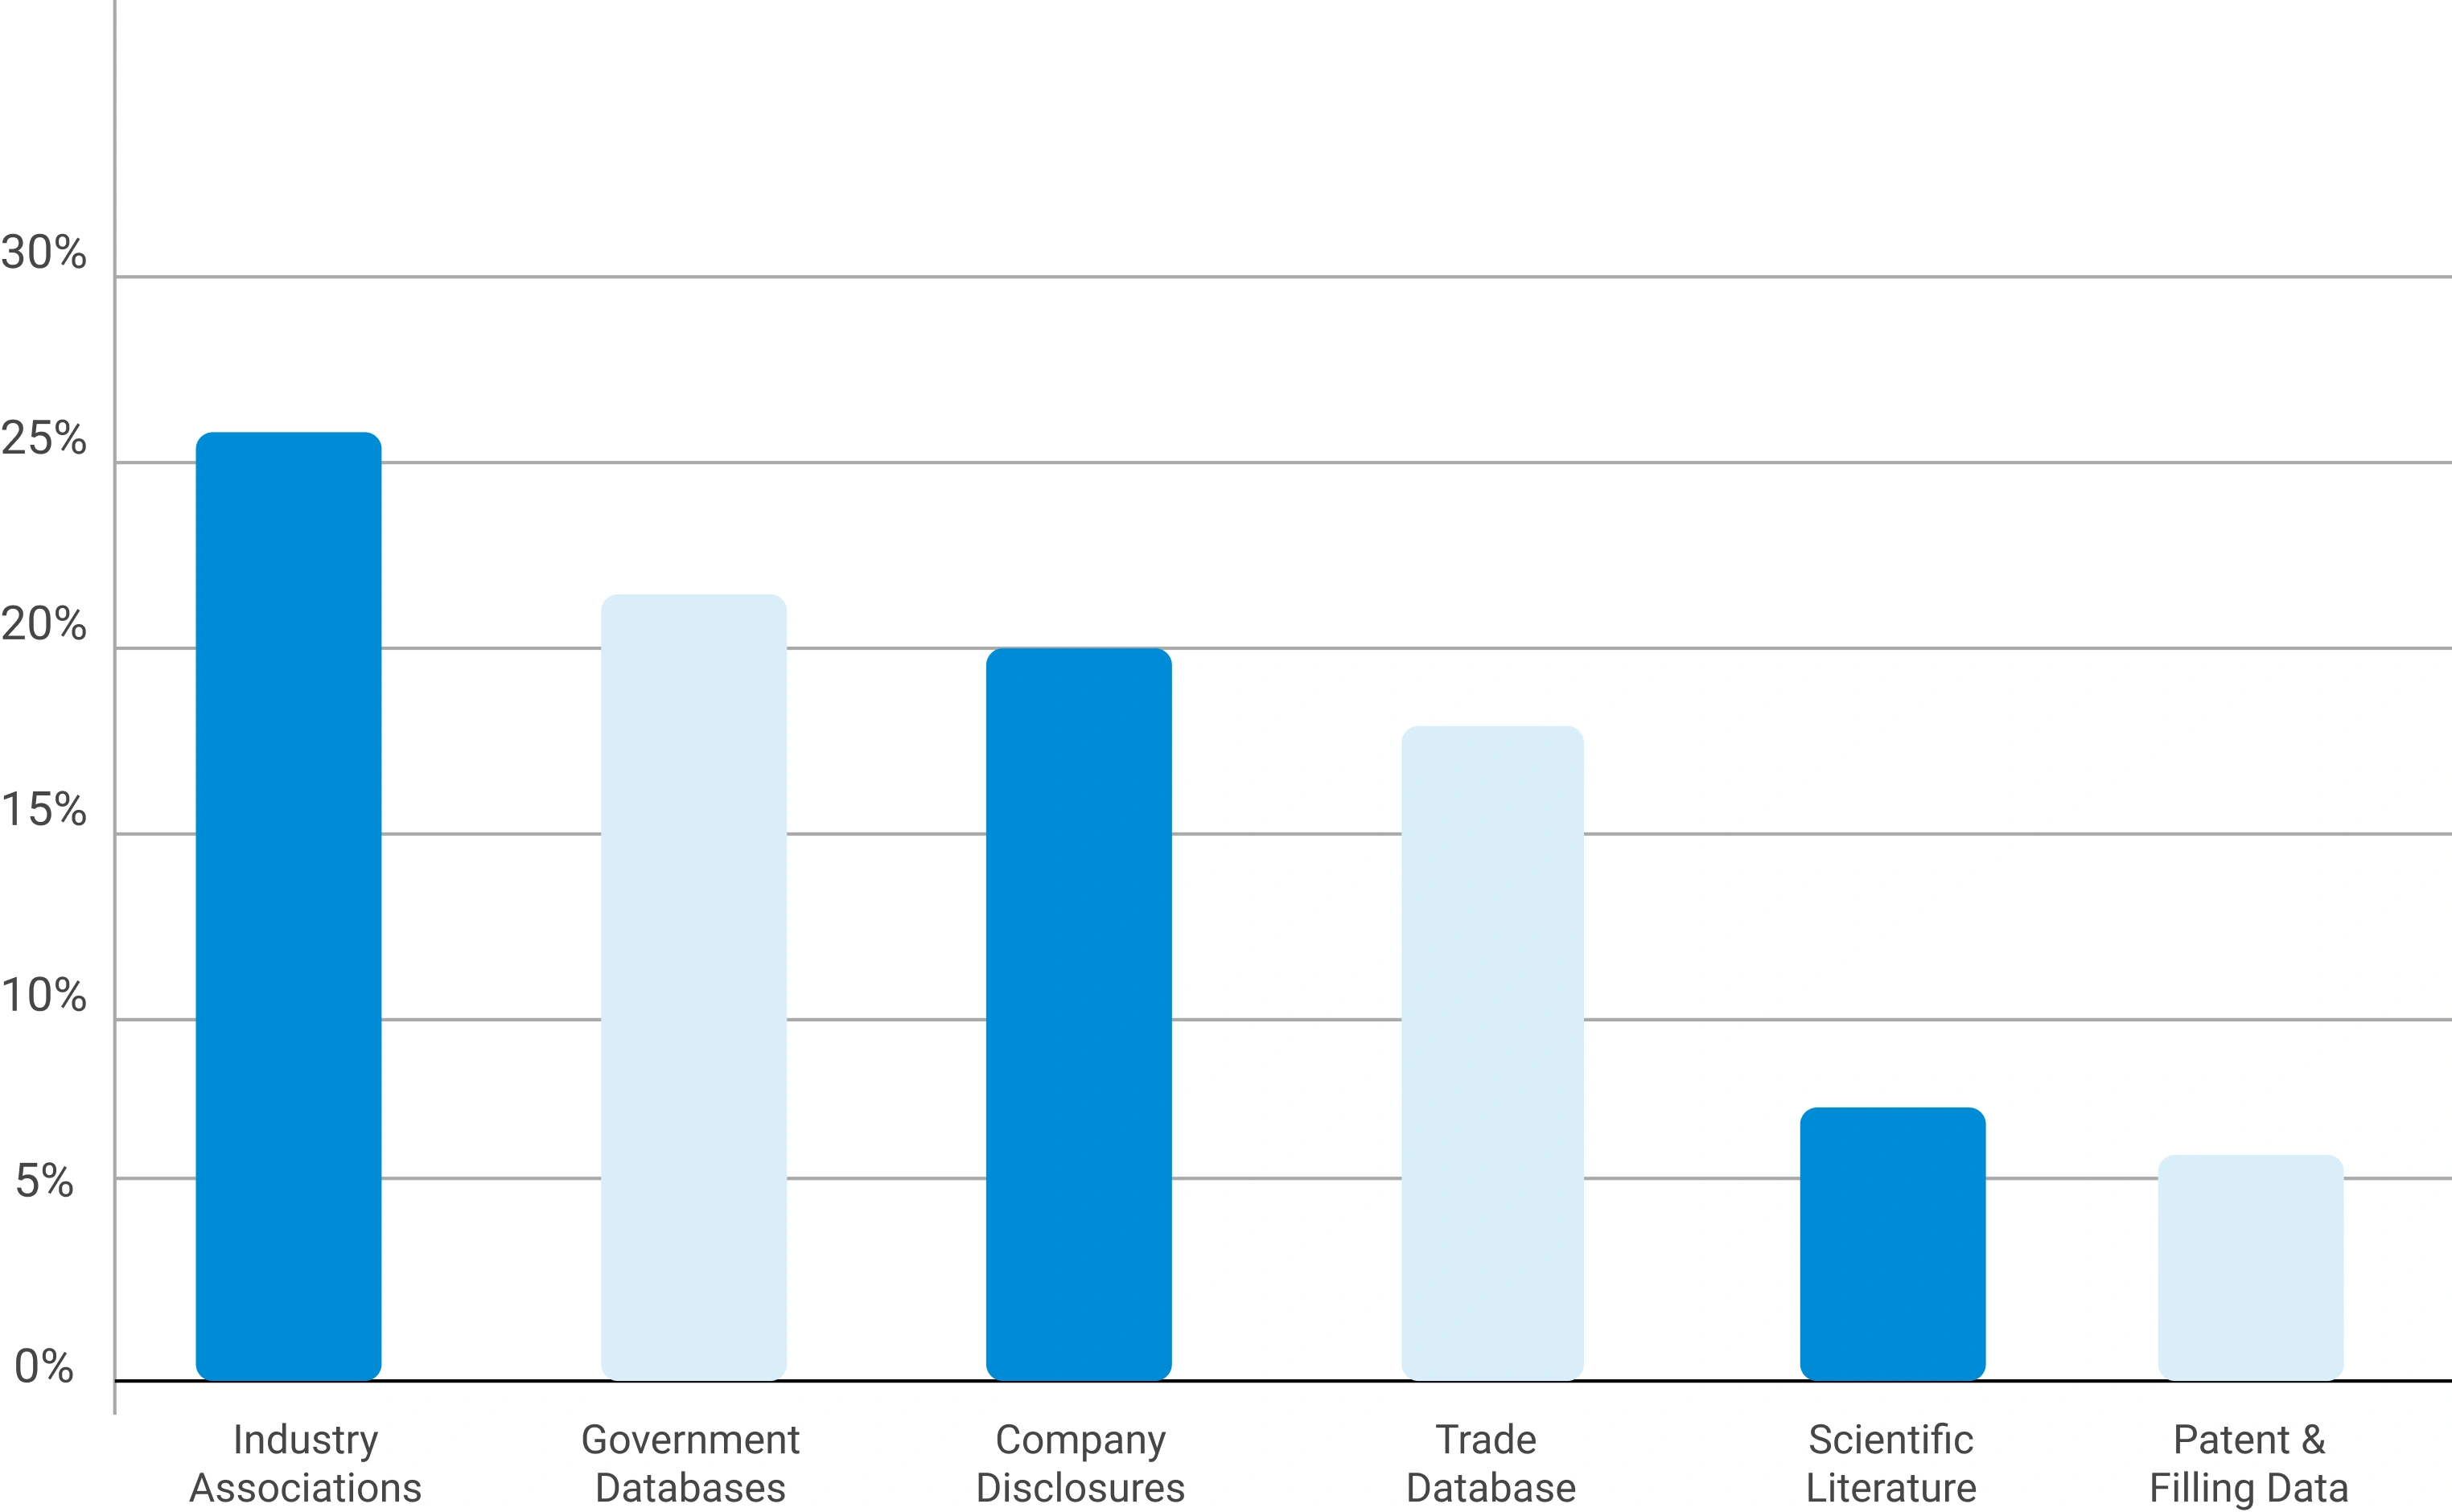
Secondary Research — Data Source Coverage Weight
Relative coverage weight assigned to each source category during secondary research
Phase 2 — Supply-Side Assessment: Mapping Production Capabilities
Production Capacity Analysis
All major manufacturers are assessed for existing installed capacity, planned additions, expansions, new plant announcements, and technology adoption – mapped at global, regional, and country levels to build a complete supply landscape.
Capacity Utilization Adjustment
Installed capacity is adjusted using utilization rates based on demand conditions, feedstock availability, plant operating rates, maintenance schedules, and regulatory restrictions to derive effective production volumes.
Manufacturer Revenue Analysis
Product-specific revenues, segment-level performance, regional distribution, average selling prices, and margin trends are evaluated to establish market value estimates from the supply side.
Geographic Mapping
Production capabilities are mapped across all major manufacturing geographies – including Asia-Pacific, Europe, North America, and emerging chemical hubs – to identify regional supply concentration and capacity gaps.
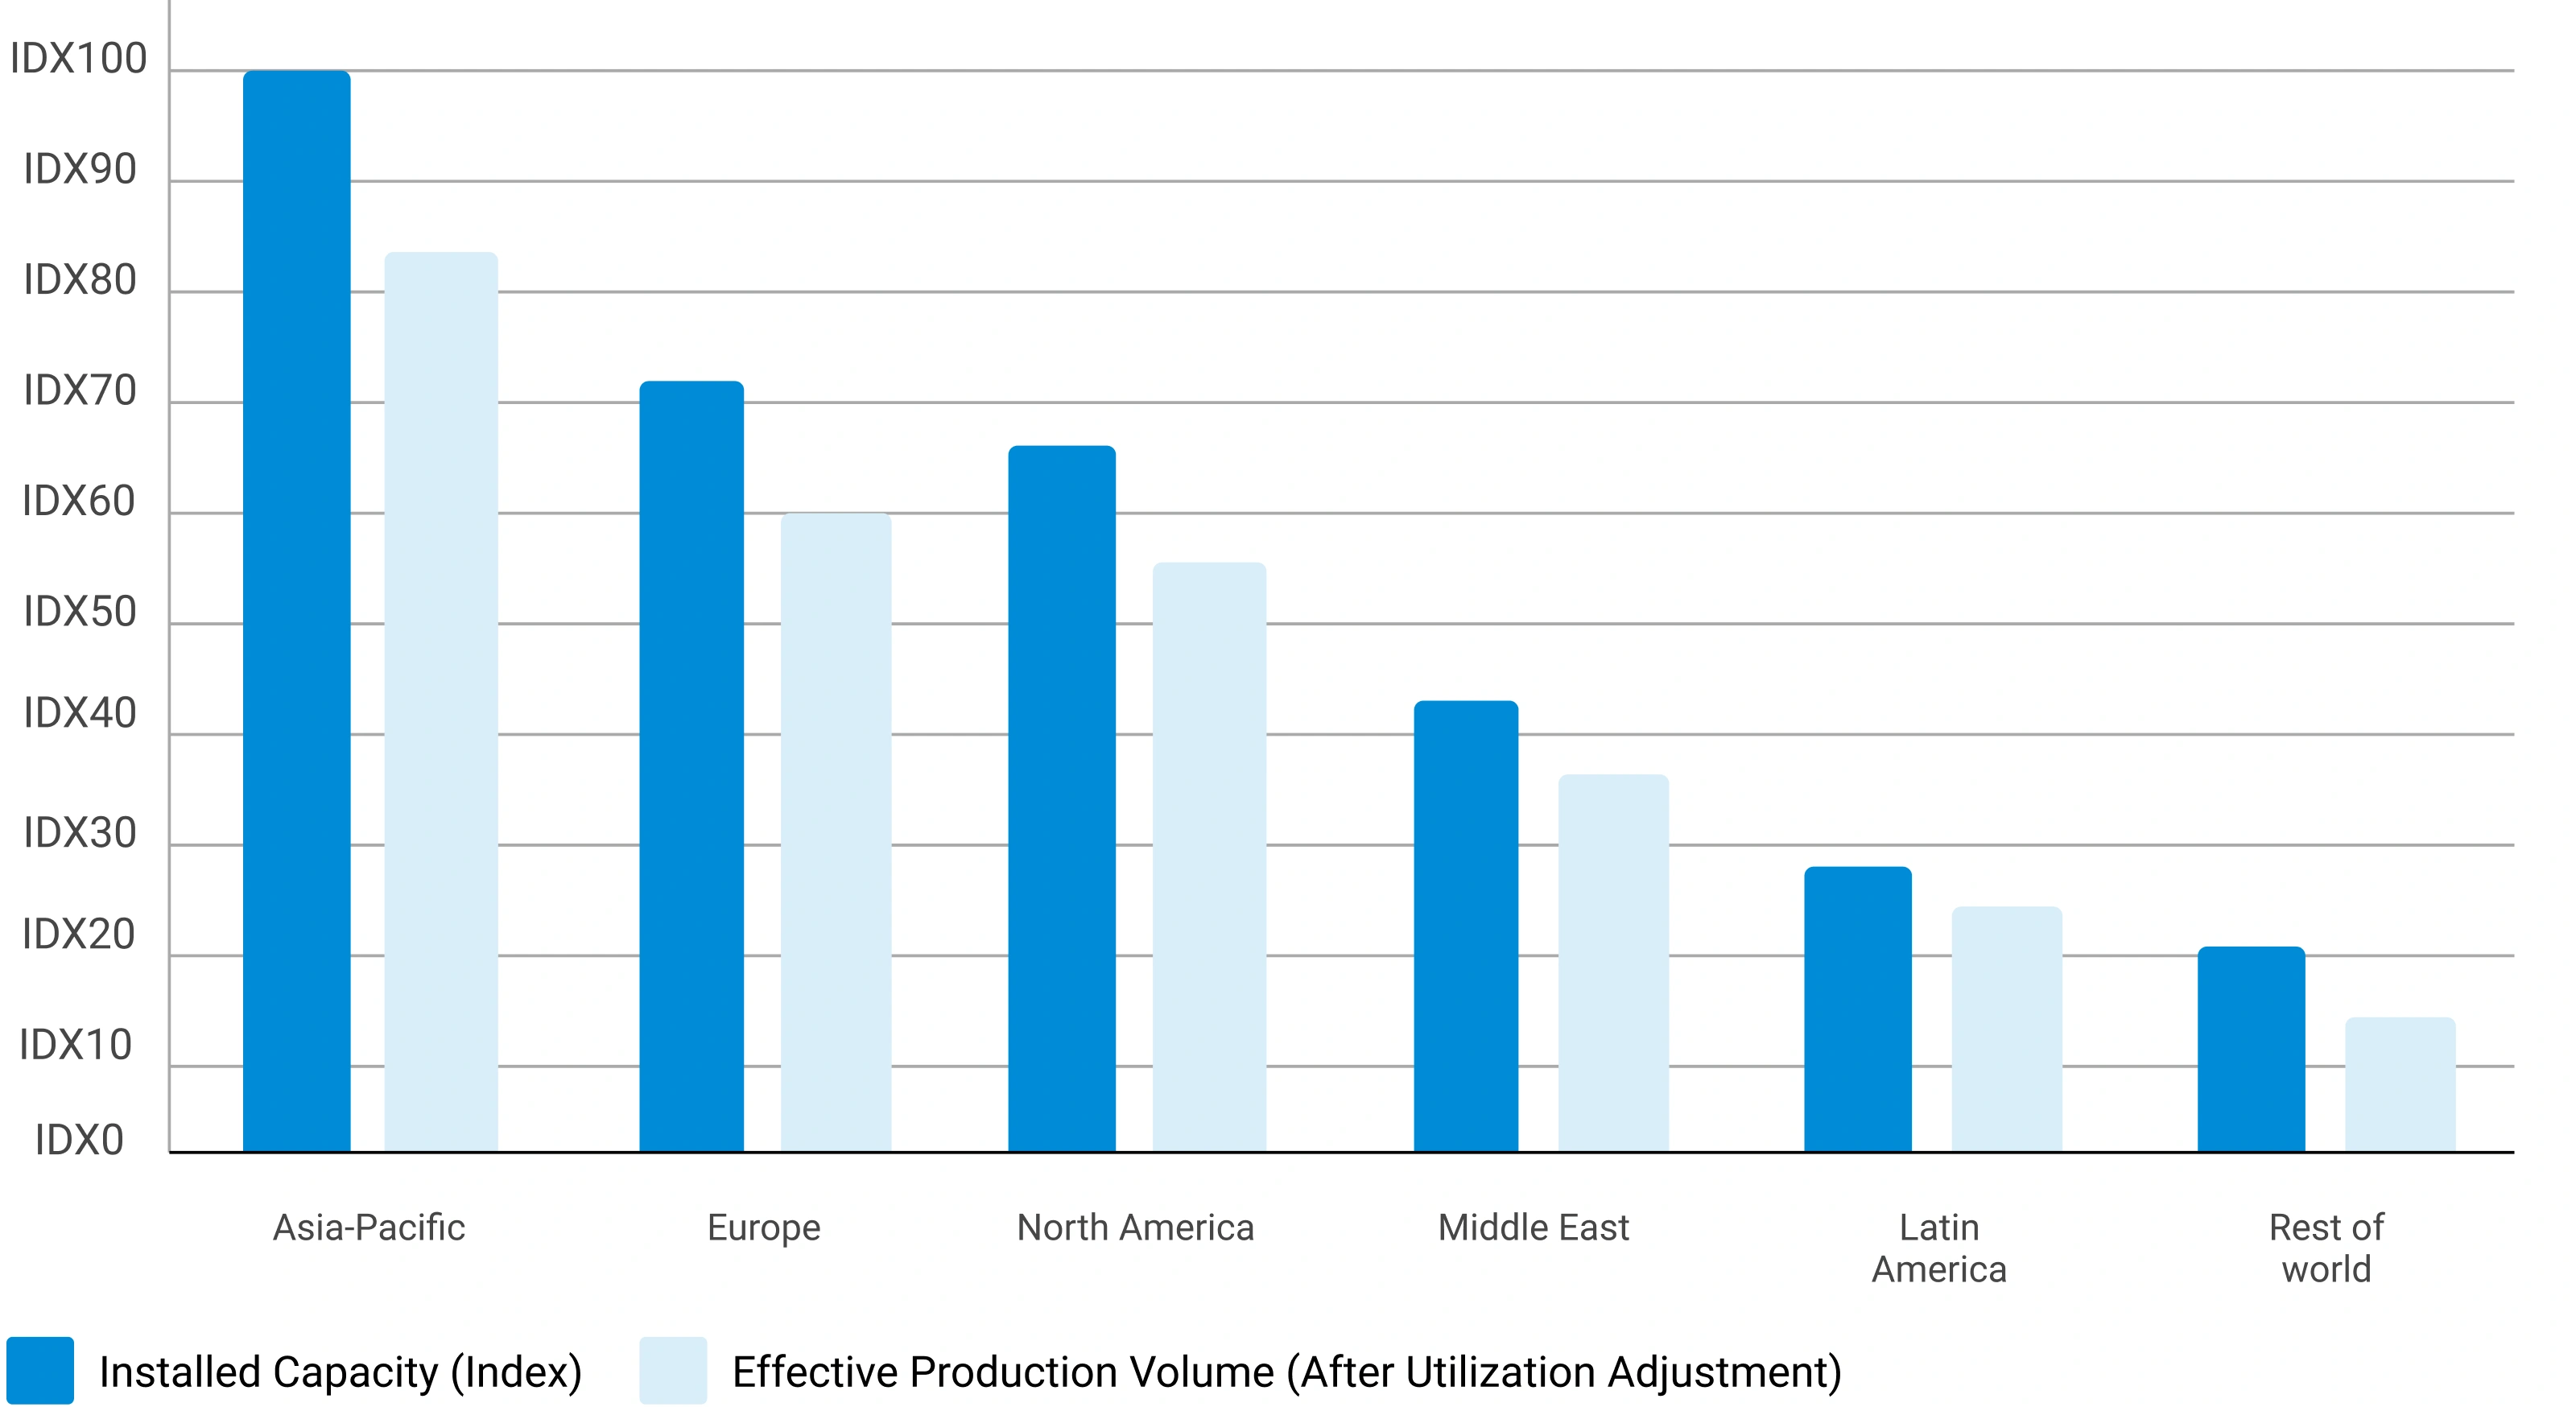
Supply-Side Assessment — Capacity vs. Effective Production by Region
Illustrative comparison of installed capacity vs. effective production volume (after utilization rate adjustment) across major regions
Phase 3 — Demand-Side Assessment: Quantifying Chemical Consumption
Demand-side analysis quantifies chemical consumption across industries, applications, and geographies — identifying where and how chemicals are consumed throughout the value chain with precision.
End-Use Industry Analysis
Chemical demand is evaluated across:automotive, construction, packaging, electronics, agriculture, healthcare, consumer goods, industrial manufacturing, energy and utilities, and water treatment.Industry output, production trends, and consumption intensity are analyzed to determine demand patterns for each end-use sector.
Consumption Modeling
Demand is estimated using measurable physical consumption indicators validated through industry publications and primary interviews:
AUTOMOTIVE
Kilograms per vehicle — Chemical content per unit of production, applied to vehicle output data across key manufacturing geographies.
CONSTRUCTION
Kilograms per square meter — Application intensity per unit of built area, mapped against construction activity and building permits data.
WATER TREATMENT
Dosage per cubic meter of water treated — Treatment chemical consumption per volume of water processed, applied to municipal and industrial water treatment capacity.
AGRICULTURE
Kilograms per hectare of agricultural land — Application rate per unit of cultivated area, validated against crop protection and fertilizer application data.
MANUFACTURING
Kilograms per ton of manufactured product — Chemical input intensity per unit of output, calibrated against industrial production indices.
APPLICATION ANALYSIS
Market segmented by application area to understand product performance requirements, formulation trends, technology adoption, customer preferences, and regulatory requirements — improving demand accuracy and segmentation granularity.
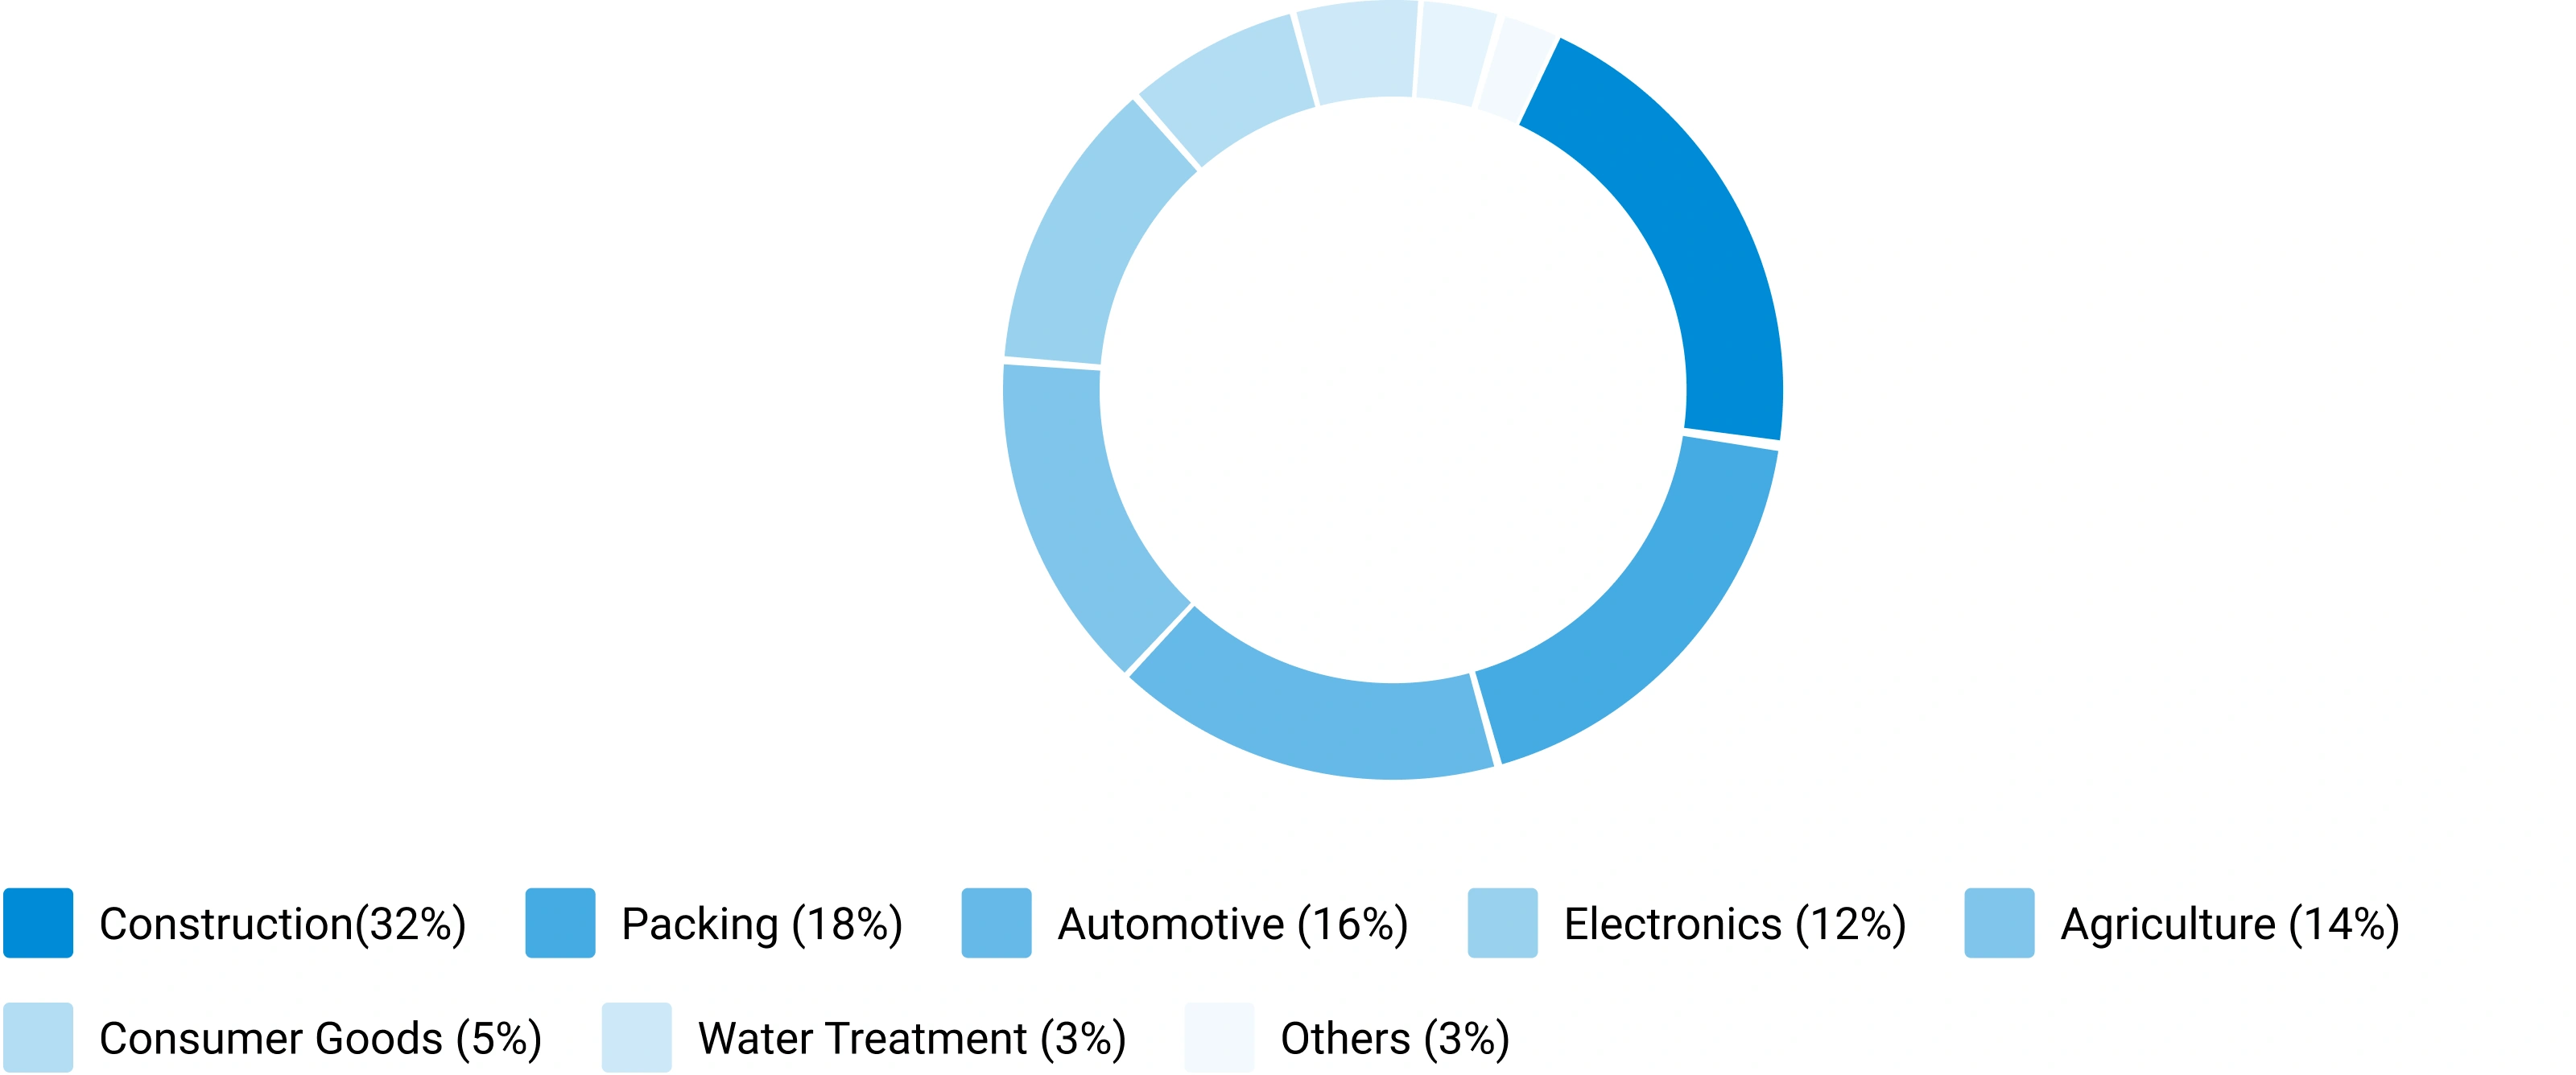
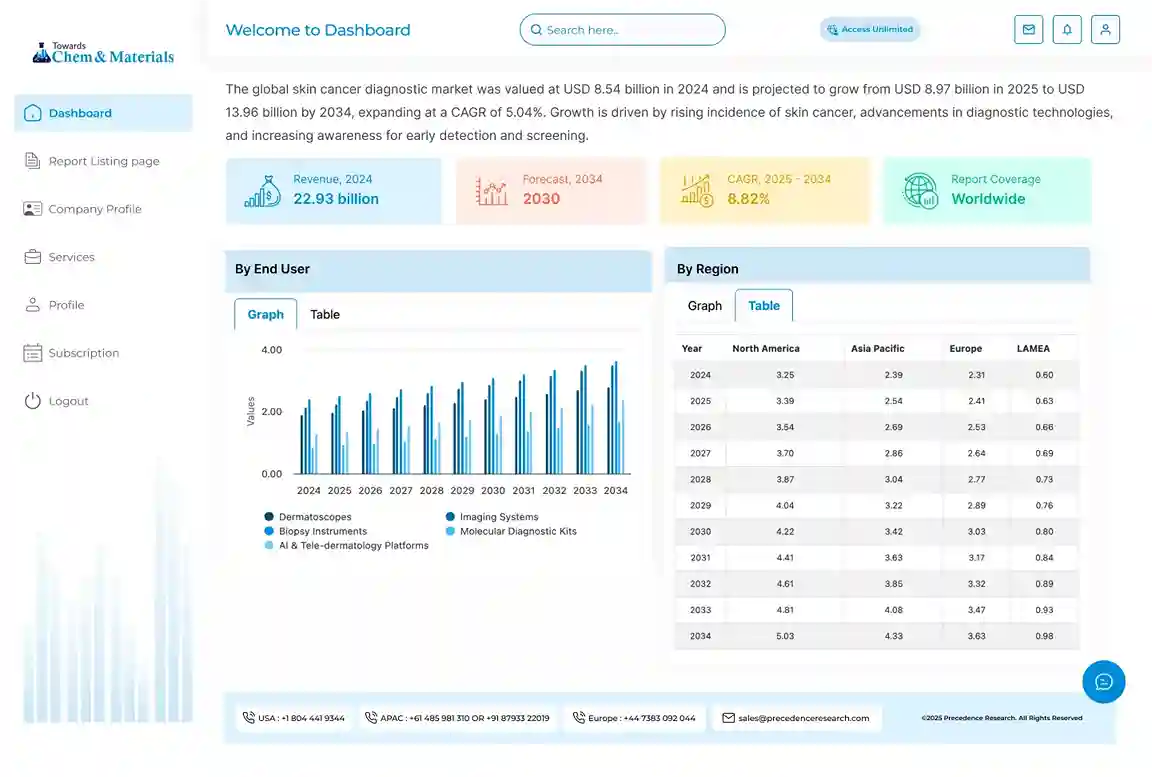
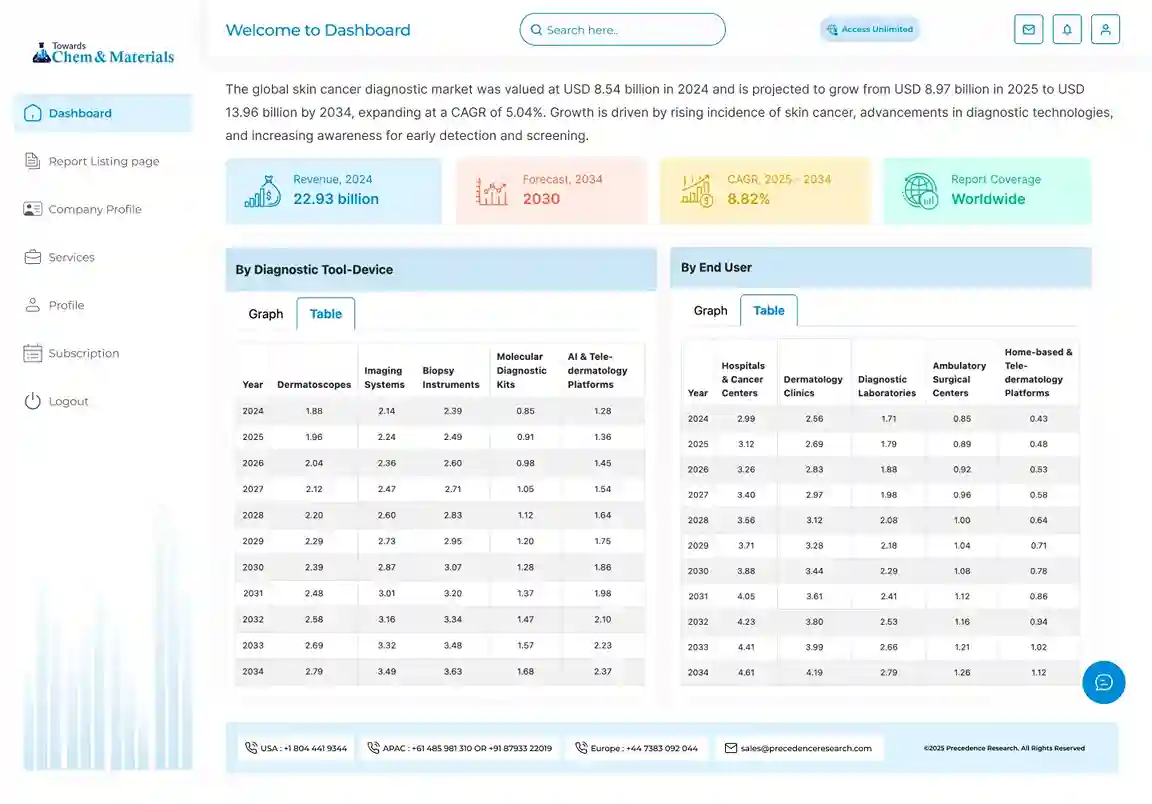
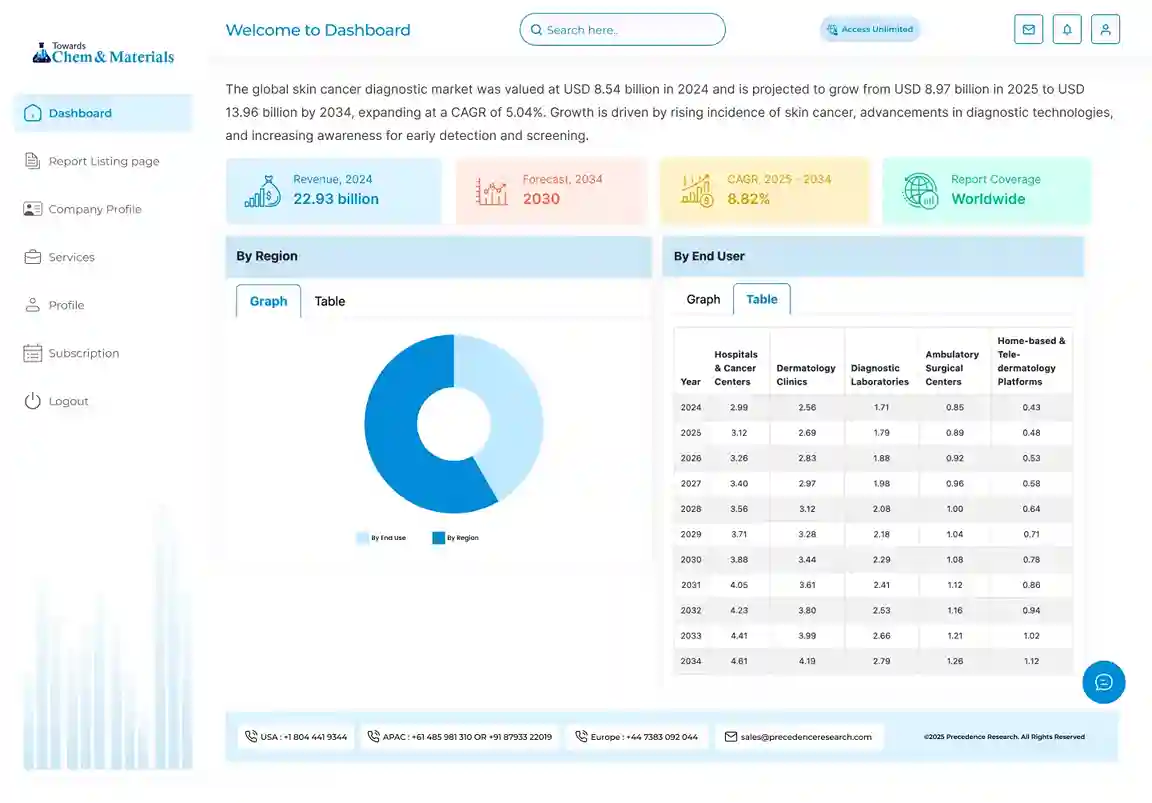
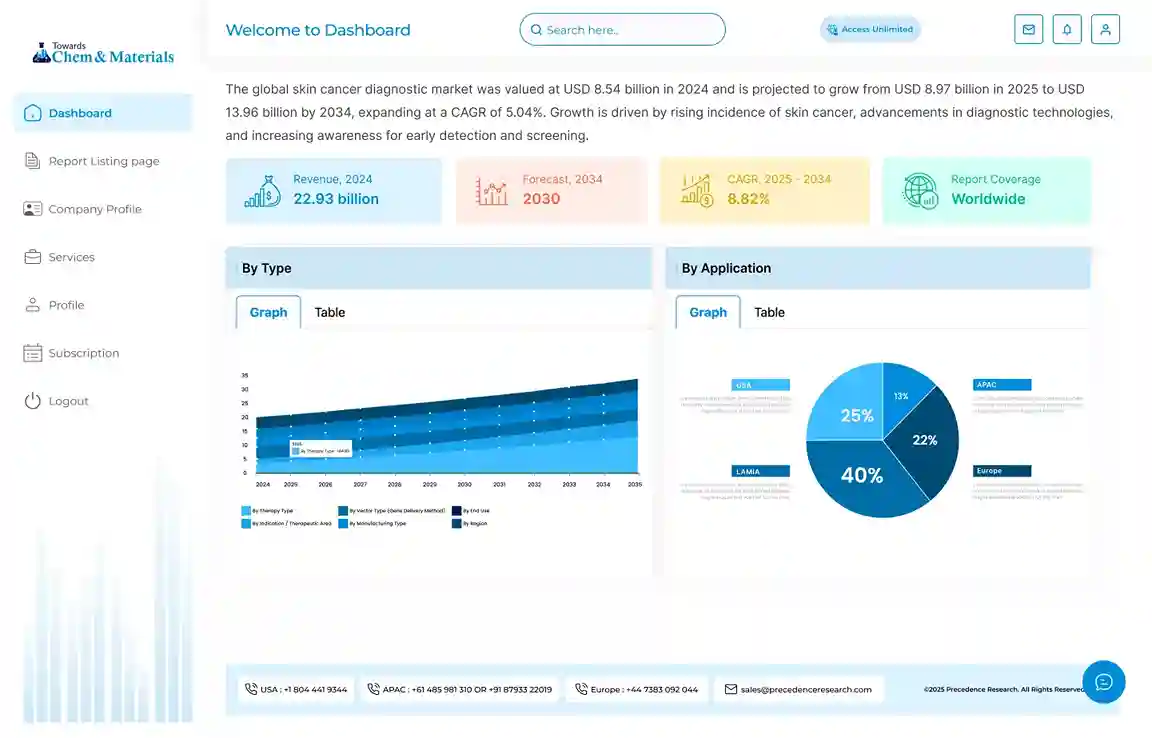
Demand-Side Assessment — End-Use Industry Demand Distribution
Illustrative distribution of chemical & materials demand across key end-use industries
Phase 4 - Trade Flow Analysis: Balancing Regional Supply and Demand
Trade flow analysis reconciles regional supply and demand estimates through import and export data, identifying net supply positions, regional dependencies, and market imbalances. It serves as an independent validation layer that tests the consistency of supply-side and demand-side estimates.
Import Analysis
Import data is evaluated to determine volumes, source countries, product dependency, regional supply gaps, and pricing trends — identifying markets that rely heavily on external supply and where domestic production is insufficient to meet demand.
Export Analysis
Export assessments reveal production surplus, export competitiveness, regional manufacturing strength, and global market participation. Export patterns also help validate domestic production estimates and identify net exporting regions.
Apparent Consumption Model
Regional consumption is assessed using the standard apparent consumption formula:
Results identify net importing regions, net exporting regions, regional deficits, and surpluses — serving as an independent validation of supply and demand estimates.
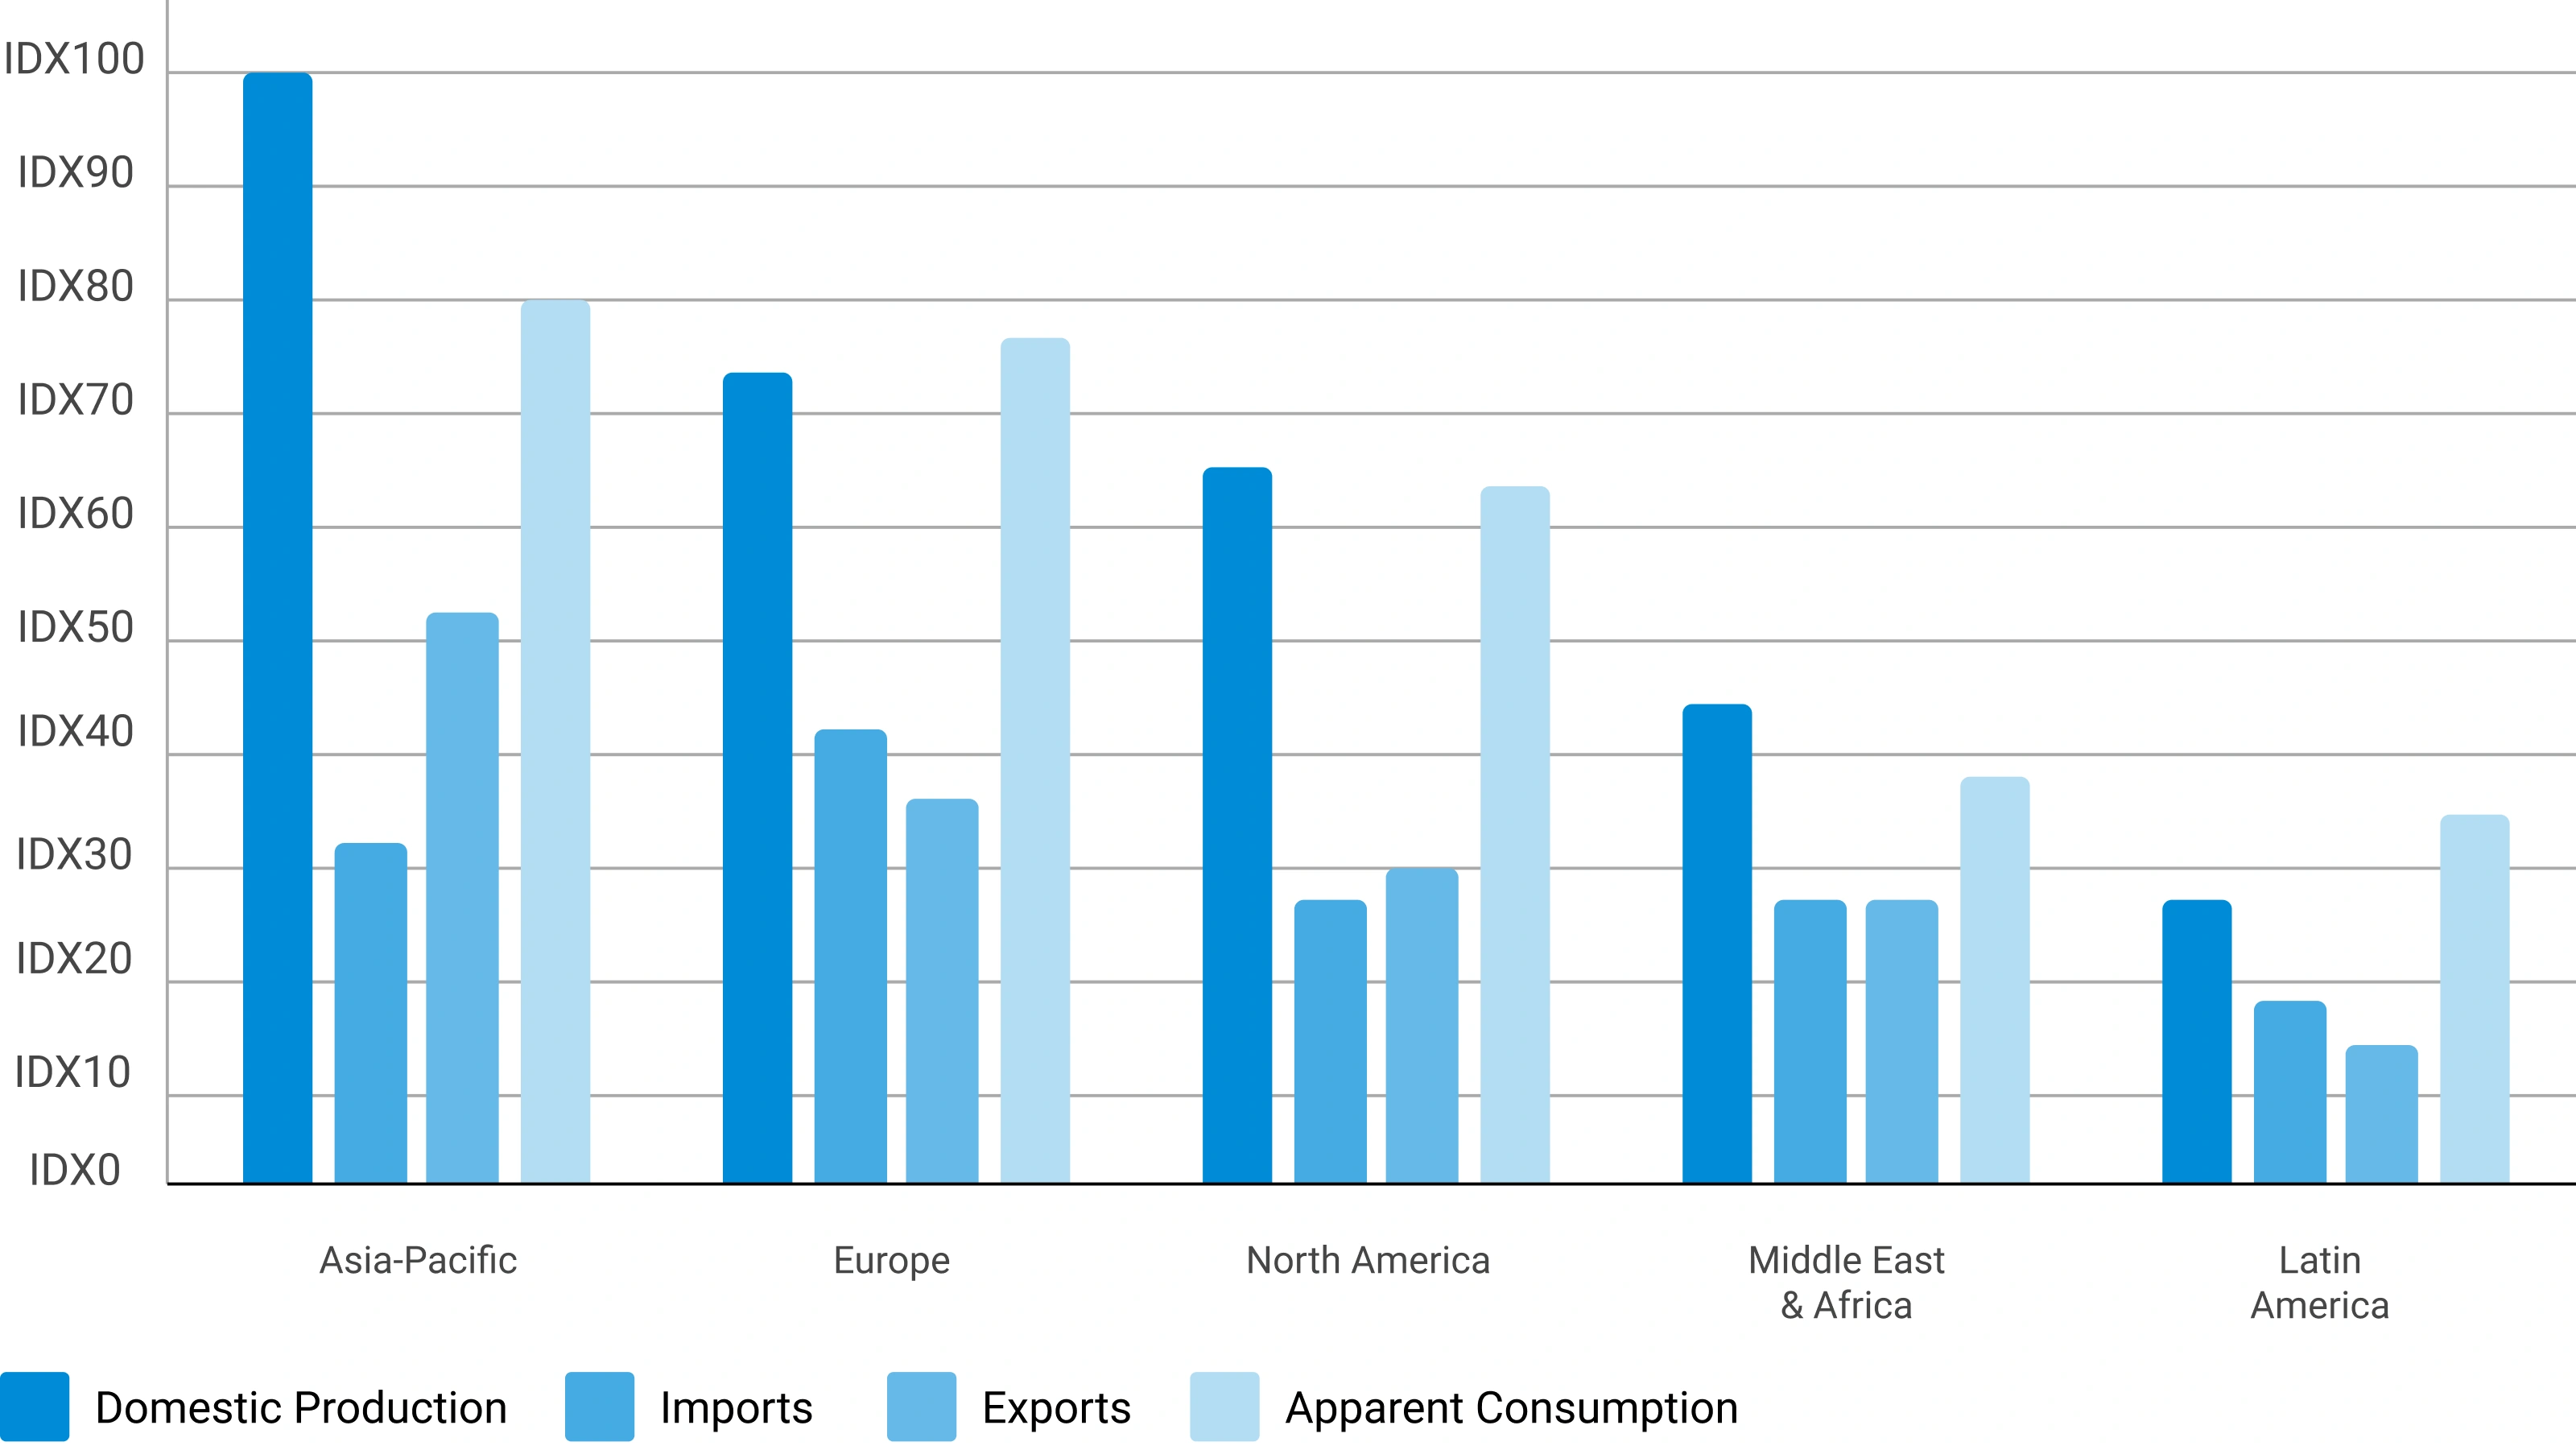
Trade Flow Analysis — Net Supply Position by Region
Illustrative apparent consumption vs. domestic production across major regions — positive gap indicates net import dependency
Phase 5 — Primary Research: The Critical Validation Layer
Primary research tests and refines findings from secondary research through direct engagement with industry participants across the supply chain, demand side, and expert community. It captures intelligence that no database or published report can provide — the real-world experience of manufacturers, buyers, and specialists operating in the market.
Supply-Side Interviews
Conversations with chemical manufacturers, raw material suppliers, contract manufacturers, technology providers, and plant operators cover production trends, capacity utilization, pricing developments, technology shifts, and competitive dynamics.
Demand-Side Interviews
Dosage per cubic meter of water treated — Engagement with OEMs, industrial consumers, procurement managers, distributors, formulators, and end-use manufacturers focuses on consumption trends, purchasing behavior, product substitution, demand outlook, and emerging applications.
Industry Expert Consultations
Additional interviews with industry consultants, independent experts, regulatory specialists, technical professionals, and research institutions provide deeper market context and validate key analytical assumptions.
Interview Format
Duration: 30–60 minutes per session. Mode: Video calls, telephonic interviews, expert consultations. Format: Structured / Semi-Structured questionnaire.
Interview Volume by Market Scope
| Study Scope | Number of Interviews |
|---|---|
| Niche Market | 20 – 30 |
| Mid-Sized Market | 30 – 50 |
| Global Market | 50 – 80 |
| Highly Fragmented Market | 80 – 120 |
Interview Details:
Category : Manufacturers, Suppliers, Distributors, End Users, Experts/Associations
Average Duration : 30–60 Minutes
Interview Mode : Video calls, telephonic interviews, expert consultations
Interview Format : Structured / Semi-Structured questionnaire
Focus Areas of Primary Research:
Market Size & Forecast Validation :
Revenue estimates, volume consumption, growth rates, forecast assumptions, regional demand.
Supply Chain & Value Chain Assessment :
Raw material sourcing, supply chain challenges, distribution networks, procurement practices.
Production & Capacity Analysis :
Manufacturing capacity, utilization rates, expansion projects, plant investments.
Pricing & Cost Structure Analysis :
Product pricing trends, feedstock costs, energy costs, margin pressures, pricing outlook.
Competitive Landscape Assessment :
Market share, competitor positioning, strategic initiatives, partnerships, acquisitions.
Primary Research — Stakeholder Coverage by Category
Distribution of interview respondents across stakeholder categories (% share from PPT data)
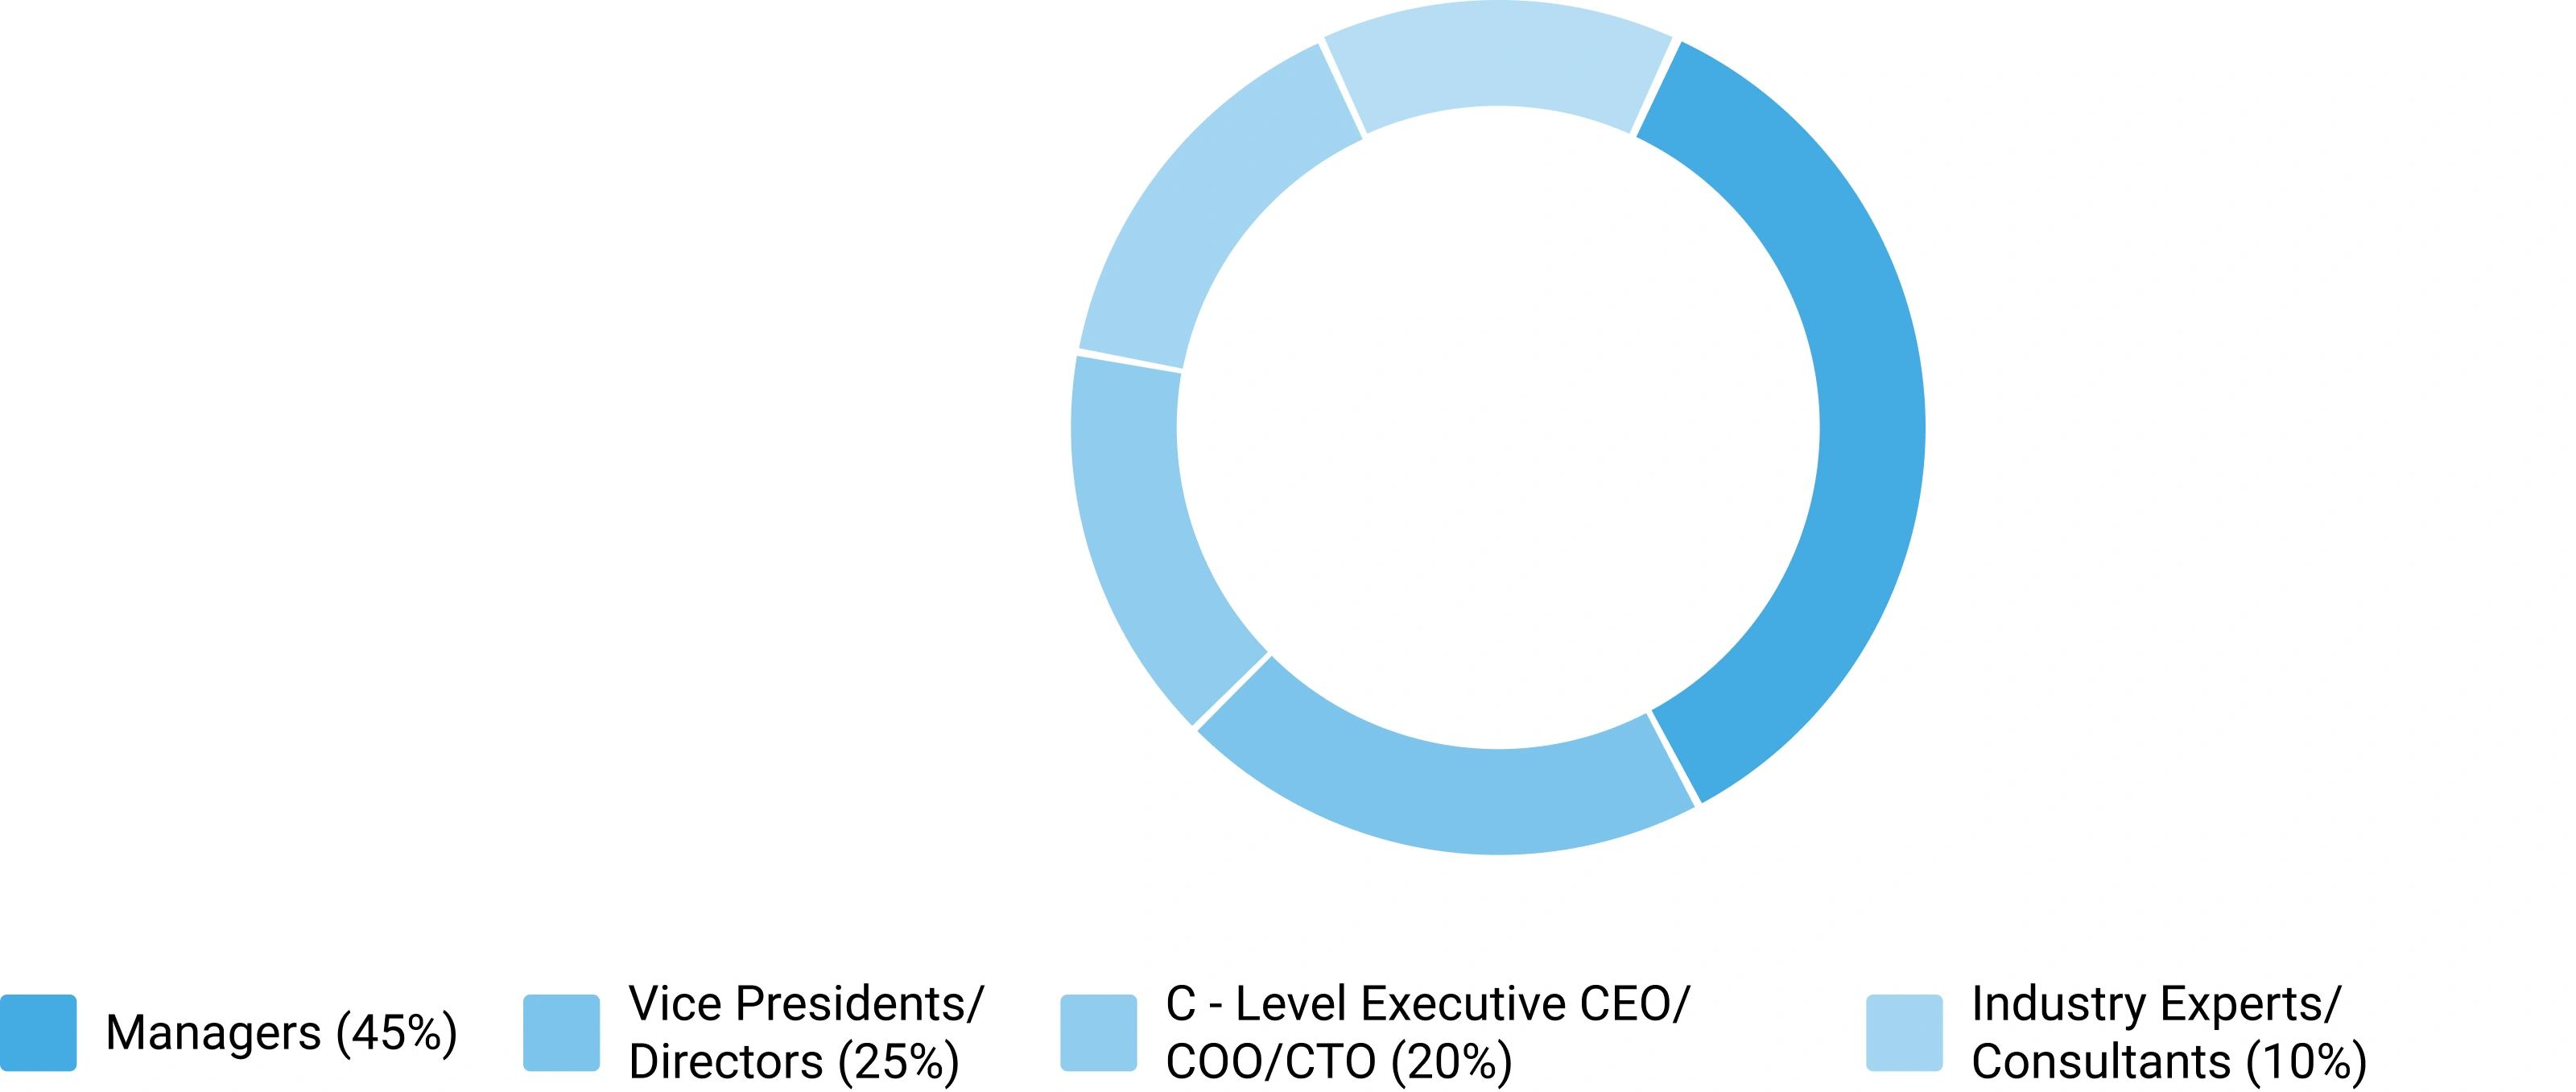
Primary Research — Respondent Designation Profile
Seniority breakdown of interview respondents (% share from PPT data)
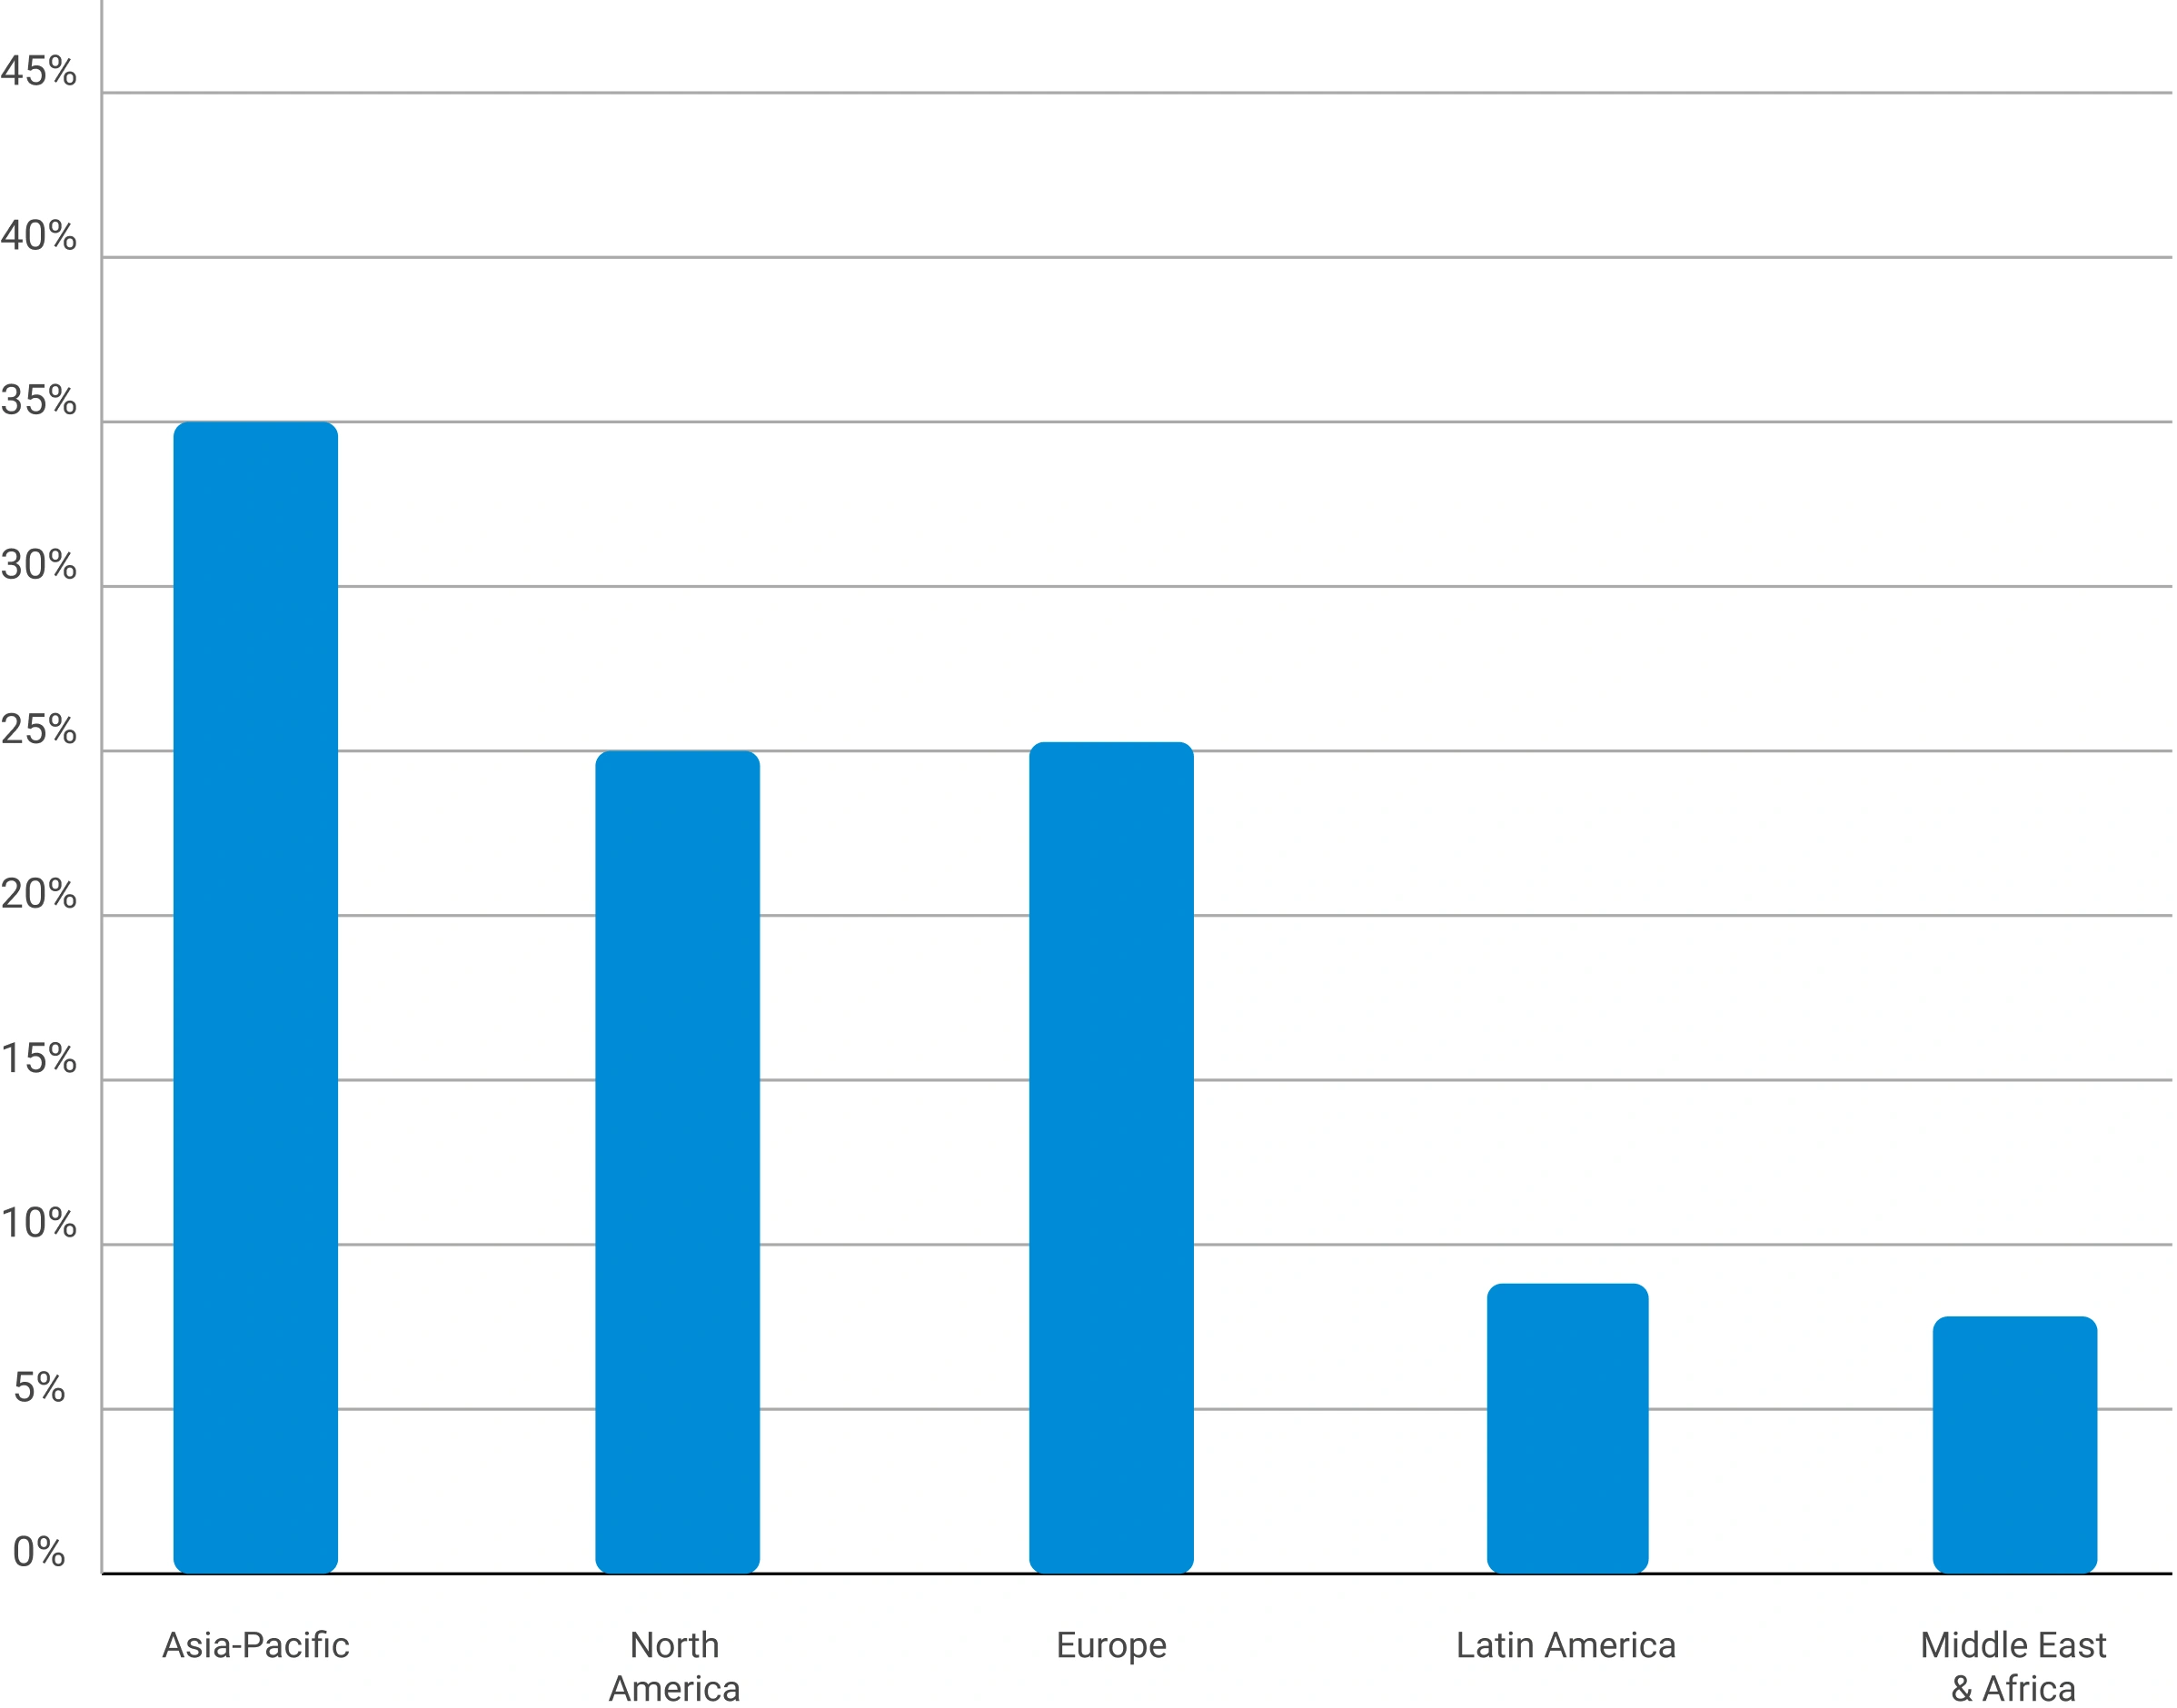
Primary Research — Geographic Coverage of Interviews
Regional distribution of primary research engagement (% share from PPT data)
Phase 6 — Data Triangulation and Market Validation
No single methodology is relied upon in isolation. Multiple independent estimation approaches are combined and reconciled to ensure consistency, accuracy, and analytical defensibility. Any material deviations between approaches are investigated and adjusted through additional validation cycles.
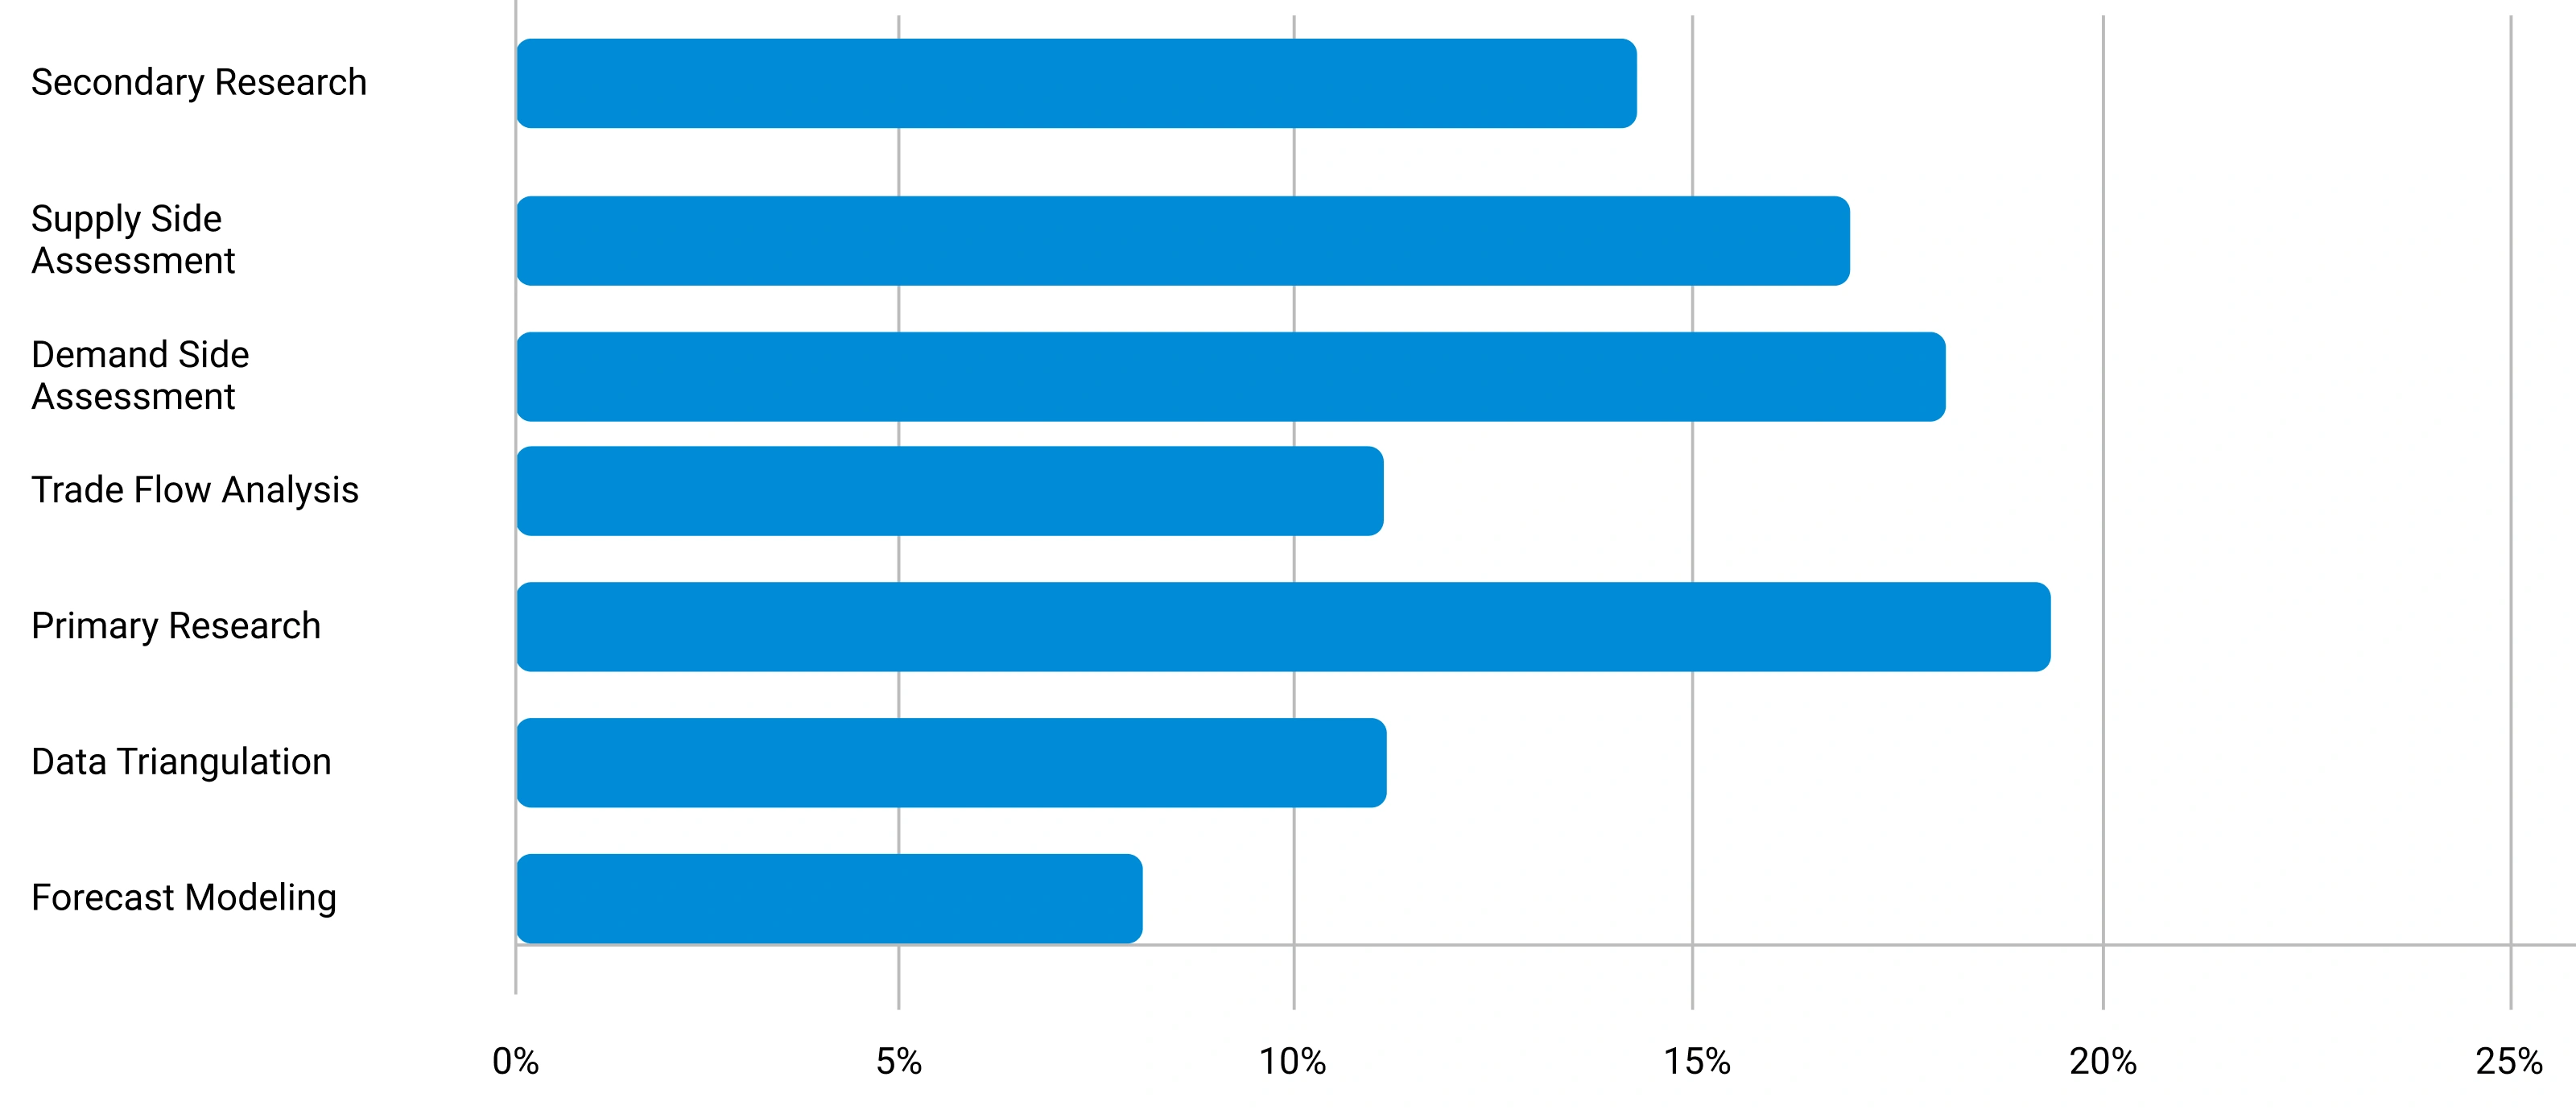
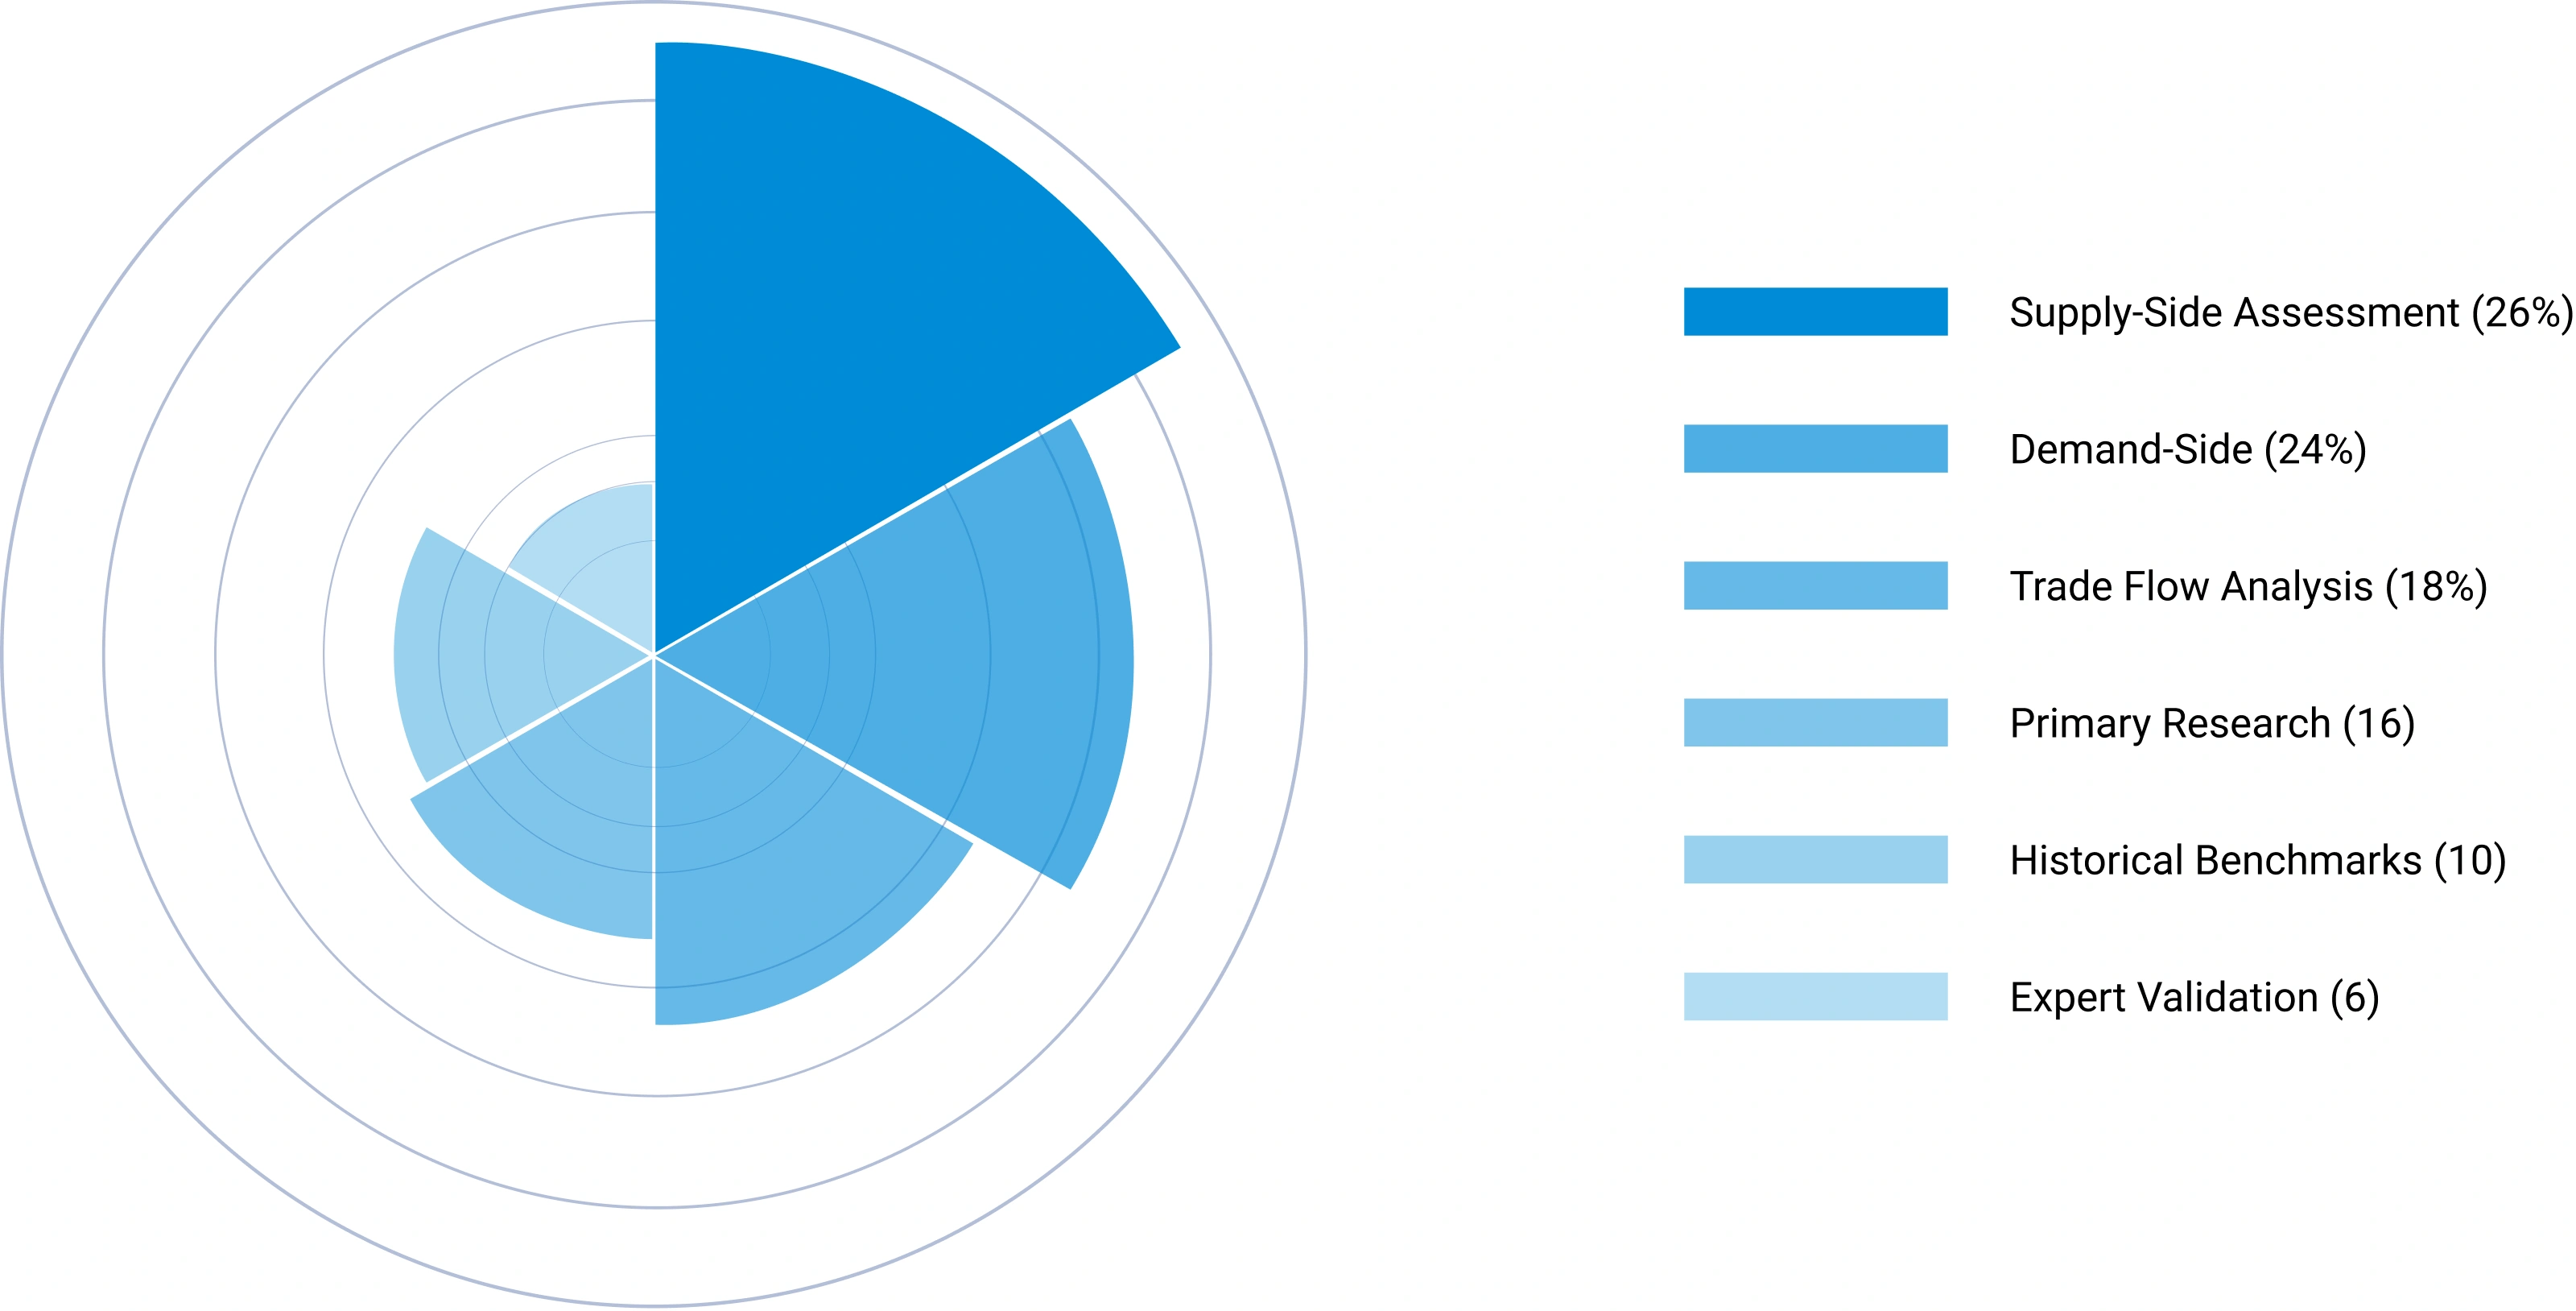
Triangulation Framework — Input Contribution Weight
Relative weight each sizing input contributes to the final reconciled market estimate
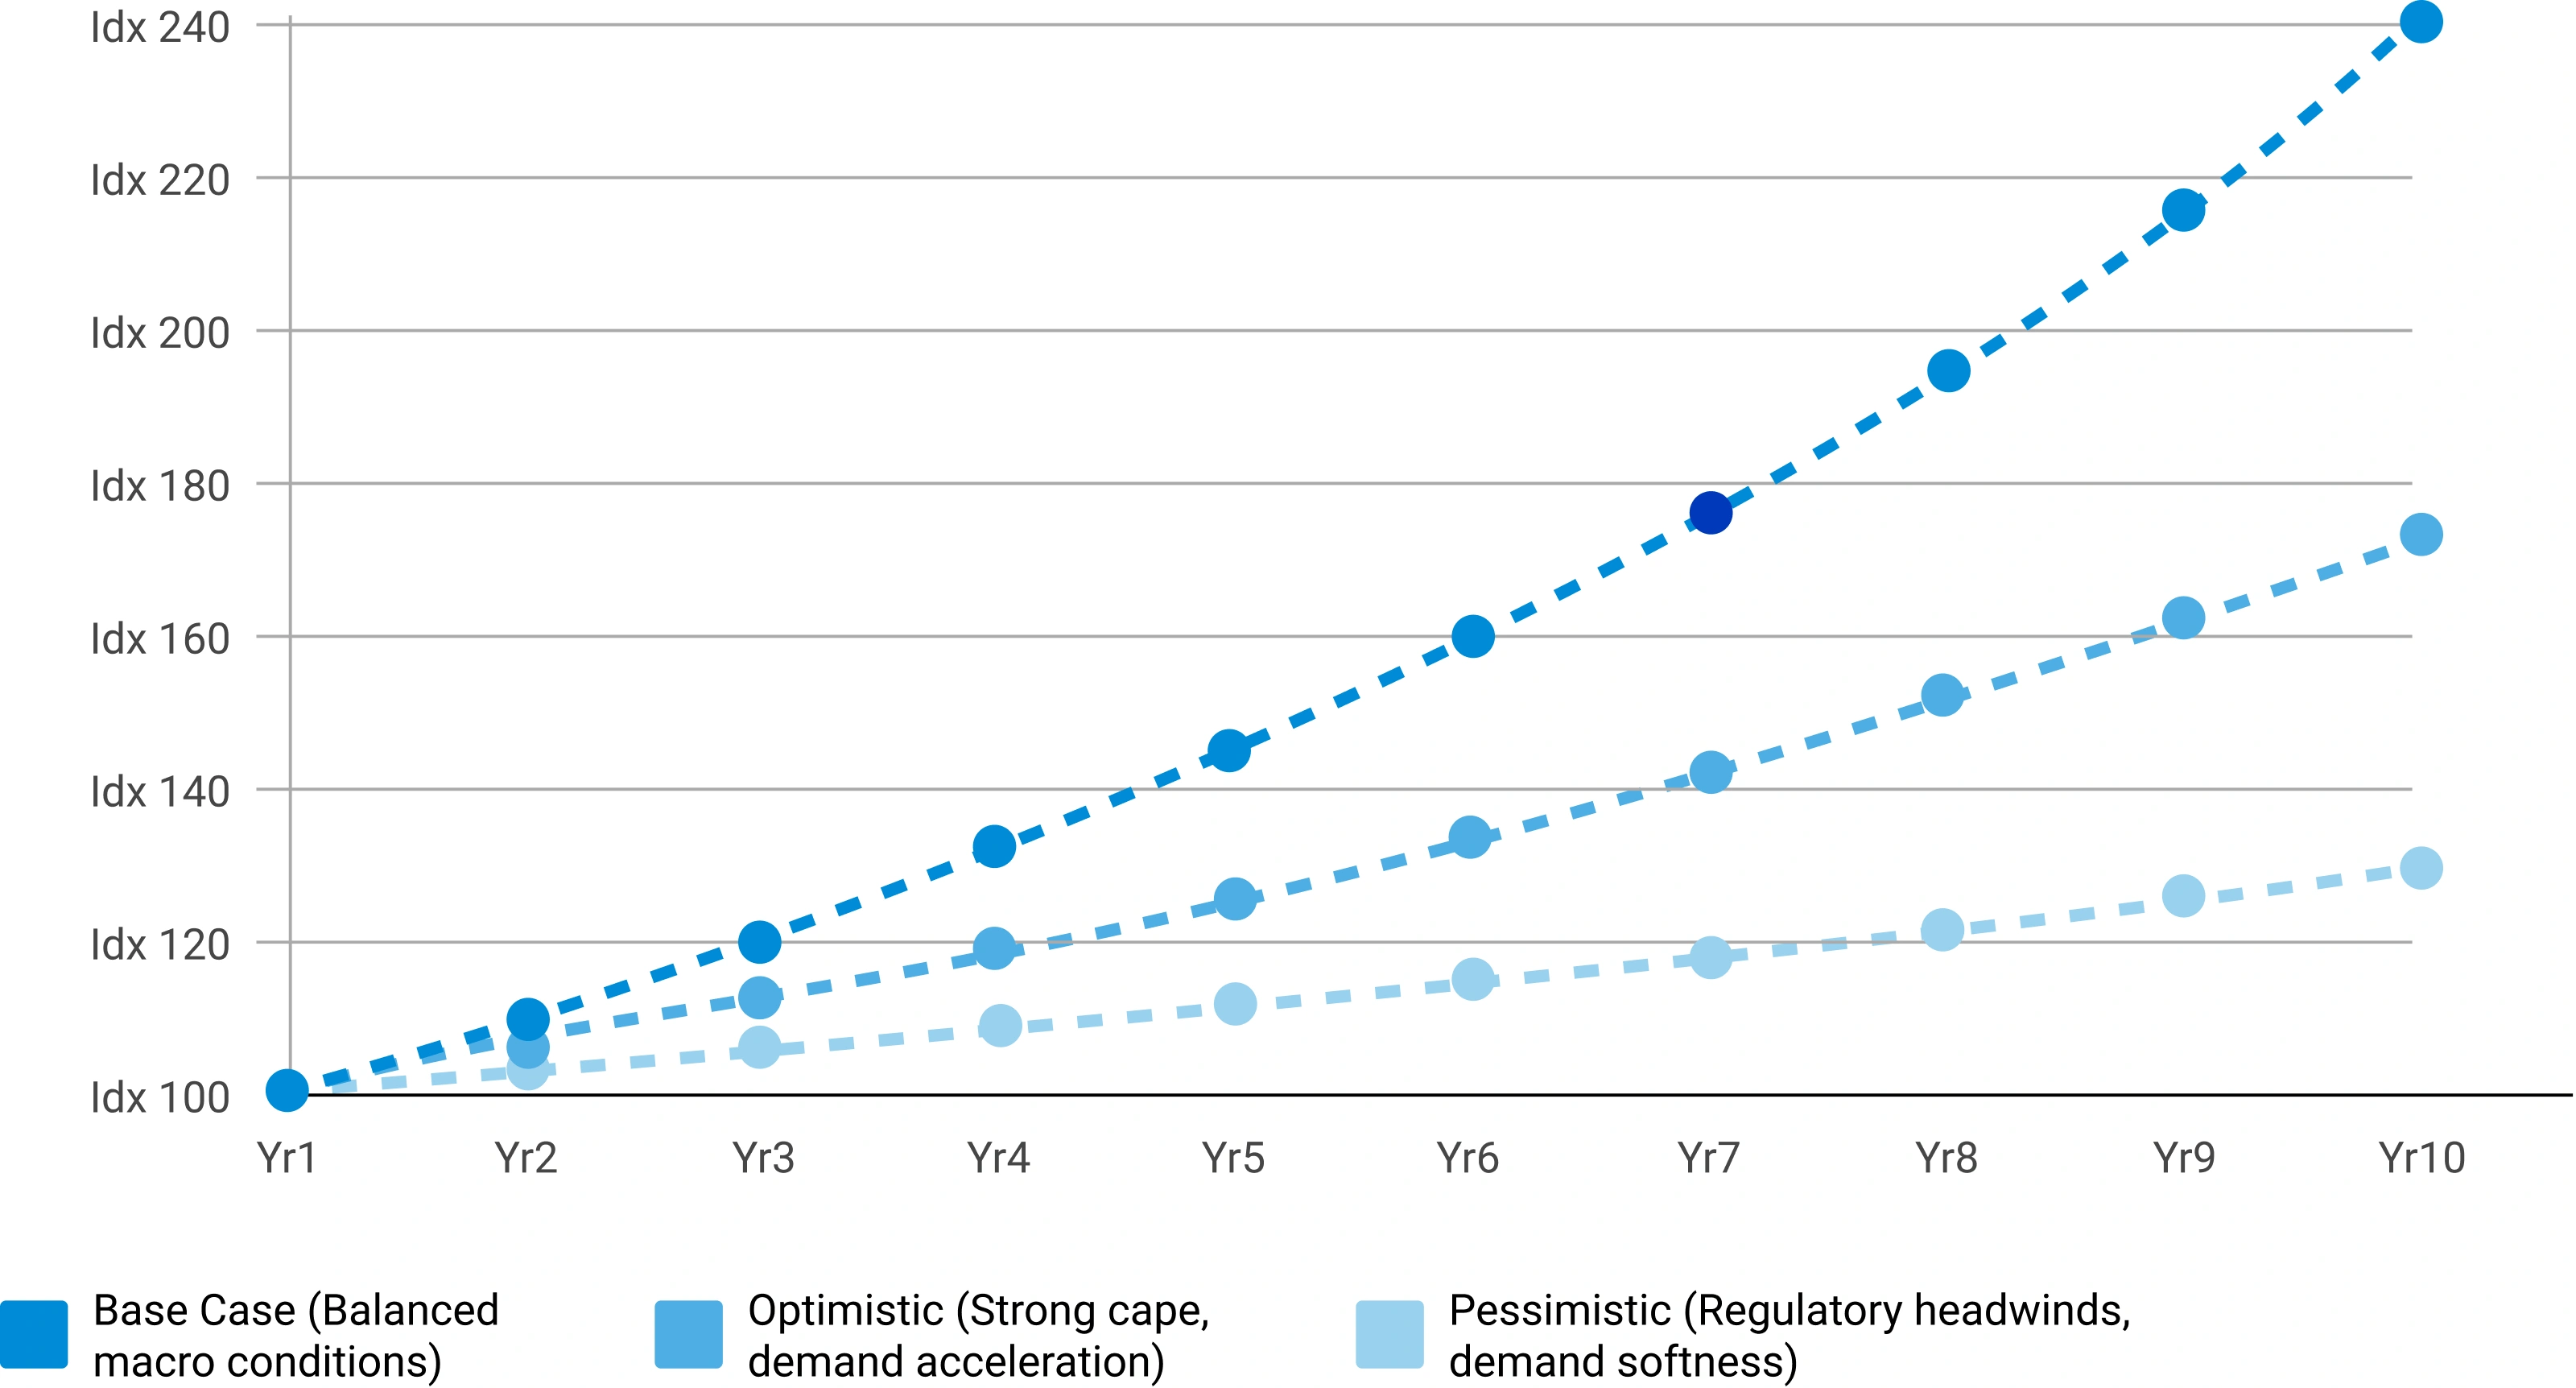
Phase 7 — Forecast Modeling: Projecting Future Market Evolution
Forecasting evaluates the future trajectory of the market using a combination of quantitative indicators and qualitative assessments across economic, industry, and regulatory dimensions. Rather than simple extrapolation, each driver is independently modeled and integrated into a composite forecast.
Macroeconomic Indicators
GDP growth, industrial production, manufacturing output, construction activity, consumer spending, and capital investment form the quantitative foundation of long-term demand projections. These are applied at country, regional, and global levels.
Industry Growth Drivers
Urbanization, infrastructure development, industrialization, technological innovation, sustainability initiatives, and evolving product performance requirements are assessed at regional and industry levels — capturing both structural and cyclical demand drivers.
Capacity Expansion Analysis
Announced plant expansions, new manufacturing facilities, technology upgrades, and strategic investments are evaluated to determine future supply-demand dynamics and potential market tightness or oversupply situations.
Regulatory & Sustainability
Environmental regulations, chemical safety standards, emission reduction targets, circular economy initiatives, and sustainability requirements are incorporated as they often influence product adoption rates and market growth trajectories.
Supply-Side Assessment — Capacity vs. Effective Production by Region
Illustrative comparison of installed capacity vs. effective production volume (after utilization rate adjustment) across major regions
Tags
FAQ's
Select User License to Buy
Figures (4)