
Solid Waste Management Market Size and Forecast 2026 to 2035
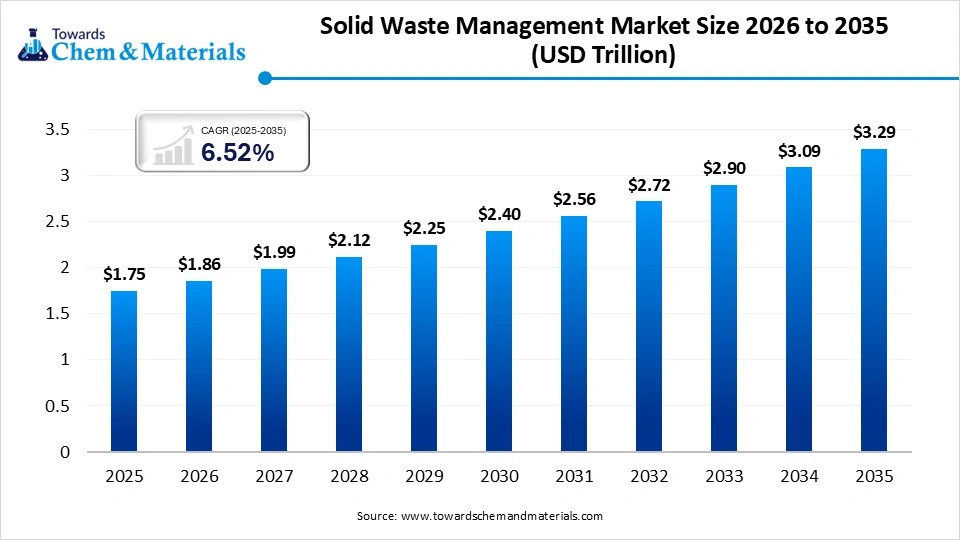
The global solid waste management market size was estimated at USD 1.75 trillion in 2025 and is expected to be worth around USD 3.29 trillion by 2035, exhibiting a compound annual growth rate (CAGR) of 6.52% over the forecast period from 2026 to 2035. The report provides comprehensive coverage of market size, detailed segment-level data across waste types, services, and treatment technologies, along with regional insights spanning North America, Europe, Asia-Pacific, Latin America, and the Middle East & Africa. It further includes in-depth company profiles, competitive landscape analysis, value chain mapping, trade flow analysis, and detailed data on manufacturers and suppliers, offering a complete view of industry dynamics driven by sustainability initiatives.
Key Takeaways
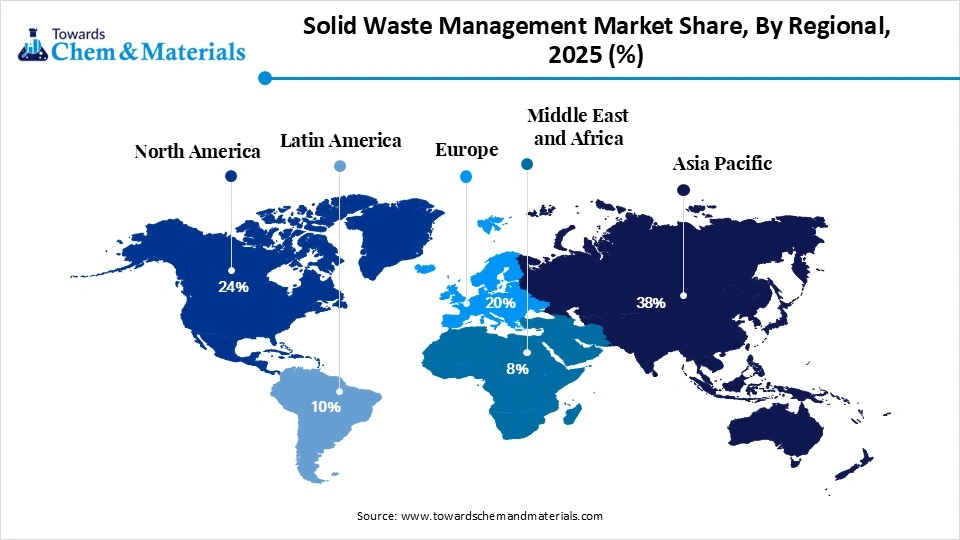
- By region, Asia Pacific dominated the solid waste management market in 2025, with 38% share expected to sustain its position while growing with the fastest CAGR of 6.8% in the forecast period, due to its huge population and fast urban growth.
- By region, North America held the second largest share of 22% in 2025 and expects notable growth with a CAGR of 5.10% during the forecast period, due to advanced systems and high environmental awareness.
- By waste type, the municipal solid waste segment dominated the market with 42% share in 2025, owing to its creation every single day by millions of people.
- By waste type, the construction & demolition waste segment expects the fastest growth in the market with 6.3% CAGR during the forecast period, owing to cities are growing very fast.
- By service type, the collection services segment dominated the market with 38% share in 2025, owing to waste must first be picked up before anything else can happen.
- By service type, the recycling services segment is expected to grow with the fastest CAGR of 6.50% in the forecast period due to people and governments becoming more aware of environmental problems.
- By end user, the residential segment dominated the market with 34% share in 2025, owing to every person generates waste daily at home.
- By end user, the government and municipal bodies segment is expected to grow at the fastest CAGR of 6.20% in the forecast period, owing to waste management becoming a public responsibility.
- By technology, the conventional systems segment dominated the market with 65% share in 2025, owing to they are simple, well-known, and already widely used
- By technology, the smart waste management segment is expected to grow at the fastest CAGR of 8.20% in the forecast period, owing to which makes the system faster, cleaner, and more efficient.
Eco-friendly Waste Solutions Shaping Future
The process of taking care of and reusing daily waste, including plastic, food waste, and other materials, is known as solid waste management. Also, the greater shift towards sustainability and eco-friendly manufacturing practices in major development areas has created an opportunistic environment for the solid waste management market in the current period.
Solid Waste Management Market Trends:
- The greater focus on waste reduction instead of just throwing it away has attracted increased capital and investment in the industry in recent years. Moreover, several households and companies are actively seen in trying to reduce waste by using lower plastic items nowadays.
- The heavy shift towards smart system management has elevated earning potential for management firms in the current period. Moreover, the firms are observed using smart bins and smarter pickup trucks to collect waste these days.
- Turning waste into useful products is expected to support stronger cash flows for management firms in the coming years. The private management firms can provide this waste to the major firms, which create energy, compost, and new materials in the coming years.
Smart Systems Improving Waste Handling Efficiency
Waste management is the use of simple but smart technology nowadays. Also, the machines are now helping in sorting waste faster and more accurately than humans. Moreover, small sensors are used in bins to check how full they are, which helps in better collection planning. Some systems can even track waste from the source to final disposal. Another important shift is converting waste into energy, like producing gas or electricity from garbage.
Trade Analysis of the Solid Waste Management Market
- Import, Export, Consumption, and Production Statistics
- The world has observed the heavy export of waste with 2,359,199 shipments via 12,864 buyers and 22,670 exporters in recent years.
- The United States has seen a greater export of waste with 1,738,915 shipments, while Mexico (91,366 shipments) and the United Kingdom (85,382 shipments) are following nowadays.
- India emerged as the leading waste importer with 448,388 shipments in the past years, while Malaysia (435,105 shipments) and Mexico (318,177 shipments) are among the heavy importers.
Supply Chain Analysis of the Solid Waste Management Market
Distribution to Industrial Users
- Industrial users manage solid waste through specialized waste contractors and environmental service firms. Large-scale distribution involves the deployment of industrial compactors, roll-off containers, and automated collection systems.
- Integrated logistics networks transport segregated waste hazardous, recyclable, or organic to dedicated Material Recovery Facilities (MRFs), specialized treatment plants, or waste-to-energy facilities for final processing.
Chemical Synthesis and Processing
- Chemical processing in solid waste management focuses on thermochemical conversion, like pyrolysis and gasification. These processes break down complex polymers and organic waste into synthetic gas (syngas), bio-oil, and char in oxygen-controlled environments. Additionally, chemical recycling depolymerizes plastic waste into original monomers, enabling high-value material recovery.
Regulatory Compliance and Safety Monitoring
- Solid waste management is governed by strict frameworks like the RCRA (US) and Waste Framework Directive (EU). Compliance involves rigorous monitoring of leachate, landfill gas emissions, and hazardous waste tracking via digital manifests. Safety protocols prioritize occupational health and environmental protection through frequent site audits and groundwater testing.
Solid Waste Management Market Regulatory Landscape: Regulations
| Country Region | Regulatory Body | Key Regulations | Focus Areas |
| United States | Environmental Protection Agency (EPA), | Subtitle C (Hazardous Waste): Establishes a "cradle-to-grave" system for tracking hazardous waste from generation to final disposal. | Protection of groundwater from landfill leachate, promoting recycling at the state level, and strictly managing hazardous industrial byproducts |
| Europe | European Commission (Environment) and national environmental agencies. | Waste Framework Directive (Directive 2008/98/EC), as amended by Directive (EU) 2025/1892. | Achieving a 65% recycling rate for municipal waste by 2035, reducing food waste by 30% by 2030, and mandating separate collection for textiles and bio-waste. |
| China | Ministry of Ecology and Environment (MEE) | Law on the Prevention and Control of Environmental Pollution by Solid Waste (last major amendment effective 2020). | Prohibiting all imported solid waste (since 2021), standardizing municipal waste classification, and promoting "resource utilization" (waste-to-energy) |
Segmental Insights
Waste Type Insights
The Municipal Solid Waste Segment Dominated the Solid Waste Management Market with 42% Market Share in 2025
The municipal solid waste segment dominated the market with 42% share in 2025, owing to it is created every single day by millions of people. Every home, shop, and office produces garbage like food waste, plastic, and paper. This waste is regular, predictable, and large in volume. Governments are responsible for managing it, so there is constant spending and strong systems in place.
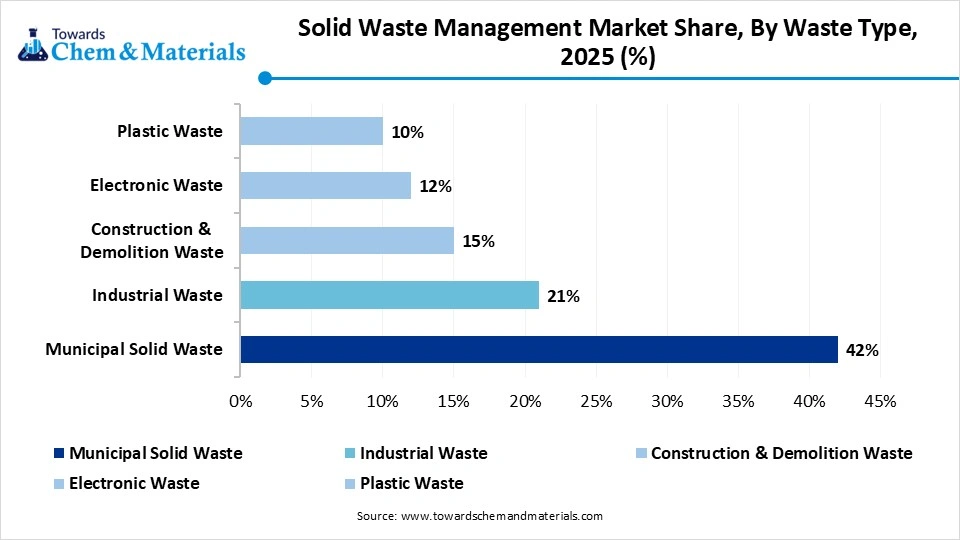
The industrial waste segment held the second largest share of 21% in 2025 due to factories and manufacturing units producing waste in huge quantities. This includes chemicals, metals, packaging materials, and leftover raw materials. Even though the number of industries is less than the number of households, the amount of waste from each industry is very high.
The construction & demolition waste segment is expected to be the fastest-growing in the market with 6.3% CAGR during the forecast period, due to cities are growing very fast. New buildings, roads, and infrastructure projects are increasing every year. At the same time, old buildings are being demolished and replaced. This creates a huge amount of waste, like concrete, bricks, steel, and wood. Governments are now focusing on recycling this waste instead of dumping it.
The electronic waste segment held the fourth largest share of 12% in 2025, owing to people using more electronic devices like phones, laptops, and appliances. However, these items are not thrown away as often as daily household waste. They are replaced after longer periods, which limits their total volume compared to other waste types.
Solid Waste Management Market Share, By Waste Type, 2025 (%)
| By Waste Type | Revenue Share, 2025 (%) |
| Municipal Solid Waste | 42% |
| Industrial Waste | 21% |
| Construction & Demolition Waste | 15% |
| Electronic Waste | 12% |
| Plastic Waste | 10% |
Service Type Insights
The Collection Services Segment Dominated the Market with 38% Market Share in 2025
The collection services segment dominated the market with 38% share in 2025 due to waste must first be picked up before anything else can happen. No matter how advanced recycling or disposal systems are, they are useless if waste is not collected properly. Collection happens daily and covers every home, business, and industry.
The recycling services segment is expected to be the fastest-growing in the market with a CAGR of 6.50% in the forecast period, owing to people and governments becoming more aware of environmental problems. Instead of throwing waste away, there is a strong push to reuse materials like plastic, paper, and metal. Recycling helps reduce pollution and save natural resources.
Solid Waste Management Market Share, By Service Type, 2025 (%)
| By Service Type | Revenue Share, 2025 (%) |
| Collection Services | 38% |
| Transportation Services | 18% |
| Disposal Services | 22% |
| Recycling Services | 22% |
The disposable services segment held the third largest share of 22% in 2025 due to not all waste can be recycled or reused. A large portion of waste still needs to be safely dumped or treated. This includes waste that is contaminated, mixed, or not suitable for recycling. Landfills and treatment plants are used for this purpose.The transportation services segment held the fourth largest share of 18% in 2025, as they support the system but are not the main activity. After waste is collected, it needs to be moved to recycling centers or disposal sites. This requires trucks, fuel, and routes, but it is a shorter and less complex step compared to collection or processing.
End User Insights
The Residential Segment Dominated the Solid Waste Management market with 34% Market Share in 2025
The residential segment dominated the market with 34% share in 2025 due to every person generating waste daily at home. This includes food waste, packaging, plastic, and other common items. Since the population is very large, the total waste from households becomes extremely high. Waste from homes is also collected regularly, which increases its share in the market.
The commercial segment held the second largest share of 26% share in 2025, owing to businesses like shops, restaurants, offices, and malls producing a large amount of waste. This waste includes packaging materials, food waste, and paper. While the number of commercial places is less than that of households, each one generates more waste than a single home.
Solid Waste Management Market Share, By End-User, 2025 (%)
| By End-User | Revenue Share, 2025 (%) |
| Residential | 34% |
| Commercial | 26% |
| Industrial | 22% |
| Government & Municipal Bodies | 18% |
The industrial segment held the third largest share of 22% in 2025 due to it includes fewer sources compared to homes and commercial places, but each source produces a large amount of waste. This waste can be complex and sometimes hazardous, requiring special treatment. Industries often manage part of their waste internally, which reduces their dependence on external service.
The government and municipal bodies segment is expected to be the fastest growing in the market with 6.20% CAGR during the forecast period, owing to waste management becoming a public responsibility. As cities grow, managing waste becomes more complex and requires strong systems and funding. Governments are investing more in infrastructure, smart systems, and recycling programs.
Technology Insights
The Conventional Systems Segment Dominated the Market with 65% Market Share in 2025
The conventional systems segment dominated the market with 65% share in 2025 due to they are simple, well-known, and already widely used. These include basic methods like manual collection, landfilling, and simple sorting. They do not require advanced technology or high investment, making them easy to operate in many areas.
Solid Waste Management Market Share, By Technology, 2025 (%)
| By Technology | Revenue Share, 2025 (%) |
| Conventional Systems | 65% |
| Smart Waste Management | 35% |
The smart waste management segment is expected to be the fastest-growing in the market with a CAGR of 8.20% in the forecast period, owing to it makes the system faster, cleaner, and more efficient. It uses simple technologies like sensors, data tracking, and automated systems. Also, this reduces fuel use and saves time. It also helps in better recycling by improving waste sorting.
Regional Insights
How will Asia Pacific Dominate the Solid Waste Management market in 2025?
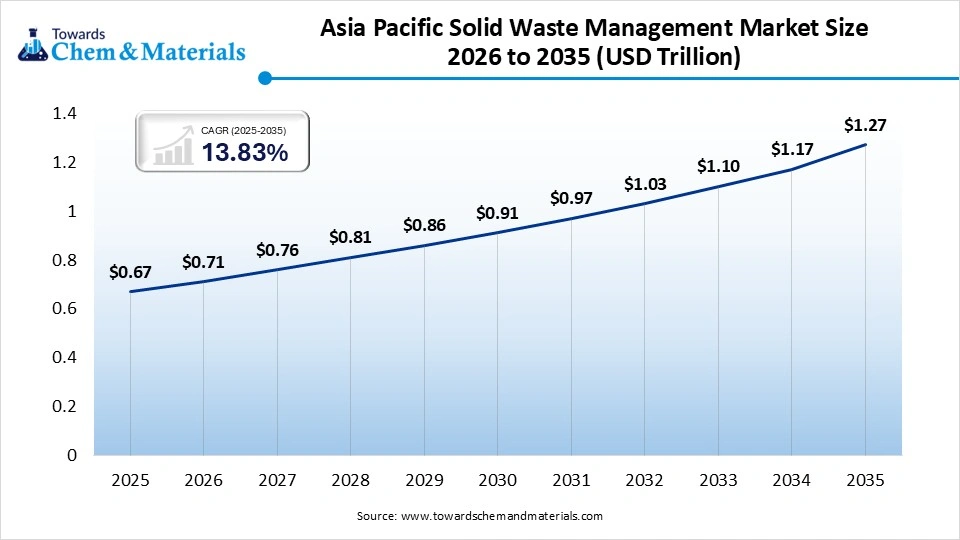
The Asia Pacific solid waste management market size was estimated at USD 0.67 trillion in 2025 and is projected to reach USD 1.27 trillion by 2035, growing at a CAGR of 6.60% from 2026 to 2035. Asia Pacific dominated the market with a share of 38% in 2025, owing to its huge population and fast urban growth. Cities are expanding quickly, which increases daily waste generation. Many countries in this region are still improving their waste systems, so there is a high demand for better solutions. Governments are investing in collection, recycling, and smart technologies.
China Leading Global Waste Management Growth
China maintained its dominance in the market, owing to its generating a very large amount of waste due to its population and industrial activities. The country is now focusing on improving its waste management systems. It is reducing landfill use and encouraging recycling and waste sorting at the source. Government rules have become stricter, forcing cities and industries to manage waste properly.
Solid Waste Management Market Evaluation in North America
North America held the second largest share of 22% in 2025 and expects notable growth with a CAGR of 5.10% during the forecast period, owing to advanced systems and high environmental awareness. The region already has well-developed infrastructure for collection, recycling, and disposal. Now, the focus is on improving efficiency and reducing environmental impact. New technologies like smart waste systems and automation are being adopted.
Strong Growth Ahead in the United States Management
The United States is expected to emerge as a prominent country for the solid waste management market in the coming years, due to its production of a large amount of waste and its strong management systems. It uses advanced technologies for sorting, recycling, and converting waste into energy. Many companies are investing in new solutions to improve efficiency and reduce pollution. Government policies encourage recycling and proper disposal.
Recent Development
- In February 2026, Housing and Urban Development Corporation Ltd. (HUDCO) India is planning to launch a project of sustainable solid waste management. Also, this project will use 1700 acres of land while preventing 2000 tons from reaching landfills yearly, as per the published reports.
Solid Waste Management Market Competitive Landscape Analysis
Tier 1 Companies
|
Rank
|
Company Name | Headquarters | Country | Why Relevant to This Market | Key Products / Material Portfolio |
| 1 | Waste Management, Inc. | Houston, Texas | United States | North America's largest integrated solid waste management company with extensive collection, recycling, landfill, and renewable energy operations | Municipal solid waste collection, recycling services, landfill operations, renewable natural gas, waste-to-energy |
| 2 | Republic Services, Inc. | Phoenix, Arizona | United States | Global leader in municipal and industrial waste management with advanced recycling and landfill infrastructure | Solid waste collection, recycling, landfill management, environmental services |
| 3 | Veolia Environnement S.A. | Paris, Île-de-France | France | Global leader in waste management, recycling, hazardous waste treatment, and circular economy solutions | Waste collection, recycling, hazardous waste treatment, waste-to-energy |
| 4 | SUEZ S.A. | Paris, Île-de-France | France | Major provider of municipal waste collection, recycling, and resource recovery services worldwide | Recycling services, waste treatment, landfill management, resource recovery |
| 5 | Remondis SE & Co. KG | Lünen, North Rhine-Westphalia | Germany | One of Europe's largest waste management and recycling companies with integrated resource recovery operations | Recycling, municipal waste management, hazardous waste services, circular economy solutions |
Tier 2 Companies
|
Rank
|
Company Name | Headquarters | Country | Why Relevant to This Market | Key Products / Material Portfolio |
| 1 | Clean Harbors, Inc. | Norwell, Massachusetts | United States | Leading provider of hazardous and industrial waste management solutions | Hazardous waste disposal, industrial waste management, recycling services |
| 2 | Biffa plc | High Wycombe, England | United Kingdom | Leading integrated waste management and recycling company in the UK | Municipal waste collection, recycling, landfill, resource recovery |
| 3 | FCC Servicios Medio Ambiente Holding S.A. | Madrid | Spain | Major European provider of municipal solid waste collection and treatment services | Waste collection, recycling, street cleaning, landfill management |
| 4 | Paprec Group | Paris, Île-de-France | France | Leading recycling and waste recovery company with diversified waste treatment capabilities | Recycling, plastics recovery, paper recycling, waste valorization |
Tier 3 Companies
|
Rank
|
Company Name | Headquarters | Country | Why Relevant to This Market | Key Products / Material Portfolio |
| 1 | Urbaser S.A. | Madrid | Spain | Global provider of municipal waste collection, recycling, and environmental services | Waste collection, recycling, waste treatment, circular economy services |
| 2 | Renewi plc | Milton Keynes, England | United Kingdom | Leading European company focused on converting waste into secondary raw materials | Recycling, industrial waste treatment, material recovery |
| 3 | Casella Waste Systems, Inc. | Rutland, Vermont | United States | Regional leader in integrated waste management, recycling, and resource recovery | Waste collection, recycling, landfill management, organics processing |
| 4 | GFL Environmental Inc. | Vaughan, Ontario | Canada | One of North America's fastest-growing environmental services providers | Solid waste collection, recycling, landfill services, liquid waste management |
| 5 | Hitachi Zosen Corporation | Osaka | Japan | Leading supplier of waste-to-energy plants and advanced solid waste treatment technologies | Waste-to-energy systems, incineration plants, resource recovery technologies |
Top Vendors in the Solid Waste Management Market & Their Offerings:
- Waste Management, Inc. (WM): Based in Houston, WM is North America’s largest environmental services provider. It manages the entire waste lifecycle, from collection and recycling to disposal and waste-to-energy conversion. Operating the continent's largest network of landfills and recycling facilities, WM heavily invests in renewable natural gas (RNG) technology and sustainable fleet automation.
- Republic Services, Inc.: As the second-largest provider in the U.S., Republic Services focuses on diverse waste streams, including residential, industrial, and hazardous materials. They are industry leaders in sustainability, operating extensive recycling centers and solar-powered landfills. Their "Blue Planet" initiative emphasizes reducing emissions through an expansive electric collection vehicle fleet.
- Waste Connections, Inc.: Waste Connections provides non-hazardous waste collection, transfer, and disposal services across the U.S. and Canada. Known for its decentralized management structure, the company excels in secondary and rural markets. It also provides specialized services for the oil and gas industry, focusing on sustainable liquid waste and drilling byproduct management.
Solid Waste Management Market Key Players
- Waste Management Inc. (USA)
- SUEZ Group (France)
- Veolia Environment S.A. (France)
- Biffa PLC (U.K.)
- Clean Harbors Inc. (USA)
- Covanta Holdings Corporation (USA)
- Hitachi Zosen Corporation (Japan)
- Remondis AG & Co. Kg (Germany)
- Republic Services Inc. (USA)
- Stericycle Inc. (USA)
- Advanced Disposal Services Inc. (USA)
- ALBA Group (Germany)
- Recology (USA)
- TANA Oy (Finland)
- Envac Group (Sweden)
Solid Waste Management Market Segments Covered in the Report
By Waste Type
- Municipal Solid Waste (MSW)
- Residential Waste
- Commercial Waste
- Institutional Waste
- Industrial Waste
- Hazardous Waste
- Non-Hazardous Waste
- Construction & Demolition Waste
- Concrete
- Wood
- Metals
- Others
- Electronic Waste (E-Waste)
- Consumer Electronics
- IT Equipment
- Large Household Appliances
- Plastic Waste
- Rigid Plastics
- Flexible Plastics
- Microplastics
By Service Type
- Collection Services
- Door-to-Door Collection
- Curbside Collection
- Community Bin Collection
- Transportation Services
- Transfer Stations
- Long-Haul Transport
- Disposal Services
- Landfilling
- Open Dumping
- Recycling Services
- Material Recovery Facilities (MRFs)
- Composting
- Anaerobic Digestion
By Treatment Method
- Landfill
- Sanitary Landfill
- Controlled Landfill
- Incineration
- Mass Burn
- Refuse-Derived Fuel (RDF)
- Recycling
- Mechanical Recycling
- Chemical Recycling
- Biological Treatment
- Composting
- Anaerobic Digestion
By End-User
- Residential
- Commercial
- Retail
- Hospitality
- Offices
- Industrial
- Manufacturing
- Chemical
- Energy & Utilities
- Government & Municipal Bodies
By Technology
- Smart Waste Management
- IoT Sensors
- AI-Based Sorting
- Route Optimization Software
- Conventional Systems
- Manual Sorting
- Basic Collection Systems
By Region
- North America:
- U.S.
- Canada
- Mexico
- Rest of North America
- Latin America:
- Brazil
- Argentina
- Rest of Latin America
- Europe:
- Western Europe
- Germany
- Italy
- France
- Netherlands
- Spain
- Portugal
- Belgium
- Ireland
- UK
- Iceland
- Switzerland
- Poland
- Rest of Western Europe
- Eastern Europe
- Austria
- Russia & Belarus
- Türkiye
- Albania
- Rest of Eastern Europe
- Asia Pacific:
- China
- Taiwan
- India
- Japan
- Australia and New Zealand,
- ASEAN Countries (Singapore, Malaysia)
- South Korea
- Rest of APAC
- MEA: 
- GCC Countries
- Saudi Arabia
- United Arab Emirates (UAE)
- Qatar
- Kuwait
- Oman
- Bahrain
- South Africa
- Egypt
- Rest of MEA
- GCC Countries
A Seven-Phase Framework
Our methodology is designed to be universally applicable across commodity chemicals, specialty chemicals, petrochemicals, construction chemicals, coatings, electronic chemicals, industrial gases, agrochemicals, water treatment chemicals, and performance materials. Each phase builds upon the last, creating a layered validation structure that minimizes estimation error and maximizes analytical confidence.
The framework ensures comprehensive market coverage, robust cross-validation, and reliable long-term forecasting — producing market estimates that withstand scrutiny from investors, regulators, and corporate strategy teams.

Seven-Phase Framework — Analytical Effort Distribution
Relative analytical effort allocated across each phase of the Chemicals & Materials research framework

Phase 1 - Secondary Research: Establishing the Foundation
Secondary research collects and evaluates publicly available information from authoritative sources, establishing the foundational understanding of market structure, value chain dynamics, competitive landscape, and end-use demand patterns. Every source is evaluated for credibility, recency, geographic relevance, and methodological soundness before inclusion.
Industry Associations
Sources include ACC, CEFIC, ICCA, JCIA, CPCIF, and SOCMA providing production volumes, consumption trends, capacity developments, and sustainability initiatives.
Company Disclosures
Annual reports, investor presentations, earnings transcripts, and regulatory filings reveal product portfolios, manufacturing footprints, capacity expansions, and revenue segmentation.
Government Databases
National statistical offices, customs authorities, environmental agencies, and industrial production databases provide verified statistics on output, trade flows, and regulatory compliance.
Trade Databases
UN Comtrade, ITC, Eurostat, and national customs authorities enable assessment of global product movement, import dependency, and export competitiveness across regions.
Our Secondary Research Sources
- Ministry of Chemicals and Fertilizers
- European Chemicals Agency
- United States Department of Energy
- Ministry of Industry and Information Technology
- Ministry of Economy Trade and Industry
- Ministry of Trade Industry and Energy
- National Institute of Standards and Technology
- Council of Scientific and Industrial Research
- Fraunhofer Society
- National Institute for Materials Science
Phase 2 — Supply-Side Assessment: Mapping Production Capabilities
Production Capacity Analysis
All major manufacturers are assessed for existing installed capacity, planned additions, expansions, new plant announcements, and technology adoption — mapped at global, regional, and country levels.
Capacity Utilization Adjustment
Installed capacity is adjusted using utilization rates based on demand conditions, feedstock availability, plant operating rates, maintenance schedules, and regulatory restrictions.
Manufacturer Revenue Analysis
Product-specific revenues, segment-level performance, regional distribution, average selling prices, and margin trends are evaluated to establish market value estimates.
Supply-Side Assessment — Capacity vs. Effective Production by Region
Illustrative comparison of installed capacity vs. effective production volume (after utilization rate adjustment) across major regions

Phase 3 — Demand-Side Assessment: Quantifying Chemical Consumption
Demand-side analysis quantifies chemical consumption across industries, applications, and geographies — identifying where and how chemicals are consumed throughout the value chain with precision.
End-Use Industry Analysis
Chemical demand is evaluated across automotive, construction, packaging, electronics, agriculture, healthcare, consumer goods, industrial manufacturing, energy and utilities, and water treatment. Industry output, production trends, and consumption intensity are analyzed to determine demand patterns.
Consumption Modeling
Demand is estimated using measurable indicators: kilograms per vehicle, kilograms per square meter of construction, dosage per cubic meter of water treated, kilograms per hectare of agricultural land, and kilograms per ton of manufactured products. Consumption factors are validated through industry publications and primary interviews.
Application Analysis
The market is segmented by application area to understand product performance requirements, formulation trends, technology adoption, customer preferences, and regulatory requirements improving demand accuracy and segmentation granularity.
Demand-Side Assessment — End-Use Industry Demand Distribution
Illustrative distribution of chemical & materials demand across key end-use industries

Phase 4 - Trade Flow Analysis: Balancing Regional Supply and Demand
Trade flow analysis reconciles regional supply and demand estimates through import and export data, identifying net supply positions, regional dependencies, and market imbalances. It serves as an independent validation layer that tests the consistency of supply-side and demand-side estimates.
Import Analysis
Import data is evaluated to determine volumes, source countries, product dependency, regional supply gaps, and pricing trends — identifying markets that rely heavily on external supply and where domestic production is insufficient to meet demand.
Export Analysis
Export assessments reveal production surplus, export competitiveness, regional manufacturing strength, and global market participation. Export patterns also help validate domestic production estimates and identify net exporting regions.
Apparent Consumption Model
Regional consumption is assessed using the standard apparent consumption formula:
Results identify net importing regions, net exporting regions, regional deficits, and surpluses — serving as an independent validation of supply and demand estimates.
Trade Flow Analysis — Net Supply Position by Region
Illustrative apparent consumption vs. domestic production across major regions — positive gap indicates net import dependency

Phase 5 — Primary Research: The Critical Validation Layer
Primary research tests and refines findings from secondary research through direct engagement with industry participants across the supply chain, demand side, and expert community. It captures intelligence that no database or published report can provide — the real-world experience of manufacturers, buyers, and specialists operating in the market.

Supply-Side Interviews
Conversations with chemical manufacturers, raw material suppliers, contract manufacturers, technology providers, and plant operators cover production trends, capacity utilization, pricing developments, technology shifts, and competitive dynamics.

Demand-Side Interviews
Engagement with OEMs, industrial consumers, procurement managers, distributors, formulators, and end-use manufacturers focuses on consumption trends, purchasing behavior, product substitution, demand outlook, and emerging applications.

Industry Expert Consultations
Additional interviews with industry consultants, independent experts, regulatory specialists, technical professionals, and research institutions provide deeper market context and validate key analytical assumptions.
Focus Areas of Primary Research:
Market Size & Forecast Validation
Revenue estimates, volume consumption, growth rates, forecast assumptions, regional demand.Supply Chain & Value Chain Assessment
Raw material sourcing, supply chain challenges, distribution networks, procurement practices.Production & Capacity Analysis
Manufacturing capacity, utilization rates, expansion projects, plant investments.Pricing & Cost Structure Analysis
Product pricing trends, feedstock costs, energy costs, margin pressures, pricing outlook.Competitive Landscape Assessment
Volume and value estimates confirmed to be fully consistent with one another before publicationInterview Volume by Market Scope
| Study Scope | Number of Interviews |
|---|---|
| Niche Market | 20 – 30 |
| Mid-Sized Market | 30 – 50 |
| Global Market | 50 – 80 |
| Highly Fragmented Market | 80 – 120 |
Interview Details:
Category : Manufacturers, Suppliers, Distributors, End Users, Experts/Associations
Average Duration : 30–60 Minutes
Interview Mode : Video calls, telephonic interviews, expert consultations
Interview Format : Structured / Semi-Structured questionnaire
Focus Areas of Primary Research:
Market Size & Forecast Validation :
Revenue estimates, volume consumption, growth rates, forecast assumptions, regional demand.
Supply Chain & Value Chain Assessment :
Raw material sourcing, supply chain challenges, distribution networks, procurement practices.
Production & Capacity Analysis :
Manufacturing capacity, utilization rates, expansion projects, plant investments.
Pricing & Cost Structure Analysis :
Product pricing trends, feedstock costs, energy costs, margin pressures, pricing outlook.
Competitive Landscape Assessment :
Market share, competitor positioning, strategic initiatives, partnerships, acquisitions.
Primary Research — Stakeholder Coverage by Category
Distribution of interview respondents across stakeholder categories (% share from PPT data)

Primary Research — Respondent Designation Profile
Seniority breakdown of interview respondents (% share from PPT data)

Primary Research — Geographic Coverage of Interviews
Regional distribution of primary research engagement (% share from PPT data)

Phase 6 — Data Triangulation and Market Validation
No single methodology is relied upon in isolation. Multiple independent estimation approaches are combined and reconciled to ensure consistency, accuracy, and analytical defensibility. Any material deviations between approaches are investigated and adjusted through additional validation cycles.
The final market size is derived through weighted triangulation of all validated methodologies. Any material deviations between approaches are investigated and adjusted through additional validation cycles. The outcome represents the most realistic assessment of the market based on available evidence and expert confirmation ensuring that volume and value estimates are fully consistent with one another.
Triangulation Framework — Input Contribution Weight
Relative weight each sizing input contributes to the final reconciled market estimate

Phase 7 — Forecast Modeling: Projecting Future Market Evolution
Forecasting evaluates the future trajectory of the market using a combination of quantitative indicators and qualitative assessments across economic, industry, and regulatory dimensions. Rather than simple extrapolation, each driver is independently modeled and integrated into a composite forecast.
Macroeconomic Indicators
GDP growth, industrial production, manufacturing output, construction activity, consumer spending, and capital investment form the quantitative foundation of long-term demand projections. These are applied at country, regional, and global levels.
Industry Growth Drivers
Urbanization, infrastructure development, industrialization, technological innovation, sustainability initiatives, and evolving product performance requirements are assessed at regional and industry levels — capturing both structural and cyclical demand drivers.
Capacity Expansion Analysis
Announced plant expansions, new manufacturing facilities, technology upgrades, and strategic investments are evaluated to determine future supply-demand dynamics and potential market tightness or oversupply situations.
Regulatory & Sustainability
Environmental regulations, chemical safety standards, emission reduction targets, circular economy initiatives, and sustainability requirements are incorporated as they often influence product adoption rates and market growth trajectories.
Scenario Forecast Range — Indexed Market Growth (Year 1–10)
Illustrative indexed growth trajectories across Base, Optimistic, and Pessimistic scenarios over a 10-year forecast horizon

Forecast Drivers — Relative Impact Score by Category
Impact score (0–100) of each driver type on chemicals & materials market forecast




Comments
Share your thoughts, ask a question, or provide feedback about this report.