
Sodium Lauryl Ether Sulfate Market Size Analysis Report 2035
The global sodium lauryl ether sulfate market size was estimated at USD 4.95 billion in 2025 and is expected to increase from USD 5.12 billion in 2026 to USD 7.00 billion by 2035, growing at a CAGR of 3.52% from 2026 to 2035. North America dominated the sodium lauryl ether sulfate market with the largest revenue share of 40.00% in 2025.The increased need for better and more efficient cleaning products in versatile spaces has accelerated the industry's growth in recent years.
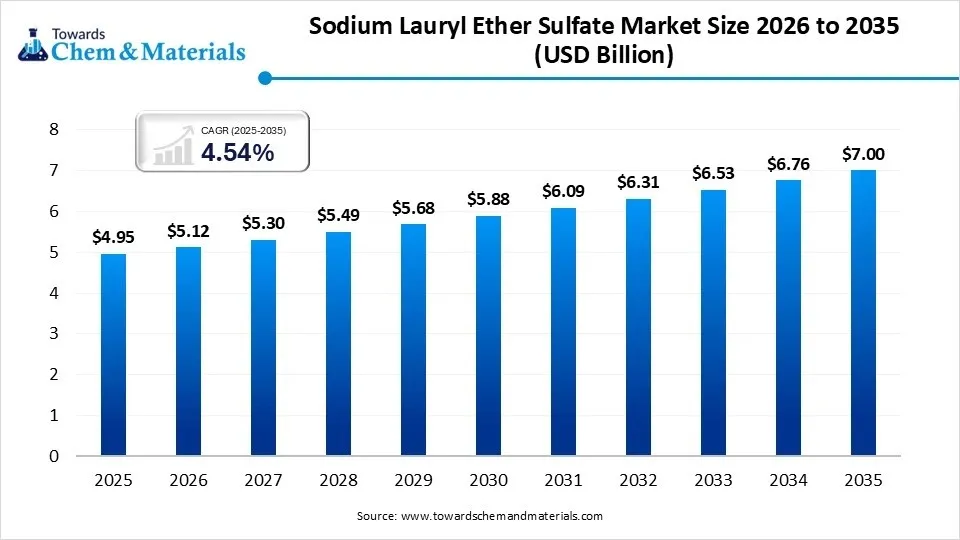
Market Highlights
- By region, North America dominated the sodium lauryl ether sulfate market with the largest share 40.00% in 2025, due to liquid cleaning and personal care products are used in large quantities every day across homes, hotels, hospitals, offices, and public places.
- By type, the sodium lauryl ether sulfate 70% segment dominated the market with the largest industry share 58.00% in 2025, owing to its offer of higher concentration, which gives manufacturers flexibility during product making.
- By type, the sodium lauryl ether sulfate 28% segment is expected to grow during the forecast period, due to it is easier to handle directly in smaller and medium production systems.
- By application, the personal care products segment dominated the market with the largest market share 55.00% in 2025, owing to shampoos, body washes, face cleansers, and liquid soaps using SLES in very large daily volumes.
- By application, the home care products segment is expected to grow during the forecast period, due to households now using many separate liquid cleaning products instead of one common cleaner.
- By grade, the technical grade segment dominated the market with a huge market share 65.00% in 2025, owing to many industrial and household cleaning products that do not require very high cosmetic purity.
- By grade, the cosmetic grade segment is expected to grow during the forecast period, due to personal care buyers increasingly expecting a smoother skin feel and controlled product quality.
- By functional type, the anionic segment dominated the market with the largest industry share 48.00% in 2025, owing to anionic surfactants creating strong foam and effective cleaning at a cost that works well for large-scale product manufacturing.
- By functional type, non-ionic segment is expected to grow during the forecast period, due to product makers increasingly wanting softer cleaning performance and better compatibility with other ingredients.
The Science Behind Superior Cleaning Foam
The cleaning ingredient, which is primarily used in products that help to remove dirt, oil, and grease while creating foam, is known as the sodium lauryl ether sulfate. Moreover, by helping water mix with oily dirt for efficient cleaning, the sodium lauryl ether sulfate has gained major industry attention form the personal care products and industrial cleaning manufacturers in recent years.
Recent Market Trends:
- The increased preferences towards the greater foam quality have driven the substantial financial gains in the manufacturing sector in the past few years. Several manufacturers focus on product richness and a premium look, where foam quality plays a major role.
- The shift towards flexible formulations has attracted increased capital and investment in manufacturing in the current period. Also, the SLES being very flexible, the demand is actively increasing in versatile products manufacturing, such as shampoos, dishwashing products, and others.
- The increasing need for efficient home cleaning products is expected to support stronger cash flows for the manufacturing enterprises during the forecast period, as the industry is shifted from personal care products to home cleaning products, where manufacturers are strongly focusing on flexible home cleaning product manufacturing.
Report Scope
| Report Attribute | Details |
| Market Size in 2026 | USD 5.12 Billion |
| Revenue Forecast in 2035 | USD 7.00 Billion |
| Growth Rate | CAGR 3.52% |
| Forecast Period | 2026 - 2035 |
| Base Year | 2025 |
| Dominant Region | North America |
| Segment Covered | By Type, By Grade, By Application, By Functional Type, By Region |
| Key companies profiled | Solvay SA, Evonik Industries AG, Croda International Plc, and Kraton Corporation |
Modern SLES Focuses on Formulation Excellence
The manufacturers are actively focusing on making SLES with better consistency and smoother formulation behavior. Earlier, many buyers mainly checked the cleaning strength. Now manufacturers also want stable viscosity, controlled foam performance, and easier blending with modern ingredients. In simple words, SLES is no longer judged only by cleaning ability but also by how smoothly it behaves inside the final product manufacturing.
Trade Analysis of the Sodium Lauryl Ether Sulfate Market:
Import, Export, Consumption, and Production Statistics
- The sodium lauryl ether sulfate has seen under the sophisticated export from 1,789 buyers and 1,241 exporters with 12,290 shipments as per the published report.
- China has observed the greater export of sodium lauryl ether sulfate, 7,058 shipments, while Vietnam (1,799 shipments) and India (1,079 shipments) are following.
- Also, Vietnam itself emerged as a heavy importer of sodium lauryl ether sulfate with 2,809 shipments, while Malaysia (1,008 shipments) and Mexico (949 shipments) are following.
Supply Chain Analysis of the Sodium Lauryl Ether Sulfate Market:
Distribution to Industrial Users
- Sodium Lauryl Ether Sulfate (SLES) is primarily distributed to industrial users in bulk drums or intermediate bulk containers (IBCs), typically at concentrations of 28% or 70%.
- Chemical distributors supply manufacturers in the personal care, detergent, and textile sectors, where it serves as a high-performance surfactant and foaming agent.
Chemical Synthesis and Processing
- Sodium Lauryl Ether Sulfate is synthesized through the ethoxylation of dodecyl alcohol, followed by sulfonation using sulfur trioxide or chlorosulfuric acid. The resulting acid is then neutralized with caustic soda (sodium hydroxide). This continuous process yields a versatile surfactant valued for its superior foaming and biodegradability in industrial applications.
Regulatory Compliance and Safety Monitoring
- Regulatory compliance for SLES involves adherence to REACH (EU) and FDA guidelines for personal care. Safety monitoring focuses on minimizing 1,4-dioxane byproducts, a potential carcinogen. Industrial users must maintain Safety Data Sheets (SDS), ensure proper PPE for handling, and monitor aquatic toxicity levels to meet environmental discharge standards.
Sodium Lauryl Ether Sulfate Market Regulatory Landscape: Global Regulations
| Country Region | Regulatory Body | Key Regulations | Focus Areas |
| United States | Environmental Protection Agency (EPA) | TSCA Section 6 (EPA risk evaluation); 21 CFR 700-740 (FDA Cosmetics) | Minimizing 1,4-dioxane (recommending 10 ppm for cosmetics); state-level bans (e.g., New York S.4389-B limits to 1 ppm for personal care/cleaning). |
| European Union | European Chemicals Agency (ECHA). | REACH (EC) No 1907/2006; Cosmetics Regulation (EC) No 1223/2009 |
Classification as a Substance of Very High Concern (SVHC); mandatory 1,4-dioxane trace limit of 10 ppm in finished cosmetic products. |
| China | Ministry of Ecology and Environment (MEE). | Technical Safety Specification for Cosmetics (2015); STSC | Recent revision of 1,4-dioxane limits in prohibited ingredients from 30 mg/kg down to 10 mg/kg to align with global standards. |
Segmental Insights
Type Insights
How did the Sodium Lauryl Ether Sulfate 70% Segment Dominate the Sodium Lauryl Ether Sulfate Market in 2025?
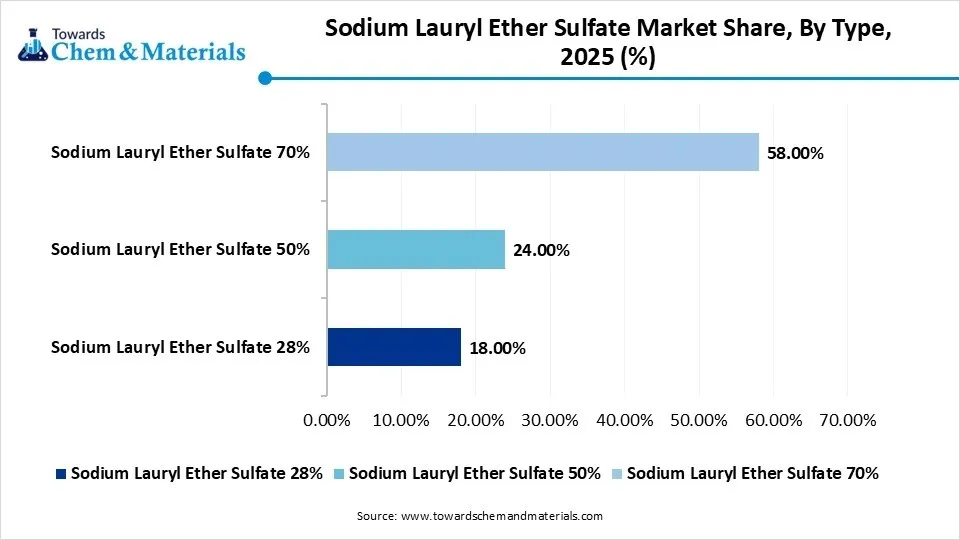
The sodium lauryl ether sulfate 70% segment dominated the market with the largest market share in 2025, due to its offer of higher concentration, which gives manufacturers flexibility during product making. Producers can dilute it according to the final formula needs, making it practical for large-scale production. Also, the concentrated material reduces transport volume because less water is carried during supply. Moreover, the buyers prefer concentrated material because it gives more control during formulation.
The sodium lauryl ether sulfate 28% segment is expected to grow with a rapid CAGR, owing to it is easier to handle directly in smaller and medium production systems. Since it already contains more water, manufacturers often need less dilution work before use. This saves preparation time in facilities where simplified production is important. Also, the easier handling may attract more buyers, especially where fast mixing and lower process complexity matter. Future demand may increase in flexible manufacturing environments where quick production changes happen regularly.
Sodium Lauryl Ether Sulfate Market Share, By Type, 2025 (%)
| By Type | Revenue Share, 2025 (%) |
| Sodium Lauryl Ether Sulfate 28% | 18.00% |
| Sodium Lauryl Ether Sulfate 50% | 24.00% |
| Sodium Lauryl Ether Sulfate 70% | 58.00% |
- The Segment Sodium Lauryl Ether Sulfate 28% Accounts for 18% of the market share, driven by its cost-effectiveness and usage in more affordable personal care products, but not dominating due to preference for higher concentrations.
- The segment Sodium Lauryl Ether Sulfate 50% Holds 24% of the market share, providing a balanced solution for personal care and cleaning products, gaining momentum due to its versatile performance across multiple industries.
- The segment Sodium Lauryl Ether Sulfate 70% Dominates with 58% of the market share, favored for its higher effectiveness in cleaning and foaming, preferred by industrial-scale manufacturers and higher-end products, cementing its leading position
Application Insights
How did the Personal Care Products Segment Dominate the Sodium Lauryl Ether Sulfate Market in 2025?
The personal care products segment dominated the market with the largest industry share 55% in 2025, due to shampoos, body washes, face cleansers, and liquid soaps using SLES in very large daily volumes. These products depend on foam, cleansing feel, and easy washing, which SLES supports well. Also, the personal care products are used repeatedly every day, creating stable ingredient demand. Moreover, daily personal washing creates a constant market need.
The home care products segment is expected to grow with a rapid CAGR, owing to households now using many separate Tiquid cleaning products instead of one common cleaner. Dishwash liquids, floor cleaners, kitchen cleaners, bathroom liquids, and handwash solutions all increase demand. Also, several homes now use more cleaning liquids than before. This wider household use may push home care demand higher than personal care later because product variety is expanding rapidly.
Sodium Lauryl Ether Sulfate Market Share, By Application, 2025 (%)
| By Application | Revenue Share, 2025 (%) |
| Personal Care Products | 55.00% |
| Home Care Products | 20.00% |
| Industrial Products | 15.00% |
| Other Applications | 10.00% |
- The Personal Care Products segment Accounts for 55% of the market share, driven by the high demand for SLES in shampoos, body washes, and soaps, dominating due to its effectiveness and affordability in consumer products.
- The Home Care Products segment Holds 20% of the market share, with significant use in detergents and surface cleaners, gaining momentum as the demand for household cleaning products continues to rise.
- The Industrial Products segment Represents 15% of the market share, used in industrial cleaners and emulsifiers, but not dominating due to the smaller scale of its application in comparison to personal care products.
- Other Applications Accounts for 10% of the market share, covering niche uses in various industries, but not a major contributor to market dominance due to its limited reach.
Grade Insights
How did the Technical Grade Segment Dominate the Sodium Lauryl Ether Sulfate Market in 2025?
The technical grade segment dominated the market share 65.00% in 2025, due to many industrial and household cleaning products do not require very high cosmetic purity. It gives effective cleaning performance and works well in detergents, cleaners, and bulk formulations. Moreover, the cost practicality, since technical grade fits large-volume production better. Also, where cleaning matters more than skin feel, technical grade becomes the practical choice.
The cosmetic grade segment is expected to grow with a rapid CAGR, owing to personal care buyers increasingly expecting a smoother skin feel and controlled product quality. Cosmetic formulations need better purity and a more stable appearance. Moreover, the products touching skin directly increasingly require cleaner formulation standards. This can push cosmetic-grade demand higher in future personal care expansion.
Sodium Lauryl Ether Sulfate Market Share, By Grade, 2025 (%)
| By Grade | Revenue Share, 2025 (%) |
| Technical Grade | 65.00% |
| Cosmetic Grade | 35.00% |
- The Technical Grade segment accounts for 65% of the market share, widely used in industrial and home care applications, dominating due to its cost-effectiveness and suitability for large-scale manufacturing.
- Cosmetic Grade segment holds 35% of the market share, preferred in personal care products for its higher purity, gaining momentum as consumer demand for high-quality ingredients in cosmetics rises.
Functional Type Insights
How did the Anionic Segment Dominate the Sodium Lauryl Ether Sulfate Market in 2025?
The anionic segment dominated the market with the largest industry share 48.00% in 2025, due to anionic surfactants creating strong foam and effective cleaning at a cost that works well for large-scale product manufacturing. Sodium lauryl ether sulfate itself belongs to this group, so many shampoos, liquid soaps, body washes, and detergents naturally depend on anionic function for daily performance. Furthermore, the anionic ingredients remove oil, sweat, and dirt quickly, which gives visible cleaning results that users easily notice.
The non-ionic segment is expected to grow with a rapid CAGR, owing to product makers increasingly wanting softer cleaning performance and better compatibility with other ingredients. Non- ionic surfactants usually create a milder cleansing effect, which becomes useful when products are designed for sensitive skin, gentle household cleaning, or balanced formulations. Moreover, the non-ionic materials often work well in mixed systems where foam control and texture need careful adjustment.
Sodium Lauryl Ether Sulfate Market Share, By Functional Type, 2025 (%)
| By Functional Type | Revenue Share, 2025 (%) |
| Anionic | 48.00% |
| Non-ionic | 20.00% |
| Cationic | 15.00% |
| Amphoteric | 17.00% |
- The Anionic segment accounts for 48% of the market share, favored for its strong surfactant properties, dominating due to its effectiveness in cleaning and foaming applications.
- The Non-ionic segment holds 20% of the market share, used in applications requiring gentler surfactants, gaining momentum as demand for mild and skin-friendly products increases.
- The Cationic segment represents 15% of the market share, commonly used in conditioning products, but not dominating due to its more limited application compared to anionic types.
- The Amphoteric segment accounts for 17% of the market share, valued for its versatility in both acidic and alkaline environments, gaining momentum in personal care and specialty products.
Regional Insights
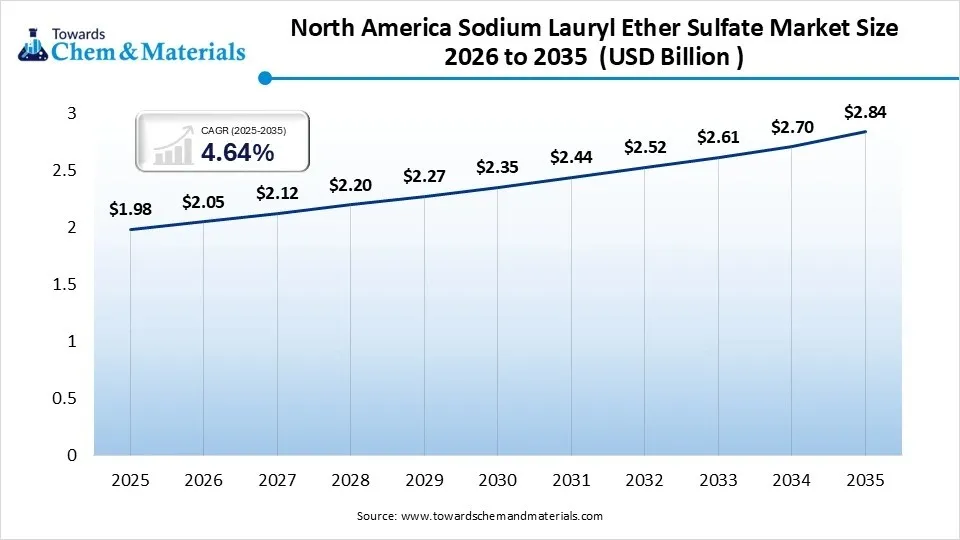
The North America sodium lauryl ether sulfate market size was valued at USD 1.98 billion in 2025 and is expected to be worth around USD 2.84 billion by 2035, exhibiting at a compound annual growth rate (CAGR) of 3.67% over the forecast period from 2026 to 2035. North America dominated the sodium lauryl ether sulfate market with the largest market share 40.00% in 2025, due to liquid cleaning and personal care products are used in large quantities every day across homes, hotels, hospitals, offices, and public places. Moreover, the products such as shampoos, body wash, handwash liquids, dishwashing liquids, and floor cleaners all need sodium lauryl ether sulphate for foam and cleaning performance. Another reason is that buyers in this region often prefer ready-to-use liquid products instead of solid cleaning formats, which increases ingredient demand.
United States Leads Diverse Cleaning Product Market
The United States maintained its dominance in the market, owing to the high product variety across personal care and home cleaning categories. Moreover, the one supermarket alone may offer many shampoo types, body wash liquids, hand soaps, dish cleaners, and specialty cleansers, and many of them use sodium lauryl ether sulphate in their formula. Also, consumers often buy different liquid products for different cleaning purposes instead of using one common product in the country.
Sodium Lauryl Ether Sulfate Market Evaluation in the Asia Pacific
Asia Pacific is expected to capture a major share of the sodium lauryl ether sulfate market with a rapid CAGR, owing to population growth and rising product use, which is increasing liquid cleaning demand across both cities and smaller towns. Moreover, the households now use liquid shampoo, handwash, body wash, dishwashing liquid, and floor cleaning products regularly. Earlier, some homes used fewer separate products, but now product variety is increasing quickly. Also, the many local brands are expanding, which increases ingredient demand from manufacturing units.
China Boosting Global SLES Market Growth
China is expected to emerge as a prominent country for the sodium lauryl ether sulfate market in the coming years, due to the country producing very large volumes of personal care and home cleaning products for both local use and manufacturing supply chains. Moreover, many factories produce shampoos, liquid soaps, detergents, and cleaning liquids every day, creating a strong need for sodium lauryl ether sulphate. Another reason is that many product types are sold across different price levels, so production volume remains high in many categories together.
Europe Sodium Lauryl Ether Sulfate Market Examination
Europe expects the notable growth in the market, owing to consumers increasingly choosing liquid cleaning and personal care products that offer specific benefits such as softness, balanced foam, and controlled washing feel. This increases demand for ingredients that work reliably inside different formulas. Also, many product makers now create more specialized liquid products instead of basic standard formulas.
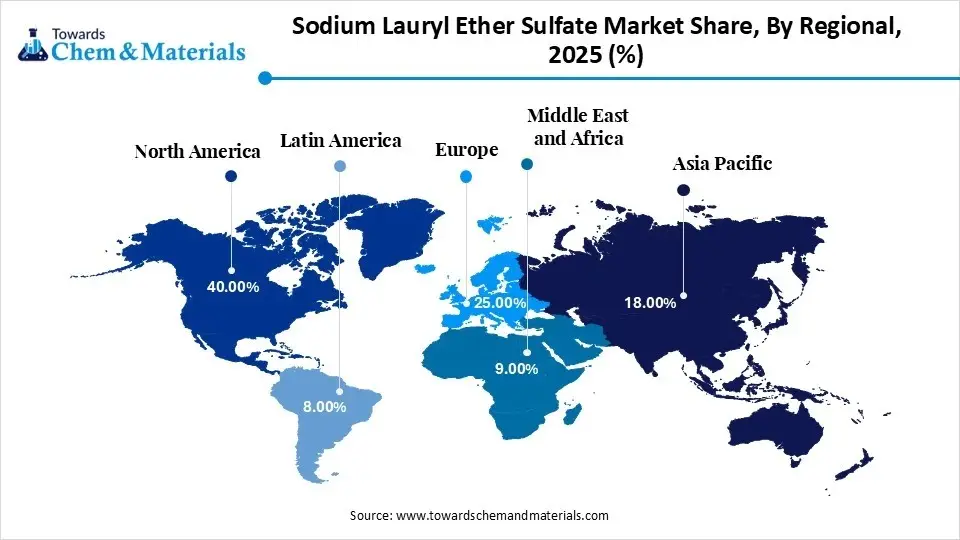
Sodium Lauryl Ether Sulfate Market Share, By Regional, 2025 (%)
| Regional | Revenue Share, 2025 (%) |
| North America | 40.00% |
| Europe | 25.00% |
| Asia Pacific | 18.00% |
| Latin America | 8.00% |
| Middle East & Africa | 9.00% |
- The North America share of 40.00% in 2025 Dominates due to high demand for consumer products and detergents, with leading manufacturers and technological advancements in production."
- The Europe share of 25.00% in 2025 Significant presence of key chemical companies and stringent environmental regulations, contributing to steady growth despite regional challenges."
- The share Asia Pacific 18.00% in 2025 Gaining momentum with increasing production in emerging economies, driven by rising demand in household and personal care products."
- The Latin America share of 8.00% in 2025 Relatively smaller share due to less advanced manufacturing and slower market adoption of SLES in comparison to other regions."
- The Middle East & Africa share of 9.00% in 2025 "Experiencing momentum growth with expanding industrial activities and rising demand for personal care products in emerging markets."
High Quality Standards Boost SLES Adoption
Germany is expected to gain a significant industry share owing to because many personal care and home care products there focus strongly on stable texture, controlled foam, and consistent product quality. Moreover, sodium lauryl ether sulphate helps manufacturers maintain these qualities in liquid formulas used daily by consumers. Also, many products are designed for specific cleaning needs, such as hair care, skin care, kitchen cleaning, and delicate surface cleaning.
Top Vendors in the Sodium Lauryl Ether Sulfate Market & Their Offerings:
- BASF SE: As the world's largest chemical producer, Germany-based BASF operates through six segments, including "Nutrition & Care," which manufactures high-performance surfactants like SLES. In 2026, the company is prioritizing sustainability by transitioning its Ludwigshafen portfolio to renewable energy and launching industrial-scale 3D-printed catalysts to improve production efficiency and lower carbon footprints.
- Huntsman Corporation: Headquartered in Texas, Huntsman is a global leader in differentiated and specialty chemicals for industries like personal care and automotive. In March 2026, it expanded its Performance Products facility in Hungary to meet growing demand for amine catalysts. The company focuses on innovative materials that reduce emissions and energy consumption in consumer goods.
- Clariant AG: This Swiss specialty chemicals firm serves the personal care and home care sectors through its "Care Chemicals" unit. In early 2026, Clariant announced a significant expansion of pharmaceutical-grade PEG production in Texas. The company is actively restructuring to improve margins, recently selling its Venezuelan business while investing in sustainable crop protection and advanced surfactants for global markets.
- Stepan Company: A major U.S.-based manufacturer, Stepan is a primary producer of surfactants used in detergents and personal care products. Under its "Project Catalyst" initiative, the company is currently optimizing its manufacturing footprint by closing older sites and ramping up its new Pasadena alkoxylation facility to achieve 80% utilization by late 2026.
- Solvay SA
- Evonik Industries AG
- Croda International Plc
- Kraton Corporation
- AkzoNobel N.V.
Segments Covered in the Report
By Type
- Sodium Lauryl Ether Sulfate
- Sodium Lauryl Ether Sulfate
- Sodium Lauryl Ether Sulfate
By Grade
- Technical Grade
- Cosmetic Grade
By Application
- Personal Care Products
- Home Care Products
- Industrial Products
By Functional Type
- Anionic
- Non-ionic
- Cationic
- Amphoteric
By Region
- North America
- U.S.
- Canada
- Mexico
- Europe
- Germany
- UK
- France
- Italy
- Spain
- Asia Pacific
- China
- India
- Japan
- South Korea
- Latin America
- Brazil
- Argentina
- Middle East & Africa
- Saudi Arabia
- South Africa
A Seven-Phase Framework
Our methodology is designed to be universally applicable across commodity chemicals, specialty chemicals, petrochemicals, construction chemicals, coatings, electronic chemicals, industrial gases, agrochemicals, water treatment chemicals, and performance materials. Each phase builds upon the last, creating a layered validation structure that minimizes estimation error and maximizes analytical confidence.
The framework ensures comprehensive market coverage, robust cross-validation, and reliable long-term forecasting — producing market estimates that withstand scrutiny from investors, regulators, and corporate strategy teams.

Seven-Phase Framework — Analytical Effort Distribution
Relative analytical effort allocated across each phase of the Chemicals & Materials research framework

Phase 1 - Secondary Research: Establishing the Foundation
Secondary research collects and evaluates publicly available information from authoritative sources, establishing the foundational understanding of market structure, value chain dynamics, competitive landscape, and end-use demand patterns. Every source is evaluated for credibility, recency, geographic relevance, and methodological soundness before inclusion.
Industry Associations
Sources include ACC, CEFIC, ICCA, JCIA, CPCIF, and SOCMA providing production volumes, consumption trends, capacity developments, and sustainability initiatives.
Company Disclosures
Annual reports, investor presentations, earnings transcripts, and regulatory filings reveal product portfolios, manufacturing footprints, capacity expansions, and revenue segmentation.
Government Databases
National statistical offices, customs authorities, environmental agencies, and industrial production databases provide verified statistics on output, trade flows, and regulatory compliance.
Trade Databases
UN Comtrade, ITC, Eurostat, and national customs authorities enable assessment of global product movement, import dependency, and export competitiveness across regions.
Our Secondary Research Sources
- Ministry of Chemicals and Fertilizers
- European Chemicals Agency
- United States Department of Energy
- Ministry of Industry and Information Technology
- Ministry of Economy Trade and Industry
- Ministry of Trade Industry and Energy
- National Institute of Standards and Technology
- Council of Scientific and Industrial Research
- Fraunhofer Society
- National Institute for Materials Science
Phase 2 — Supply-Side Assessment: Mapping Production Capabilities
Production Capacity Analysis
All major manufacturers are assessed for existing installed capacity, planned additions, expansions, new plant announcements, and technology adoption — mapped at global, regional, and country levels.
Capacity Utilization Adjustment
Installed capacity is adjusted using utilization rates based on demand conditions, feedstock availability, plant operating rates, maintenance schedules, and regulatory restrictions.
Manufacturer Revenue Analysis
Product-specific revenues, segment-level performance, regional distribution, average selling prices, and margin trends are evaluated to establish market value estimates.
Supply-Side Assessment — Capacity vs. Effective Production by Region
Illustrative comparison of installed capacity vs. effective production volume (after utilization rate adjustment) across major regions

Phase 3 — Demand-Side Assessment: Quantifying Chemical Consumption
Demand-side analysis quantifies chemical consumption across industries, applications, and geographies — identifying where and how chemicals are consumed throughout the value chain with precision.
End-Use Industry Analysis
Chemical demand is evaluated across automotive, construction, packaging, electronics, agriculture, healthcare, consumer goods, industrial manufacturing, energy and utilities, and water treatment. Industry output, production trends, and consumption intensity are analyzed to determine demand patterns.
Consumption Modeling
Demand is estimated using measurable indicators: kilograms per vehicle, kilograms per square meter of construction, dosage per cubic meter of water treated, kilograms per hectare of agricultural land, and kilograms per ton of manufactured products. Consumption factors are validated through industry publications and primary interviews.
Application Analysis
The market is segmented by application area to understand product performance requirements, formulation trends, technology adoption, customer preferences, and regulatory requirements improving demand accuracy and segmentation granularity.
Demand-Side Assessment — End-Use Industry Demand Distribution
Illustrative distribution of chemical & materials demand across key end-use industries

Phase 4 - Trade Flow Analysis: Balancing Regional Supply and Demand
Trade flow analysis reconciles regional supply and demand estimates through import and export data, identifying net supply positions, regional dependencies, and market imbalances. It serves as an independent validation layer that tests the consistency of supply-side and demand-side estimates.
Import Analysis
Import data is evaluated to determine volumes, source countries, product dependency, regional supply gaps, and pricing trends — identifying markets that rely heavily on external supply and where domestic production is insufficient to meet demand.
Export Analysis
Export assessments reveal production surplus, export competitiveness, regional manufacturing strength, and global market participation. Export patterns also help validate domestic production estimates and identify net exporting regions.
Apparent Consumption Model
Regional consumption is assessed using the standard apparent consumption formula:
Results identify net importing regions, net exporting regions, regional deficits, and surpluses — serving as an independent validation of supply and demand estimates.
Trade Flow Analysis — Net Supply Position by Region
Illustrative apparent consumption vs. domestic production across major regions — positive gap indicates net import dependency

Phase 5 — Primary Research: The Critical Validation Layer
Primary research tests and refines findings from secondary research through direct engagement with industry participants across the supply chain, demand side, and expert community. It captures intelligence that no database or published report can provide — the real-world experience of manufacturers, buyers, and specialists operating in the market.

Supply-Side Interviews
Conversations with chemical manufacturers, raw material suppliers, contract manufacturers, technology providers, and plant operators cover production trends, capacity utilization, pricing developments, technology shifts, and competitive dynamics.

Demand-Side Interviews
Engagement with OEMs, industrial consumers, procurement managers, distributors, formulators, and end-use manufacturers focuses on consumption trends, purchasing behavior, product substitution, demand outlook, and emerging applications.

Industry Expert Consultations
Additional interviews with industry consultants, independent experts, regulatory specialists, technical professionals, and research institutions provide deeper market context and validate key analytical assumptions.
Focus Areas of Primary Research:
Market Size & Forecast Validation
Revenue estimates, volume consumption, growth rates, forecast assumptions, regional demand.Supply Chain & Value Chain Assessment
Raw material sourcing, supply chain challenges, distribution networks, procurement practices.Production & Capacity Analysis
Manufacturing capacity, utilization rates, expansion projects, plant investments.Pricing & Cost Structure Analysis
Product pricing trends, feedstock costs, energy costs, margin pressures, pricing outlook.Competitive Landscape Assessment
Volume and value estimates confirmed to be fully consistent with one another before publicationInterview Volume by Market Scope
| Study Scope | Number of Interviews |
|---|---|
| Niche Market | 20 – 30 |
| Mid-Sized Market | 30 – 50 |
| Global Market | 50 – 80 |
| Highly Fragmented Market | 80 – 120 |
Interview Details:
Category : Manufacturers, Suppliers, Distributors, End Users, Experts/Associations
Average Duration : 30–60 Minutes
Interview Mode : Video calls, telephonic interviews, expert consultations
Interview Format : Structured / Semi-Structured questionnaire
Focus Areas of Primary Research:
Market Size & Forecast Validation :
Revenue estimates, volume consumption, growth rates, forecast assumptions, regional demand.
Supply Chain & Value Chain Assessment :
Raw material sourcing, supply chain challenges, distribution networks, procurement practices.
Production & Capacity Analysis :
Manufacturing capacity, utilization rates, expansion projects, plant investments.
Pricing & Cost Structure Analysis :
Product pricing trends, feedstock costs, energy costs, margin pressures, pricing outlook.
Competitive Landscape Assessment :
Market share, competitor positioning, strategic initiatives, partnerships, acquisitions.
Primary Research — Stakeholder Coverage by Category
Distribution of interview respondents across stakeholder categories (% share from PPT data)

Primary Research — Respondent Designation Profile
Seniority breakdown of interview respondents (% share from PPT data)

Primary Research — Geographic Coverage of Interviews
Regional distribution of primary research engagement (% share from PPT data)

Phase 6 — Data Triangulation and Market Validation
No single methodology is relied upon in isolation. Multiple independent estimation approaches are combined and reconciled to ensure consistency, accuracy, and analytical defensibility. Any material deviations between approaches are investigated and adjusted through additional validation cycles.
The final market size is derived through weighted triangulation of all validated methodologies. Any material deviations between approaches are investigated and adjusted through additional validation cycles. The outcome represents the most realistic assessment of the market based on available evidence and expert confirmation ensuring that volume and value estimates are fully consistent with one another.
Triangulation Framework — Input Contribution Weight
Relative weight each sizing input contributes to the final reconciled market estimate

Phase 7 — Forecast Modeling: Projecting Future Market Evolution
Forecasting evaluates the future trajectory of the market using a combination of quantitative indicators and qualitative assessments across economic, industry, and regulatory dimensions. Rather than simple extrapolation, each driver is independently modeled and integrated into a composite forecast.
Macroeconomic Indicators
GDP growth, industrial production, manufacturing output, construction activity, consumer spending, and capital investment form the quantitative foundation of long-term demand projections. These are applied at country, regional, and global levels.
Industry Growth Drivers
Urbanization, infrastructure development, industrialization, technological innovation, sustainability initiatives, and evolving product performance requirements are assessed at regional and industry levels — capturing both structural and cyclical demand drivers.
Capacity Expansion Analysis
Announced plant expansions, new manufacturing facilities, technology upgrades, and strategic investments are evaluated to determine future supply-demand dynamics and potential market tightness or oversupply situations.
Regulatory & Sustainability
Environmental regulations, chemical safety standards, emission reduction targets, circular economy initiatives, and sustainability requirements are incorporated as they often influence product adoption rates and market growth trajectories.
Scenario Forecast Range — Indexed Market Growth (Year 1–10)
Illustrative indexed growth trajectories across Base, Optimistic, and Pessimistic scenarios over a 10-year forecast horizon

Forecast Drivers — Relative Impact Score by Category
Impact score (0–100) of each driver type on chemicals & materials market forecast




Comments
Share your thoughts, ask a question, or provide feedback about this report.