
Silica Nanocomposite Polymers Market Size, Trends, and Forecast 2026-2035
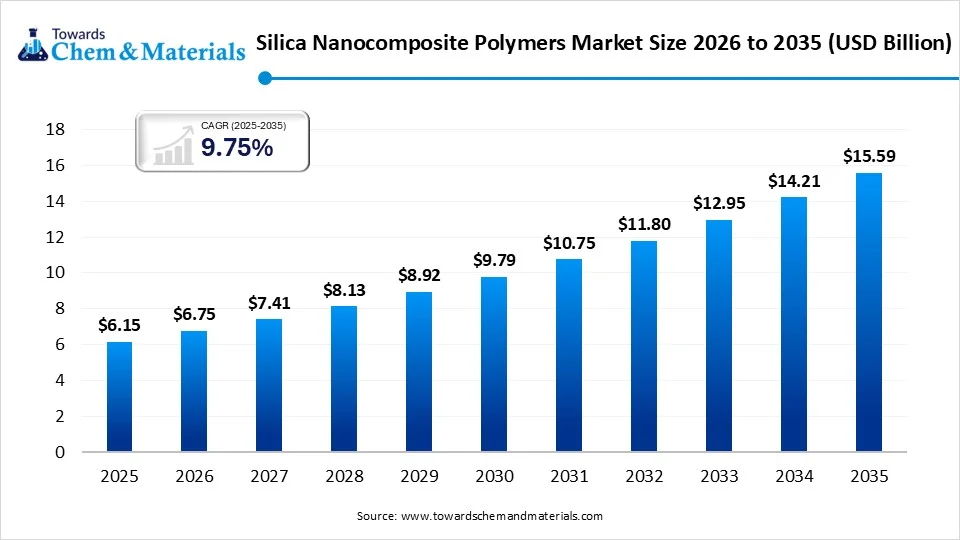
The silica nanocomposite polymers market size was valued at USD 6.15 billion in 2025, is estimated to reach USD 6.75 billion in 2026, and is projected to reach USD 15.59 billion by 2035, exhibiting a compound annual growth rate (CAGR) of 9.75% over the forecast period from 2026 to 2035. Market opportunities are growing even more as adoption continues to rise across the automotive, aerospace, electronics, coatings, and industrial applications. Development is aided by technological advancements in surface functionalization, dispersion control, sol-gel synthesis, and intelligent polymer systems. The increasing focus on efficiency of materials and improved performance is also driving manufacturers to expand silica nanocomposite polymer usage.
The integration of organic polymer with inorganic nanosilica to create multifunctional material with improved performance is expected to be one of the key strategies for the growth of the silica nanocomposite polymer market. Silica nanoparticles can enhance structural integrity, thermal stability, barrier function, wear resistance, and dimensional control for various polymer matrices. Applications include automotive and aerospace lightweighting and coatings with enhanced hardness, scratch resistance, and corrosion protection.
Key Takeaways
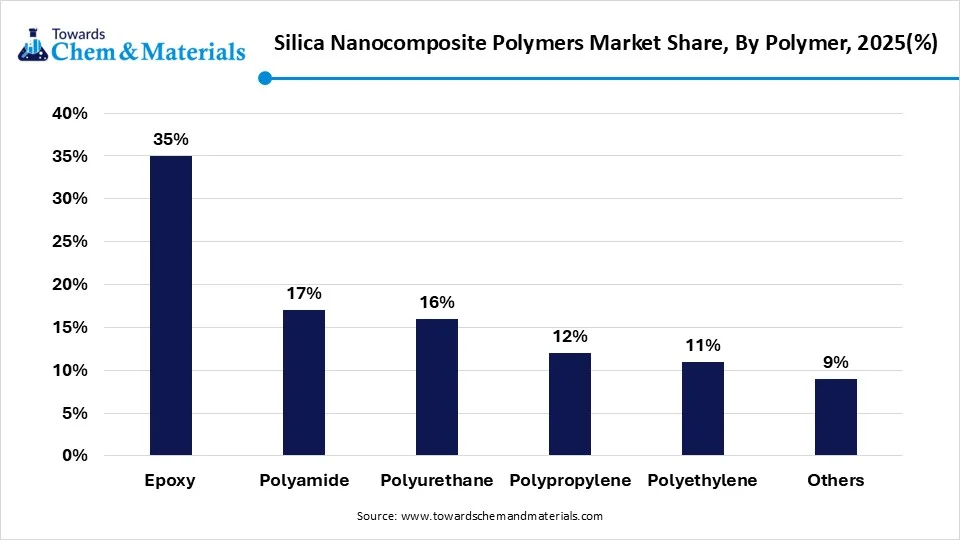
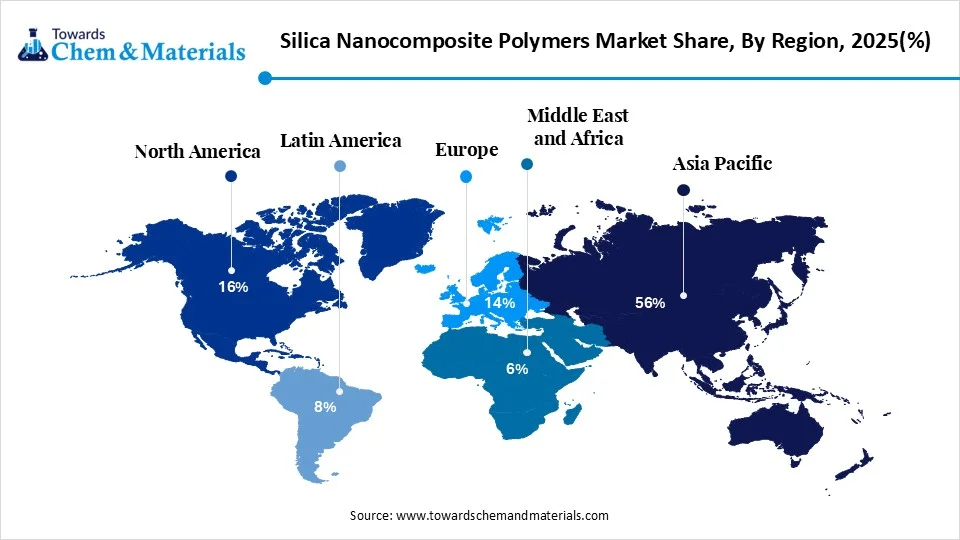
- Asia Pacific dominated the silica nanocomposite polymers market by holding a 56.1% share in 2025 and is expected to grow at a CAGR of 9.1% during the forecast period.
- North America held a 15.8% market share in 2025 and is expected to grow at the fastest CAGR of 10.2% during the forecast period.
- By polymer, the epoxy segment dominated the market with the largest share of 35.4% in 2025 and is expected to grow at a CAGR of 10.3% during the forecast period.
- By polymer, the polyamide segment held a 17.2% market share in 2025 and is expected to grow at the fastest CAGR of 11% during the forecast period.
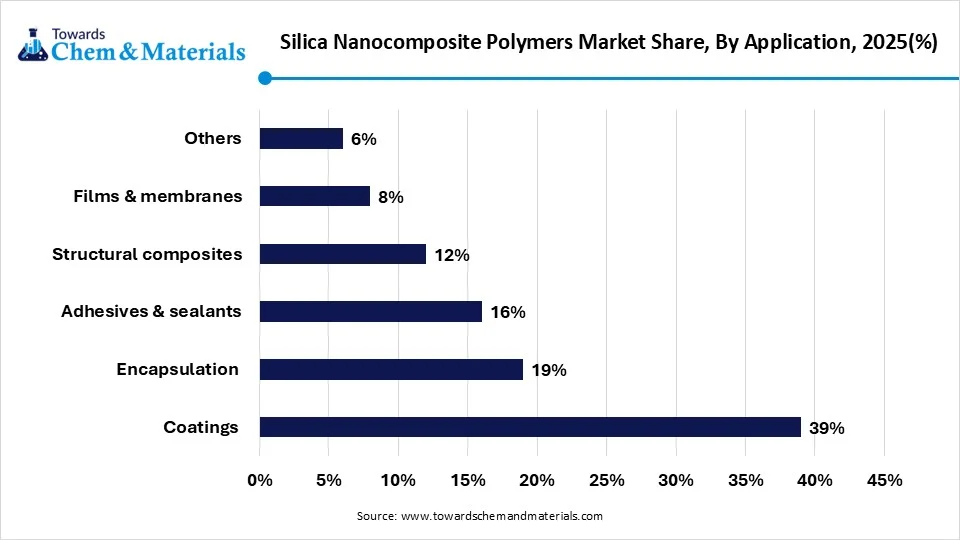
- By application, the coatings segment dominated the market with the largest share of 39.3% in 2025 and is expected to grow at a CAGR of 10.2% during the forecast period.
- By application, the encapsulation segment held 19.4% market share in 2025 and is expected to grow at the fastest CAGR of 10.8% during the forecast period.
Global Investment Movement for the Silica Nanocomposite Polymers Market
- Complementary silica/silane assets are being combined by chemical companies in order to enhance innovation power and operational efficiency and shorten the time to product development for applications.
- For instance, in January 2025, Evonik Industries AG united its Silica and Silanes business units into one company, thereby improving the coordination of technology development: Smart Effects.
- An extremely competitive environment involving investment activity is emerging around the specialized nanomaterial capabilities, allowing established organizations to gain access to IP, process know-how, and commercialization routes.
- Manufacturers are turning to investing in customized silica formulations that are developed in collaboration with downstream OEMs, especially in electronics, automotive, and advanced engineering.
Silica Nanocomposite Polymers Market Trends
- The application of silica surface treatments and interfacial engineering is becoming more important for manufacturers due to the increased dispersion, which enhances compatibility and prevents nanoparticle agglomeration in polymer matrices.
- Silica nanocomposites are a subject of intensive investigation by automotive manufacturers for mechanical strength, abrasion resistance, thermal stability, and lightweight components for both traditional and new mobility solutions.
- Silica-filled polymer systems are becoming more popular as a means to thermal management, dimensional stability, electrical insulation, and reliable encapsulation, which is driven by the miniaturization of electronics.
- Thermoplastics are still significant because the traditional process provides an avenue for integration, and the use of high-temperature thermosets is growing in the aerospace and wind-energy sectors.
Key Technological Shifts and AI in the Silica Nanocomposite Polymers Market
The revolution of Artificial Intelligence (AI) in silica nanocomposite development is changing how materials are developed, replacing traditional trial-and-error approaches with predictive, data-driven methods. AI models can analyze correlations between dispersion of nanoparticles, polymer matrices, processing parameters, and performance of materials. Microimaging analysis can be useful for characterizing dispersion quality and for determining processing conditions that lead to nanoparticle agglomeration. Multi-objective optimization of tensile strength, toughness, thermal stability, barrier properties, and processing properties is also possible with AI.
Supply Chain Analysis of the Silica Nanocomposite Polymers Market
Feedstock Procurement
- The feedstock procurement is the process of procuring high-purity silicon precursors, silica materials, base polymer monomers, and other inputs used in silica nanocomposite production.
- In order to ensure controlled nanoparticle synthesis, polymer compatibility, formulation consistency, and downstream processing, it is necessary to have a consistent source of feedstocks.
- Advanced composite manufacturing requires stable material feedstocks from high-purity fumed silica products from Cabot Corporation, which are supplied around the world.
- Other Key Players: Wacker Chemie AG, Tokuyama Corporation, and Solvay.
Chemical Synthesis and Processing
- Chemical synthesis and processing refers to the technique of synthesizing and functionalizing silica nanoparticles to enhance chemical bonding and compatibility with polymer matrices.
- By controlling their synthesis and surface modification, particle dispersion, particle-particle interaction, particle/thermal performance, and consistency can be controlled in various polymer systems.
- Highly uniform, surface-modified nanosilica concentrates, such as NANOPOX, for direct polymer matrix integration, developed by Evonik Industries AG.
- Other key players: Arkema, BASF SE, and Admatechs Co., Ltd.
Compound Formulation and Blending
- Compound formulation and blending is the dispersion of the functionalized silica nanoparticles in a thermoplastic or thermoset resin matrix by controlled mechanical processing.
- Uniform blending is used to ensure uniformity in finished silica nanocomposite polymer formulations in physical, thermal, barrier, and mechanical properties.
- RTP Company designates performance thermoplastic matrices through precision-blending of nanosilica additives to improve physical, thermal, and barrier properties.
- Other Key Players: Allnex, BYK-Chemie, and SABIC.
Sustainability Analysis:
The silica nanocomposite polymers represent a way of sustainable material development due to their enhanced performance and material reduction opportunities that enable a longer product lifetime. Improved strength, stiffness, barrier, and thermal resistance will allow manufacturers to use more efficient material designs to meet required functionality. By providing greater resistance to ultraviolet degradation, thermal stress, and mechanical wear, the service life of the product can be extended, and replacement frequency can be decreased.
What are silica nanocomposite polymers?
Silica nanocomposite polymers are composite materials that consist of polymer matrices with nanosized silica particles to provide improvements in mechanical, thermal, barrier, dimensional, electrical, or surface properties. Typical matrices are epoxy, polyamide, polyurethane, polypropylene, polyethylene, and specialty engineering polymers intended to serve high-demand applications.
Uses of Silica Nanocomposite Polymers
- Silica nanocomposites offer benefits such as improved mechanical strength, wear resistance, dimensional stability, and thermal stability, ideal for lightweight automotive parts that demand high durability while maintaining material properties.
- Silica nanocomposites enhance coating hardness, scratch resistance, abrasion resistance, corrosion protection, and optical properties, which are suitable for applications in the automotive, architectural, and industrial fields, and protection against corrosion.
- Polymer systems that are filled with silica are used for thermal stability, dimensional control, electrical insulation and protection, semiconductor encapsulation, power electronics applications, LED systems, and sensor technologies.
Pricing Analysis for the Silica Nanocomposite Polymers Market
The price of silica nanocomposite polymers is affected by their dispersion, the specific requirements for polymer specialization, the quality of dispersion, the complexity of the synthesis, and the requirements for the specific application for which they are intended. As do commodity polymer systems, but typically higher value in advanced engineering matrices. Any manufacturing process that demands a stringent degree of nanoparticle dispersion can demand more processing and quality control.
Silica Nanocomposite Polymers Market: Global Trade Analysis
The demand for engineered materials that are lightweight, durable, and high-performance is driving the growth of silica nanocomposite polymer trade globally. Specialized polymer systems are transported internationally to support such uses as automotive lightweighting, electronics miniaturization, semiconductor packaging, and protective coatings. Processing complexity, agglomeration of nanoparticles, specific surface treatments, regulatory demands, production cost, and logistics cost are also influential factors in trade.
Regulatory Framework: Silica Nanocomposite Polymers Market
| Country Region | Regulatory Body | Key Regulations | Focus Areas |
| Asia Pacific | Ministry of Economy, Trade and Industry (METI) | Chemical Substances Control Law (CSCL) | Voluntary and mandatory reporting on manufacturing volumes and occupational health risk assessments. |
| North America | Environmental Protection Agency (EPA) | TSCA (Toxic Substances Control Act) | Pre-Manufacture Notices (PMNs) required for new nanoscale materials before market entry. |
| European Union | European Chemicals Agency (ECHA) | REACH (Regulation (EU) 2018/1881 amendment) | Mandatory technical registration dossiers for specific nanoforms manufactured/imported |
Segmental Insights
Polymer Insights
Epoxy Dominated the Silica Nanocomposite Polymers Market with 35.4% of Market Share in 2025
The epoxy segment dominated the market with 35.4% market share in 2025 and is expected to grow at a CAGR of 10.3% during the forecast period, as silica reinforcement gives enhanced mechanical strength, thermal stability, dimensional stability, electrical insulation, and surface performance. For coatings, adhesives, electronics, composites, and industrial use where durability is a requirement. Opportunities for silica-enhanced polymer systems are further expanding in demanding industrial applications as the formulations of sustainable epoxy and advanced curing technologies continue to be developed.
- For instance, in February 2025, Westlake Corporation announced that Westlake Epoxy would be launching EpoVIVE at JEC World in Paris, providing sustainable epoxy attributes throughout products to assist customers' sustainability efforts.
The polyamide segment held a 17.2% market share in 2025 and is expected to grow at the fastest CAGR of 11% during the forecast period. Lightweight engineering polymers are replacing in increasing volume of the electronics, automotive, and industrial applications, which is driving the growth of polyamide segment. Strength, thermal stability, dimensional performance, and durability can be enhanced with silica reinforcement, which can also help in the development of lightweight components. Improved demands for compact and efficient products are driving manufacturers to develop a range of special formulations of polyamides with a balance of structural and processability properties.
Silica Nanocomposite Polymers Market Share, By Polymer, 2025(%)
| By Polymer | Market Share (%) |
| Epoxy | 35% |
| Polyamide | 17% |
| Polyurethane | 16% |
| Polypropylene | 12% |
| Polyethylene | 11% |
| Others | 9% |
- For instance, in October 2025, Syensqo launched Kalix LD-4850 BK000, a low-density, high-performance polyamide designed for lightweight consumer electronics parts.
Application Insights
The Coatings Segment Dominated the Silica Nanocomposite Polymers Market with 39.3% of Market Share in 2025
The coatings segment dominated the market with the largest share of 39.3% in 2025 and is expected to grow at a CAGR of 10.2% during the forecast period, due to the ability of silica nanocomposites to increase the hardness, scratch resistance, abrasion resistance, corrosion resistance, and surface durability of coatings. These properties are beneficial for automotive, industrial, architectural, protective, and electronics coatings with longer-lasting requirements. Water-based polymer technologies are also being developed, which is helping to shape sustainable coating formulations and is boosting the potential for more advanced silica-reinforced systems in industrial and commercial applications.
- For instance, in April 2026, Wyn Polymers ordered a new water-based polymer reactor in Mexico to help create sustainable coatings, adhesives, paints and fabrics.
The encapsulation segment held a 19.4% market share in 2025 and is expected to grow at the fastest CAGR of 10.8% during the forecast period, as the electronics industry is growing and demands polymer systems that deliver thermal stability, electrical insulation, dimensional control, and guaranteed protection of components. The silica-filled polymers can be used to support semiconductor, power electronics, LED, and sensor applications. As electronics continue to shrink, there is a growing need for materials that will maintain performance in high-temperature operating environments and to which electronic parts are not sensitive.
Silica Nanocomposite Polymers Market Share, By Application, 2025(%)
| By Application | Market Share (%) |
| Coatings | 39% |
| Encapsulation | 19% |
| Adhesives & sealants | 16% |
| Structural composites | 12% |
| Films & membranes | 8% |
| Others | 6% |
Regional Insights
How Did Asia Pacific Dominate the Silica Nanocomposite Polymers Market In 2025?
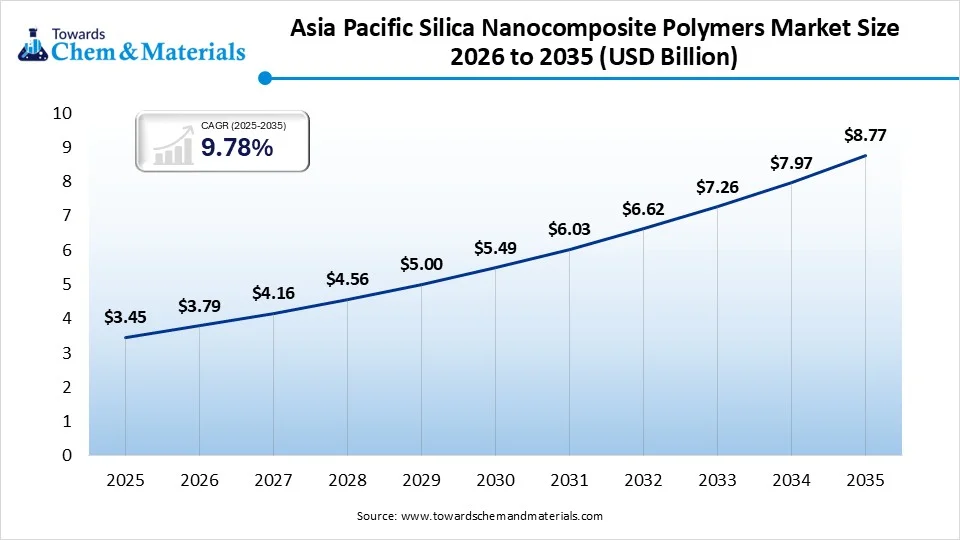
The Asia Pacific silica nanocomposite polymers market size was estimated at USD 3.45 billion in 2025 and is projected to reach USD 8.77 billion by 2035, growing at a CAGR of 9.78% from 2026 to 2035. There is a wide range of electronics manufacturing, auto manufacturing, industrial, construction, and polymer processing activities that drive regional demand. China continues to be a significant manufacturing hub, and Southeast Asian, Indian, Japanese, and Korean economies are significant contributors through a variety of industrial applications. Silica nanocomposites are becoming a key material in lightweight applications, electronic packaging, protective coatings, structural applications, and in the development of new polymer formulations.
Automotive, electronics, construction, polymer processing, and advanced materials applications are key applications in China, which is an important Asia Pacific market for industrial manufacturing. Silica nanocomposite polymers have found applications in lightweighting, durability, thermal management, coatings, and electronic protection, among others. Specialized polymer formulation and multiple industry downstream integration are also viable opportunities in the country's manufacturing environment.
India is an important regional market for infrastructure, automotive, industrial, coatings, and chemical manufacturing applications. Increased domestic polymer and epoxy production capacity can serve downstream demand for silica-reinforced polymer and epoxy products in various applications. The increasing manufacturing economy also opens up opportunities for advanced materials that demand further improvements in durability, light weight, thermal properties, and special surface characteristics.
- For instance, in December 2025, Kukdo Chemical Limited announced its expansion through Kukdo Chemical India Pvt. Ltd. in Gujarat to raise the capacity of epoxy resin for infrastructure, automotive, and industrial applications.
North America Silica Nanocomposite Polymers Market Trends Analysis
The North America silica nanocomposite polymers market size was estimated at USD 0.97 billion in 2025 and is projected to reach USD 2.47 billion by 2035, growing at a CAGR of 10.94% from 2026 to 2035.
North America held a 15.8% market share in 2025 and is expected to grow at the fastest CAGR of 10.2% during the forecast period. The advanced automotive, electronics, coatings, aerospace, industrial, and polymer-processing applications are linked to the regional opportunities. Light materials, special encapsulations, long-lasting coatings, and innovative composites are all in demand, driving continued innovation. Other manufacturing investments and application-specific formulation efforts are also helping to create opportunities in the region.
- For instance, in March 2026, Huntsman Corporation opened an expanded manufacturing plant of Performance Products at Petfurdo, Hungary, to boost global production capacity and enable more flexibility and innovation in the polyurethane, coatings, metalworking, and electronics sectors.
Advanced polymer materials are important in the automotive, aerospace, electronics, coatings, and industrial applications sectors in the U.S. The silica nanocomposites can be used to provide lightweighting, thermal management, electrical insulation, surface protection, and structural performance requirements. Development of application-specific formulations can be further supported by manufacturers and downstream users.
Silica nanocomposite polymers have potential applications in Canada in industrial manufacturing, automotive-related applications, coatings, construction, and development of advanced materials. Applications that demand improved durability, thermal stability, barrier performance, and mechanical properties can be correlated with demand. There are also opportunities for niche polymer products in industrial and engineering applications.
Europe Silica Nanocomposite Polymers Market Trends Analysis
The Europe silica nanocomposite polymers market size was estimated at USD 0.84 billion in 2025 and is projected to reach USD 2.14 billion by 2035, growing at a CAGR of 9.80% from 2026 to 2035.
Europe held a 13.7% market share in 2025 and is expected to grow at a CAGR of 8.7% over the forecast period. Applications that support regional development include automotive, coatings, electronics, industrial manufacturing, aerospace, and specialty chemicals. The continued growth of demand for advanced polymer systems is being driven by performance demands that include low weight, durability, thermal stability, and special material function. Formulation and production strategies throughout the region can also be affected by sustainability considerations.
- For instance, in July 2026, Deputy Minister Mikhail Yurin stated that production of the first epoxy resin plant in Russia was scheduled to commence in Sverdlovsk, with the intention of ensuring self-sufficiency and cutting down on imports.
Germany is an important European market for advanced polymer systems due to the wide range of application opportunities available from industrial manufacturing, automotive production, electronics, coatings, and specialty chemicals. Some of the potential uses of silica nanocomposites include lightweighting, thermal insulation, surface protection, structures, and electronic protection. Specialized high-performance polymer systems will be further promoted by the advanced formulation capabilities.
Industrial manufacturing, coatings, automotive applications, construction, packaging, and specialty polymer systems are all areas of opportunity in Italy. In appropriate formulations, silica nanocomposites can enhance barrier properties, mechanical properties, thermal stability, and surface durability. These characteristics enable potential applications in special coatings, composites, adhesives, and industrial applications.
Latin America Silica Nanocomposite Polymers Market Trends Analysis
The Latin America silica nanocomposite polymers market size was estimated at USD 0.44 billion in 2025 and is projected to reach USD 1.13 billion by 2035, growing at a CAGR of 9.89% from 2026 to 2035.
Latin America held a 7.2% market share in 2025 and is expected to grow at a CAGR of 8.8% over the forecast period. The regional demand is related to automotive, industrial, construction, coatings, polymers, and specialty chemical applications. Brazil is a significant regional market for chemical and polymer production. With growing interest in higher performance materials, silica nanocomposites can be promoted in industrial applications and specialty applications where higher durability and material efficiency are desired.
- For instance, in November 2025, Rhodia, a Solvay group company, unveiled a multi-year investment strategy to boost the industrial supply chain in Brazil and assist the textile industry.
Applications of silica nanocomposite polymers in polyamide, coating, automotive, construction, industrial, and specialty materials are all becoming avenues of opportunity in Brazil. Development of domestic chemical capabilities can complement the advancement of polymer materials available downstream. Silica reinforcement can also be used to enhance mechanical, thermal, abrasion, and dimensional properties when used in applications where these properties are required.
The market for advanced polymers, both industrial, construction, coatings and specialty polymers, in Chile is an emerging opportunity in the Latin American market. The silica nanocomposites have potential applications in durability, thermal stability, mechanical properties, and protective surface properties. Growing uptake within the industry may lead to more opportunities for specialist formulations.
Middle East and Africa Silica Nanocomposite Polymers Market Trends Analysis
The Middle East & Africa silica nanocomposite polymers market size was estimated at USD 0.42 billion in 2025 and is projected to reach USD 1.07 billion by 2035, growing at a CAGR of 9.80% from 2026 to 2035.
Middle East and Africa held a 7.2% market share in 2025 and is expected to grow at a CAGR of 8.9% over the forecast period. Other opportunities occur across the region in areas such as construction, coatings, automotive, industrial manufacturing, electronics, and specialty chemicals. The use of silica nanocomposite in protective coatings, structural applications, adhesives and composites as well as in industrial components, can be promoted by the demand for durable materials. Further strengths for regional market participation could be the development of specialized chemical and polymer capabilities.
Saudi Arabia offers a range of opportunities for specialty polymers and advanced materials in industrial development, construction, coatings, petrochemicals, and downstream. Silica nanocomposites are suitable for use in applications where these improved durability, thermal stability, mechanical, and protective properties are desired. Opportunities for specialised polymer formulations can be expanded by the development of the material capabilities downstream.
The possible applications for silica nanocomposite polymers in South Africa are industrial manufacturing, coatings, construction, automotive and specialty materials. Improved mechanical properties, thermal stability, resistance to abrasion, and barrier properties can be advantageous in applications that demand long-lasting polymer systems. Specific formulations can hold potential throughout industrial parts and protective materials.
Competitive Analysis
Organizations that are part of the silica nanocomposite polymers market comprise diversified chemical companies, silica producers, polymer experts, suppliers to the additives industry, and compounders. Competition is centred on silica quality, surface modification, polymer compatibility, dispersion technology, formulation expertise, application-specific development, and global supply capabilities. Companies identified in the provided market information include Evonik, Cabot Corporation, BASF, SABIC, Solvay, Arkema, allnex, Admatechs, BYK, and Wacker Chemie. Strategic investments, business integrations, special formulations, and collaborations downstream continue to be key competitive features.
- For instance, in April 2026, Cabot Sanmar announced plans to invest Rs. 25 million to increase the capacity of Fumed Silica's manufacturing units located at its Mettur plant in Salem district, to cater to the growing industrial applications of Fumed Silica in the country.
- For instance, in November 2025, Tata Chemicals announced a major increase in its specialty silica production. Tata Chemicals received approval for an investment of ₹910 crore in November 2025 for the manufacturing capacity expansion, with a sum of ₹775 crore for the expansion in precipitated silica
- For instance, in October 2025, SABIC presented cutting-edge material solutions, demonstrating technological innovation and collaboration for various applications throughout the value chain.
Recent Developments
- In September 2025, Solvay announced that the production of highly dispersible silica in Asia has been converted to be based on circular raw materials, starting in 2026 with the use of ISCC+ certified waste sand at the two Asian production sites in Gunsan and Qingdao.
- In March 2025, Solvay announced that the production of highly dispersible silica in Asia has been converted to be based on circular raw materials, starting in 2026 with the use of ISCC+ certified waste sand at the two Asian production sites in Gunsan and Qingdao.
Top Players in the Market & Their Offerings
| Company | Company Type/Position | Major Headquarters | Geographic Presence | Silica Nanocomposite Polymers Offerings | Key Strength |
| Evonik India Pvt. Ltd. | Global Market Leader | Essen, Germany | Global | NANOPOX (epoxies), NANOCRYL (coatings), NANOPOL, AEROSIL | In-situ synthesis capability; nanoparticles are synthesized directly within the resin without matrix alteration |
| Cabot Corporation | Mature Enterprise | Boston, Massachusetts, USA | Global | CAB-O-SIL® fumed silica masterbatches | Superb thixotropy control and uniform mechanical reinforcement |
| Arkema S.A. | Innovator | Colombes, France | Global | Nanostructured polymer matrices | Extensive expertise combining materials science and chemical engineering |
Other Key Players
- 3M
- Admatechs Co., Ltd.
- AkzoNobel N.V.
- allnex
- BASF SE
- Bee Chems
- BYK
- Cabot Corporation
- Dow Silicones Corporation
- DuPont de Nemours, Inc.
- Evonik Industries AG
- Fuso Chemical Co., Ltd.
- Momentive Performance Materials Inc.
- Nanostructured & Amorphous Materials, Inc.
- Nissan Chemical Corporation
- Nouryon
- Solvay SA
- Tata Chemicals Ltd.
- Tokuyama Corporation
Silica Nanocomposite Polymers Market Segment Covered in the Report
By Polymer
- Epoxy
- Electronic-grade epoxy
- Structural epoxy
- Coating-grade epoxy
- Adhesive-grade epoxy
- Polyamide
- PA6
- PA66
- Specialty polyamides
- Polyurethane
- Thermosetting polyurethane
- Thermoplastic polyurethane
- Polyurethane elastomers
- Polypropylene
- Homopolymer PP
- Copolymer PP
- Reinforced PP
- Polyethylene
- HDPE
- LDPE
- LLDPE
- Specialty polyethylene
- Others
- Polystyrene
- Polycarbonate
- PMMA
- PVC
- Silicone polymers
- Specialty engineering polymers
By Application
- Coatings
- Automotive coatings
- Industrial coatings
- Architectural coatings
- Protective coatings
- Electronics coatings
- Encapsulation
- Semiconductor encapsulation
- Power-electronics encapsulation
- LED encapsulation
- Sensor encapsulation
- Adhesives & sealants
- Structural adhesives
- Construction adhesives
- Electronic adhesives
- Automotive adhesives
- Industrial sealants
- Structural composites
- Automotive composites
- Aerospace composites
- Wind-energy composites
- Construction composites
- Industrial composites
- Films & membranes
- Packaging films
- Barrier films
- Filtration membranes
- Separation membranes
- Protective films
- Others
- Electrical insulation
- Automotive components
- Medical materials
- 3D-printing materials
- Optical materials
- Industrial parts
By Regions
- North America:
- U.S.
- Canada
- Mexico
- Rest of North America
- Latin America:
- Brazil
- Argentina
- Chile
- Rest of Latin America
- Europe:
- Western Europe
- Germany
- Italy
- France
- Netherlands
- Spain
- Portugal
- Belgium
- Ireland
- UK
- Iceland
- Switzerland
- Poland
- Rest of Western Europe
- Eastern Europe
- Austria
- Russia & Belarus
- Türkiye
- Albania
- Rest of Eastern Europe
- Asia Pacific:
- India
- China
- Japan
- South Korea
- Taiwan
- Indonesia
- Vietnam
- Thailand
- Philippines
- Malaysia
- Singapore
- Australia
- MEA:
- GCC Countries
- Saudi Arabia
- United Arab Emirates (UAE)
- Qatar
- Kuwait
- Oman
- Bahrain
- South Africa
- Egypt
- Rest of MEA
- GCC Countries
A Seven-Phase Framework
Our methodology is designed to be universally applicable across commodity chemicals, specialty chemicals, petrochemicals, construction chemicals, coatings, electronic chemicals, industrial gases, agrochemicals, water treatment chemicals, and performance materials. Each phase builds upon the last, creating a layered validation structure that minimizes estimation error and maximizes analytical confidence.
The framework ensures comprehensive market coverage, robust cross-validation, and reliable long-term forecasting — producing market estimates that withstand scrutiny from investors, regulators, and corporate strategy teams.

Seven-Phase Framework — Analytical Effort Distribution
Relative analytical effort allocated across each phase of the Chemicals & Materials research framework

Phase 1 - Secondary Research: Establishing the Foundation
Secondary research collects and evaluates publicly available information from authoritative sources, establishing the foundational understanding of market structure, value chain dynamics, competitive landscape, and end-use demand patterns. Every source is evaluated for credibility, recency, geographic relevance, and methodological soundness before inclusion.
Industry Associations
Sources include ACC, CEFIC, ICCA, JCIA, CPCIF, and SOCMA providing production volumes, consumption trends, capacity developments, and sustainability initiatives.
Company Disclosures
Annual reports, investor presentations, earnings transcripts, and regulatory filings reveal product portfolios, manufacturing footprints, capacity expansions, and revenue segmentation.
Government Databases
National statistical offices, customs authorities, environmental agencies, and industrial production databases provide verified statistics on output, trade flows, and regulatory compliance.
Trade Databases
UN Comtrade, ITC, Eurostat, and national customs authorities enable assessment of global product movement, import dependency, and export competitiveness across regions.
Our Secondary Research Sources
- Ministry of Chemicals and Fertilizers
- European Chemicals Agency
- United States Department of Energy
- Ministry of Industry and Information Technology
- Ministry of Economy Trade and Industry
- Ministry of Trade Industry and Energy
- National Institute of Standards and Technology
- Council of Scientific and Industrial Research
- Fraunhofer Society
- National Institute for Materials Science
Phase 2 — Supply-Side Assessment: Mapping Production Capabilities
Production Capacity Analysis
All major manufacturers are assessed for existing installed capacity, planned additions, expansions, new plant announcements, and technology adoption — mapped at global, regional, and country levels.
Capacity Utilization Adjustment
Installed capacity is adjusted using utilization rates based on demand conditions, feedstock availability, plant operating rates, maintenance schedules, and regulatory restrictions.
Manufacturer Revenue Analysis
Product-specific revenues, segment-level performance, regional distribution, average selling prices, and margin trends are evaluated to establish market value estimates.
Supply-Side Assessment — Capacity vs. Effective Production by Region
Illustrative comparison of installed capacity vs. effective production volume (after utilization rate adjustment) across major regions

Phase 3 — Demand-Side Assessment: Quantifying Chemical Consumption
Demand-side analysis quantifies chemical consumption across industries, applications, and geographies — identifying where and how chemicals are consumed throughout the value chain with precision.
End-Use Industry Analysis
Chemical demand is evaluated across automotive, construction, packaging, electronics, agriculture, healthcare, consumer goods, industrial manufacturing, energy and utilities, and water treatment. Industry output, production trends, and consumption intensity are analyzed to determine demand patterns.
Consumption Modeling
Demand is estimated using measurable indicators: kilograms per vehicle, kilograms per square meter of construction, dosage per cubic meter of water treated, kilograms per hectare of agricultural land, and kilograms per ton of manufactured products. Consumption factors are validated through industry publications and primary interviews.
Application Analysis
The market is segmented by application area to understand product performance requirements, formulation trends, technology adoption, customer preferences, and regulatory requirements improving demand accuracy and segmentation granularity.
Demand-Side Assessment — End-Use Industry Demand Distribution
Illustrative distribution of chemical & materials demand across key end-use industries

Phase 4 - Trade Flow Analysis: Balancing Regional Supply and Demand
Trade flow analysis reconciles regional supply and demand estimates through import and export data, identifying net supply positions, regional dependencies, and market imbalances. It serves as an independent validation layer that tests the consistency of supply-side and demand-side estimates.
Import Analysis
Import data is evaluated to determine volumes, source countries, product dependency, regional supply gaps, and pricing trends — identifying markets that rely heavily on external supply and where domestic production is insufficient to meet demand.
Export Analysis
Export assessments reveal production surplus, export competitiveness, regional manufacturing strength, and global market participation. Export patterns also help validate domestic production estimates and identify net exporting regions.
Apparent Consumption Model
Regional consumption is assessed using the standard apparent consumption formula:
Results identify net importing regions, net exporting regions, regional deficits, and surpluses — serving as an independent validation of supply and demand estimates.
Trade Flow Analysis — Net Supply Position by Region
Illustrative apparent consumption vs. domestic production across major regions — positive gap indicates net import dependency

Phase 5 — Primary Research: The Critical Validation Layer
Primary research tests and refines findings from secondary research through direct engagement with industry participants across the supply chain, demand side, and expert community. It captures intelligence that no database or published report can provide — the real-world experience of manufacturers, buyers, and specialists operating in the market.

Supply-Side Interviews
Conversations with chemical manufacturers, raw material suppliers, contract manufacturers, technology providers, and plant operators cover production trends, capacity utilization, pricing developments, technology shifts, and competitive dynamics.

Demand-Side Interviews
Engagement with OEMs, industrial consumers, procurement managers, distributors, formulators, and end-use manufacturers focuses on consumption trends, purchasing behavior, product substitution, demand outlook, and emerging applications.

Industry Expert Consultations
Additional interviews with industry consultants, independent experts, regulatory specialists, technical professionals, and research institutions provide deeper market context and validate key analytical assumptions.
Focus Areas of Primary Research:
Market Size & Forecast Validation
Revenue estimates, volume consumption, growth rates, forecast assumptions, regional demand.Supply Chain & Value Chain Assessment
Raw material sourcing, supply chain challenges, distribution networks, procurement practices.Production & Capacity Analysis
Manufacturing capacity, utilization rates, expansion projects, plant investments.Pricing & Cost Structure Analysis
Product pricing trends, feedstock costs, energy costs, margin pressures, pricing outlook.Competitive Landscape Assessment
Volume and value estimates confirmed to be fully consistent with one another before publicationInterview Volume by Market Scope
| Study Scope | Number of Interviews |
|---|---|
| Niche Market | 20 – 30 |
| Mid-Sized Market | 30 – 50 |
| Global Market | 50 – 80 |
| Highly Fragmented Market | 80 – 120 |
Interview Details:
Category : Manufacturers, Suppliers, Distributors, End Users, Experts/Associations
Average Duration : 30–60 Minutes
Interview Mode : Video calls, telephonic interviews, expert consultations
Interview Format : Structured / Semi-Structured questionnaire
Focus Areas of Primary Research:
Market Size & Forecast Validation :
Revenue estimates, volume consumption, growth rates, forecast assumptions, regional demand.
Supply Chain & Value Chain Assessment :
Raw material sourcing, supply chain challenges, distribution networks, procurement practices.
Production & Capacity Analysis :
Manufacturing capacity, utilization rates, expansion projects, plant investments.
Pricing & Cost Structure Analysis :
Product pricing trends, feedstock costs, energy costs, margin pressures, pricing outlook.
Competitive Landscape Assessment :
Market share, competitor positioning, strategic initiatives, partnerships, acquisitions.
Primary Research — Stakeholder Coverage by Category
Distribution of interview respondents across stakeholder categories (% share from PPT data)

Primary Research — Respondent Designation Profile
Seniority breakdown of interview respondents (% share from PPT data)

Primary Research — Geographic Coverage of Interviews
Regional distribution of primary research engagement (% share from PPT data)

Phase 6 — Data Triangulation and Market Validation
No single methodology is relied upon in isolation. Multiple independent estimation approaches are combined and reconciled to ensure consistency, accuracy, and analytical defensibility. Any material deviations between approaches are investigated and adjusted through additional validation cycles.
The final market size is derived through weighted triangulation of all validated methodologies. Any material deviations between approaches are investigated and adjusted through additional validation cycles. The outcome represents the most realistic assessment of the market based on available evidence and expert confirmation ensuring that volume and value estimates are fully consistent with one another.
Triangulation Framework — Input Contribution Weight
Relative weight each sizing input contributes to the final reconciled market estimate

Phase 7 — Forecast Modeling: Projecting Future Market Evolution
Forecasting evaluates the future trajectory of the market using a combination of quantitative indicators and qualitative assessments across economic, industry, and regulatory dimensions. Rather than simple extrapolation, each driver is independently modeled and integrated into a composite forecast.
Macroeconomic Indicators
GDP growth, industrial production, manufacturing output, construction activity, consumer spending, and capital investment form the quantitative foundation of long-term demand projections. These are applied at country, regional, and global levels.
Industry Growth Drivers
Urbanization, infrastructure development, industrialization, technological innovation, sustainability initiatives, and evolving product performance requirements are assessed at regional and industry levels — capturing both structural and cyclical demand drivers.
Capacity Expansion Analysis
Announced plant expansions, new manufacturing facilities, technology upgrades, and strategic investments are evaluated to determine future supply-demand dynamics and potential market tightness or oversupply situations.
Regulatory & Sustainability
Environmental regulations, chemical safety standards, emission reduction targets, circular economy initiatives, and sustainability requirements are incorporated as they often influence product adoption rates and market growth trajectories.
Scenario Forecast Range — Indexed Market Growth (Year 1–10)
Illustrative indexed growth trajectories across Base, Optimistic, and Pessimistic scenarios over a 10-year forecast horizon

Forecast Drivers — Relative Impact Score by Category
Impact score (0–100) of each driver type on chemicals & materials market forecast




Comments
Share your thoughts, ask a question, or provide feedback about this report.