
Low-Carbon Construction Material Market Size and Forecast 2024 to 2034
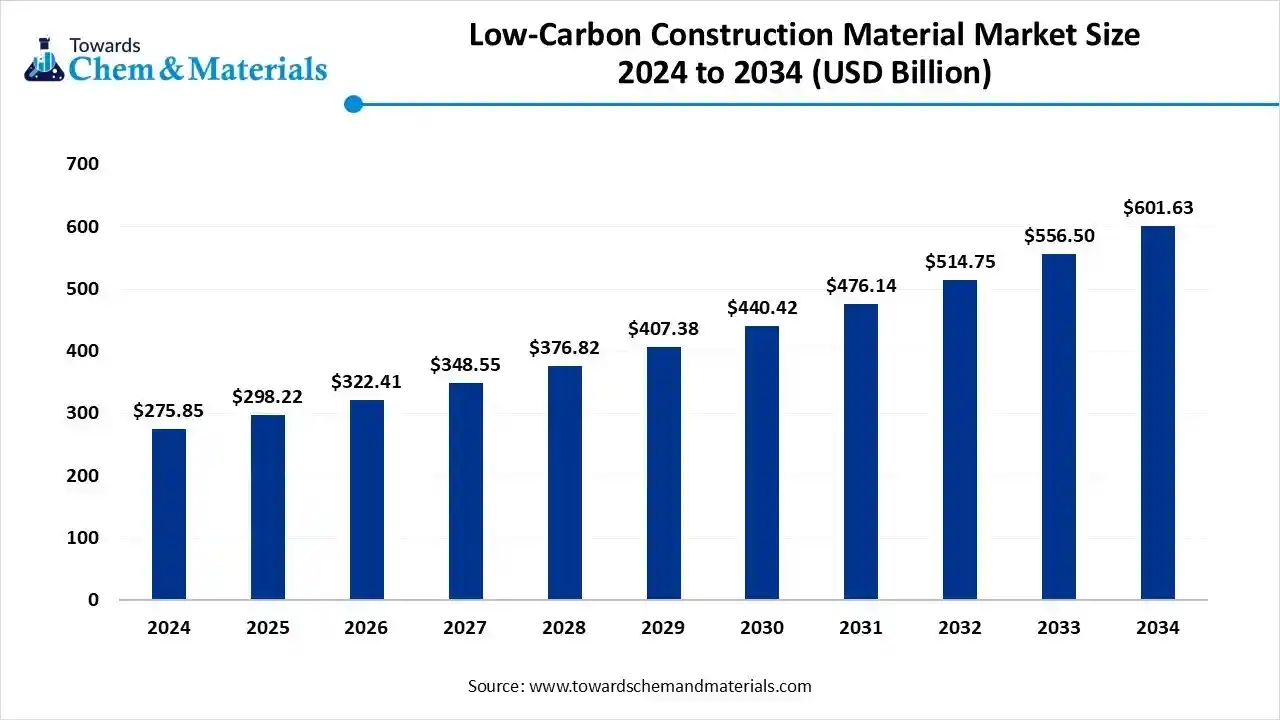
According to the new market research report the global low-carbon construction material market size is calculated at USD 298.22 billion in 2025 and is expected to reach USD 601.63 billion by 2034, growing at a CAGR of 8.11% from 2025 to 2034. The global shift towards sustainable and eco-friendly infrastructure is playing a major role in unlocking the industry's growth capacity.
Key Takeaways
- By region, Asia Pacific dominated the low-carbon construction material market in 2024.
- By region, North America is expected to grow at a notable rate in the future.
- By region, Europe is also a notably growing region in the market.
- By product type, the plastic segment dominated the market in 2024.
- By product type, the green concrete segment is expected to grow at the fastest rate in the market during the forecast period.
- By application type, the residential segment dominated the market in 2024.
- By application type, the industrial segment is expected to grow at the fastest rate in the market during the forecast period
What is a Low-Carbon Construction Material?
The low-carbon construction material refers to the materials or products which made in ways that emit low carbon dioxide for their entire lifespan. Moreover, materials like green concrete, biobased insulation, and recycled steel have played a major role in the production of these low-carbon construction materials.
Low-Carbon Construction Material Market Outlook:
- Industry Growth Overview: Between 2025 and 2034, as the major regions are shifting towards initiatives like the net zero emissions target and sustainable urban growth is actively positioning the industry for long-term expansion. Moreover, the need for recycled aggregates, eco cement, and green steel is rapidly increasing, akin to the green building construction boom.
- Sustainability Trends: The trend towards the CO2-infused concrete is fuelling the expansion of opportunities within the sector in recent years. Also, materials like timer composites and bio-based resin have become a major area of interest for thought leaders and technologies in the current period.
- Global Expansion: The global regions are actively investing in climate-resilient cities nowadays. The Asia Pacific region has seen a merging as the global hotspot for the low-carbon construction industry, owing to the smart and renewable housing programs. Whereas Europe and North America have observed in heavy adoption of the eco-certified materials in commercial projects.
- For Instance, the United States has invested $160 million in environmental product declaration and the promotion of low-carbon construction material in 2024.(Source : oneclicklca.com)
Report Scope
| Report Attributes | Details |
| Market Size in 2026 | USD 322.41 Billion |
| Expected Size by 2034 | USD 601.63 Billion |
| Growth Rate from 2025 to 2034 | CAGR 8.11% |
| Base Year of Estimation | 2024 |
| Forecast Period | 2025 - 2034 |
| Dominant Region | Asia Pacific |
| Segment Covered | By Product Type , By Application, By Region |
| Key Companies Profiled | SSAB AB, Nucor Corporation, HOLCIM, Norsk Hydro ASA, Mercer Mass Timber LLC, CRH Plc |
Key Technological Shifts in the Low-Carbon Construction Material Market:
The manufacturers are heavily investing in the modern material manufacturing infrastructure, such as AI-driven material design, and others. Also, the development of the carbon capture integrated cement will likely aid in business diversification for producers during the forecast period.
Trade Analysis of the Low-Carbon Construction Material Market: Import & Export Statistics
- India has exported a huge amount of construction material across the globe, with 77,658 shipments between 2023 to 2024(Source: www.volza.com)
- China exported a significant amount of construction materials, estimated 4, 708 shipments as per the published report(Source : www.volza.com)
Value Chain Analysis of the Low-Carbon Construction Material Market:
- Distribution to Industrial Users: For industrial users, the distribution of low-carbon construction materials is complex, involving large manufacturers, technology firms, and specialized suppliers who primarily target high-volume commercial, infrastructure, and heavy industrial projects.
- Chemical Synthesis and Processing: Low-carbon construction materials rely on advanced chemical synthesis and processing methods to reduce the carbon-intensive nature of traditional production
- Regulatory Compliance and Safety Monitoring : Regulatory compliance and safety monitoring for low-carbon construction materials involve a complex mix of international standards, national regulations, and third-party certifications.
Low-Carbon Construction Material Market’s Regulatory Landscape: Global Regulations
| Country / Region | Regulatory Body | Key Regulations | Focus Areas | Notable Notes |
| United States | Environmental Protection Agency (EPA) | Embodied Carbon Label Program | Measurement and Labeling | The EPA has initiated programs to identify and standardize the measurement of embodied carbon in construction materials. |
| European Union | European Chemicals Agency (ECHA) | Construction Products Regulation (CPR) | Embodied Carbon Transparency | This agency manages regulations for chemicals, including those used in construction materials. |
| China | Ministry of Housing and Urban-Rural Development (MHURD) | General Code for Building Energy Conservation and Renewable Energy Utilization (2022) | Urbanization and Green Buildings | This primary body for green building standards. |
| India | Bureau of Indian Standards (BIS) | IGBC Net Zero Carbon Rating System (Pilot Version) | Voluntary Market Transformation | This agency sets quality standards for building materials, with a growing focus on sustainable practices. |
Segmental Insights
Product Type Insights
How did the Plastic Segment Dominate the Low-Carbon Construction Material Market in 2024?
The plastic segment dominated the market share in 2024 due to factors such as durability, lightweight, and recyclable options. Furthermore, the manufacturers are using these plastics for wide applications like pipes, roofing, and flooring, which is providing greater industry attention in the current period. Also, by offering easy transportation and installation, the plastic segment is forecasted to strengthen the bottom line for production firms in the coming years.
The green concrete segment is expected to grow at a significant rate during the forecast period, owing to a greater shift towards carbon-neutral building solutions. Moreover, having better strength, durability, and thermal control, green concrete is expected to attract increased capital and investment in manufacturing in the coming years.
The low-carbon bricks segment is expected to grow at a notable rate during the forecast period, owing to the builders and construction infrastructure developers who have shifted from fired clay bricks due to their excessive carbon emissions in recent years. Furthermore, several manufacturers are using modern technology advantages that offer bricks made by fly ash and carbon-cure materials, which can tap CO2 instead of releasing. Also, the government's push towards sustainability is likely to create lucrative opportunities for manufacturers in the coming years.
Application Insights
Why does the Residential Segment Dominate the Low-Carbon Construction Material Market?
The residential segment dominated the market in 2024 because homeowners and developers are increasingly choosing eco-friendly materials for houses and apartments. Green roofs, low-carbon insulation, and recycled flooring materials are becoming common in modern housing. Rising urban populations and government incentives for energy-efficient homes also drive demand. Residential builders find low-carbon materials more affordable and easier to market as "sustainable homes."
The industrial segment is expected to grow at a fast pace during the forecast period, as factories, warehouses, and logistics centers aim for carbon neutrality. Companies are building energy-efficient plants using green cement, reflective coatings, and recycled steel to meet emission goals. Many global brands are pledging to use only sustainable materials in future facilities. Governments are also enforcing stricter emission rules for industrial projects, speeding up green adoption.
The commercial segment is expected to grow at a notable rate during the forecast period, as offices, hotels, and malls adopt low-carbon construction materials to meet environmental standards and attract eco-conscious investors. Companies now aim for "green building" labels like LEED and BREEAM, which require low-emission materials. Using products such as green concrete, recycled steel, and energy-efficient façades helps businesses reduce operating costs and meet ESG goals. Urban developers are prioritizing sustainable construction to cut carbon footprints and gain government incentives. As more multinational firms demand climate-resilient office spaces, the commercial sector will become one of the fastest-growing areas in the low-carbon construction material market.
Regional Insights
Asia Pacific Low-Carbon Construction Material Market Trends
Asia Pacific dominated the market in 2024, owing to the fast-paced infrastructure development and green initiative adoption. Moreover, the regional countries such as China, India, and Japan are increasingly focusing on sustainable construction while meeting the climate goals. Also, the regional manufacturers have been trying to expand local facilities in recent years.
How are China’s Carbon-Neutral Cities Reshaping the Building Industry?
China maintained its dominance in the market during the forecast period, owing to its higher investment in the carbon-neutral city development initiative. Moreover, the government in China is heavily supporting the green manufacturer while providing attractive incentives and subsidies, according to the recent country survey. Also, green materials like bamboo composites and water-based insulation have gained developers' attention in recent years.
North America Low-Carbon Construction Material Market Analysis
North America is expected to capture a major share of the market during the forecast period, akin to access to modern technology and strong climate policies. Moreover, the regional countries such as the United States and Canada are increasingly shifting towards the net Zero buildings while following the guidelines from firms like LEED and others.
Is the United States Set to Lead the Global Low-Carbon Construction Revolution?
The United States is expected to emerge as a prominent country for the market in the coming years, owing to the adoption of biobased plastics and carbon-infused concrete. Also, the regulations, like state-level green building mandates and innovations, are driving industry growth in the region.
Europe Low-Carbon Construction Material Market Trends
Europe is a notably growing region, due to its strong sustainability focus and circular economic policies. The region is introducing strict carbon reporting rules for construction firms, encouraging a switch to green materials. Demand is rising for carbon-negative concrete, bio-based insulation, and recycled steel in urban housing and infrastructure projects.
Is Germany Redefining Green Architecture with Innovation?
Germany is expected to gain a major industry share because of its strong engineering, innovation, and sustainability culture. The country is leading in developing high-performance green concrete, recycled composites, and bio-based insulation. Germany's strict building efficiency laws and its "Energiewende" (energy transition) program push builders to adopt climate-friendly materials in all projects. Companies are integrating renewable energy systems directly into construction designs, like solar façades and carbon-neutral cement.
Recent Developments
- In October 2025, ArcelorMittal introduced its latest production of low-carbon roofing systems. Also, the newly launched roofing system is known as the Helioroof®, as per the report published by the company recently.(Source: www.yieh.com)
- In July 2025, MevoCem is planning to work on the Ultra Low Carbon Cement development project. Also, the company has made a collaboration with CRH as per the published report.(Source: www.crhventures.com )
Top Vendors in the Low-Carbon Construction Material Market & Their Offerings:
- Carbicrete Inc. : A Canadian cleantech company based in Montreal that produces cement-free, carbon-negative concrete
- Cemex, S.A.B. de C.V.: A large multinational company headquartered in Mexico that is a global leader in the production and supply of building materials.
- CarbonCure Technologies Inc: A Canadian company that develops and licenses technology to inject captured carbon dioxide (CO2) into fresh concrete
- ArcelorMittal Ltd: A multinational steel and mining company headquartered in Luxembourg.
Other Key Players
- SSAB AB
- Nucor Corporation
- HOLCIM
- Norsk Hydro ASA
- Mercer Mass Timber LLC
- CRH Plc
Segments Covered in the Report:
By Product Type
- Plastic
- Metal
- Mass Timber
- Green Concrete
- Green Tiles
- Low-Carbon Bricks
- Others
By Application
- Residential
- Commercial
- Industrial
- Others
By Region
- North America
- U.S.
- Canada
- Europe
- Germany
- UK
- France
- Italy
- Spain
- Sweden
- Denmark
- Norway
- Asia Pacific
- China
- Japan
- India
- South Korea
- Thailand
- Latin America
- Brazil
- Mexico
- Argentina
- Middle East and Africa (MEA)
- South Africa
- UAE
- Saudi Arabia
- Kuwait
A Seven-Phase Framework
Our methodology is designed to be universally applicable across commodity chemicals, specialty chemicals, petrochemicals, construction chemicals, coatings, electronic chemicals, industrial gases, agrochemicals, water treatment chemicals, and performance materials. Each phase builds upon the last, creating a layered validation structure that minimizes estimation error and maximizes analytical confidence.
The framework ensures comprehensive market coverage, robust cross-validation, and reliable long-term forecasting — producing market estimates that withstand scrutiny from investors, regulators, and corporate strategy teams.

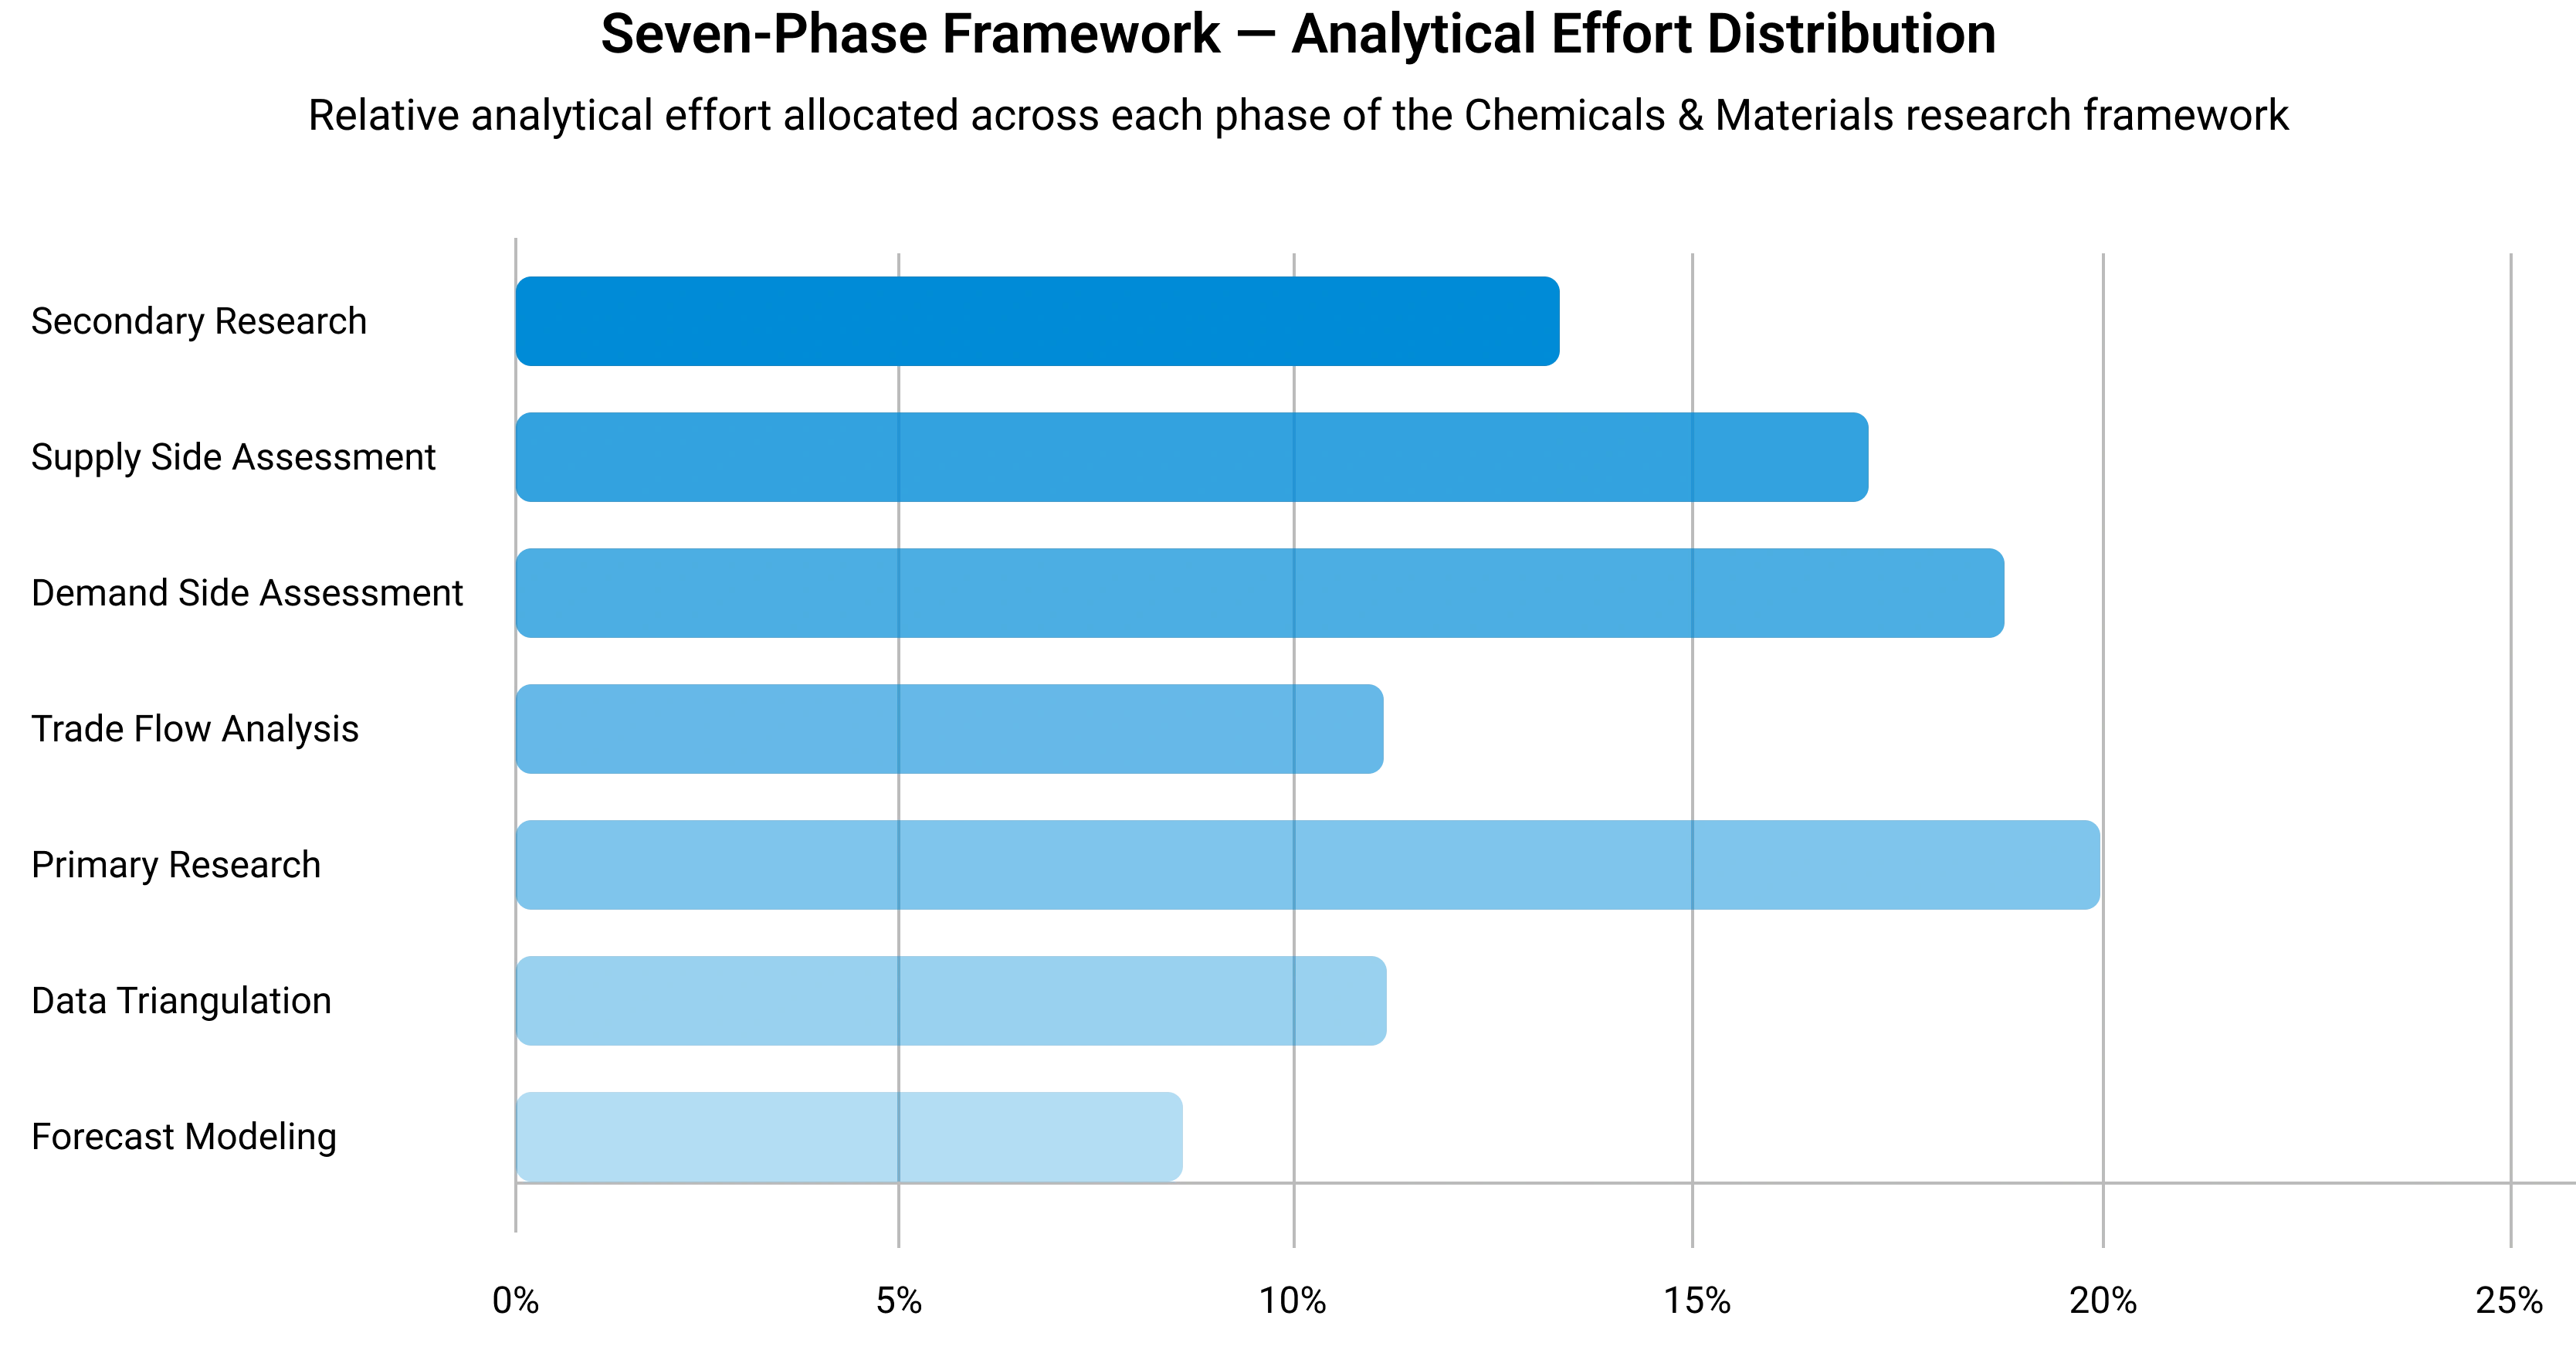
Seven-Phase Framework — Analytical Effort Distribution
Relative analytical effort allocated across each phase of the Chemicals & Materials research framework
Phase 1 - Secondary Research: Establishing the Foundation
Secondary research collects and evaluates publicly available information from authoritative sources, establishing the foundational understanding of market structure, value chain dynamics, competitive landscape, and end-use demand patterns. Every source is evaluated for credibility, recency, geographic relevance, and methodological soundness before inclusion.
Industry Associations
Sources include ACC, CEFIC, ICCA, JCIA, CPCIF, and SOCMA providing production volumes, consumption trends, capacity developments, and sustainability initiatives.
Company Disclosures
Annual reports, investor presentations, earnings transcripts, and regulatory filings reveal product portfolios, manufacturing footprints, capacity expansions, and revenue segmentation.
Government Databases
National statistical offices, customs authorities, environmental agencies, and industrial production databases provide verified statistics on output, trade flows, and regulatory compliance.
Trade Databases
UN Comtrade, ITC, Eurostat, and national customs authorities enable assessment of global product movement, import dependency, and export competitiveness across regions.
Our Secondary Research Sources
- Ministry of Chemicals and Fertilizers
- European Chemicals Agency
- United States Department of Energy
- Ministry of Industry and Information Technology
- Ministry of Economy Trade and Industry
- Ministry of Trade Industry and Energy
- National Institute of Standards and Technology
- Council of Scientific and Industrial Research
- Fraunhofer Society
- National Institute for Materials Science
Phase 2 — Supply-Side Assessment: Mapping Production Capabilities
Production Capacity Analysis
All major manufacturers are assessed for existing installed capacity, planned additions, expansions, new plant announcements, and technology adoption — mapped at global, regional, and country levels.
Capacity Utilization Adjustment
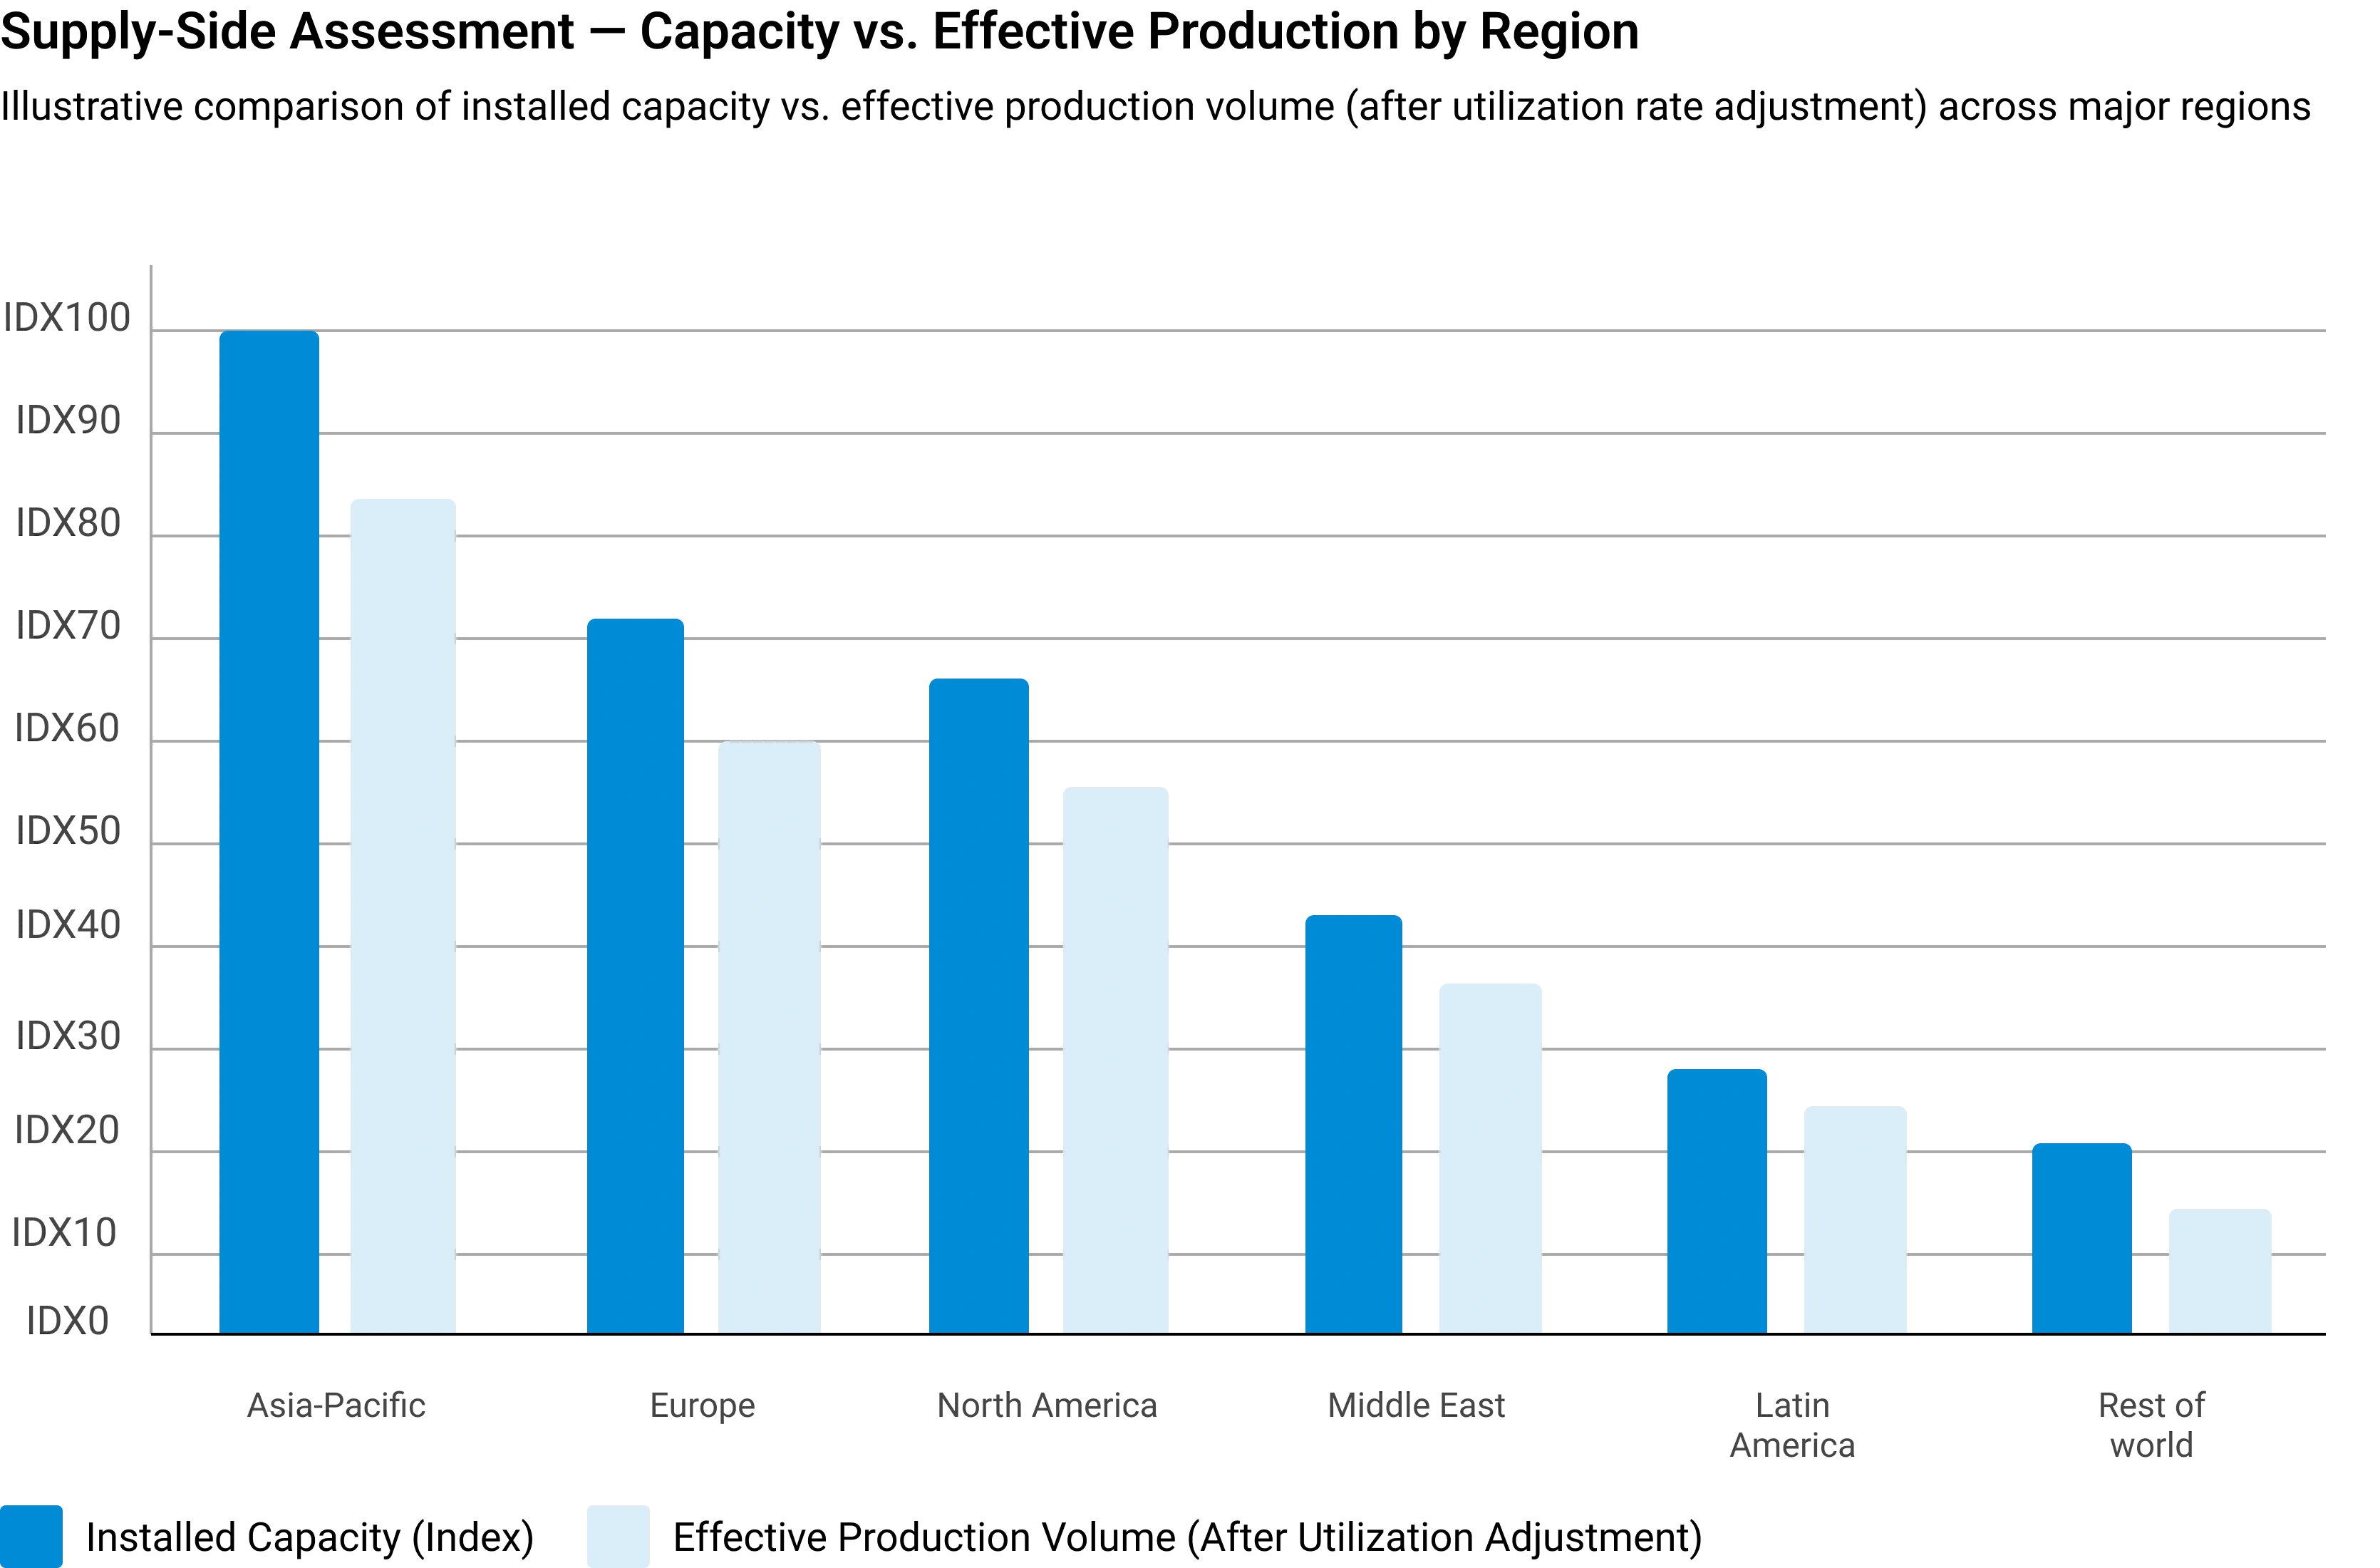
Installed capacity is adjusted using utilization rates based on demand conditions, feedstock availability, plant operating rates, maintenance schedules, and regulatory restrictions.
Manufacturer Revenue Analysis
Product-specific revenues, segment-level performance, regional distribution, average selling prices, and margin trends are evaluated to establish market value estimates.
Supply-Side Assessment — Capacity vs. Effective Production by Region
Illustrative comparison of installed capacity vs. effective production volume (after utilization rate adjustment) across major regions
Phase 3 — Demand-Side Assessment: Quantifying Chemical Consumption
Demand-side analysis quantifies chemical consumption across industries, applications, and geographies — identifying where and how chemicals are consumed throughout the value chain with precision.
End-Use Industry Analysis
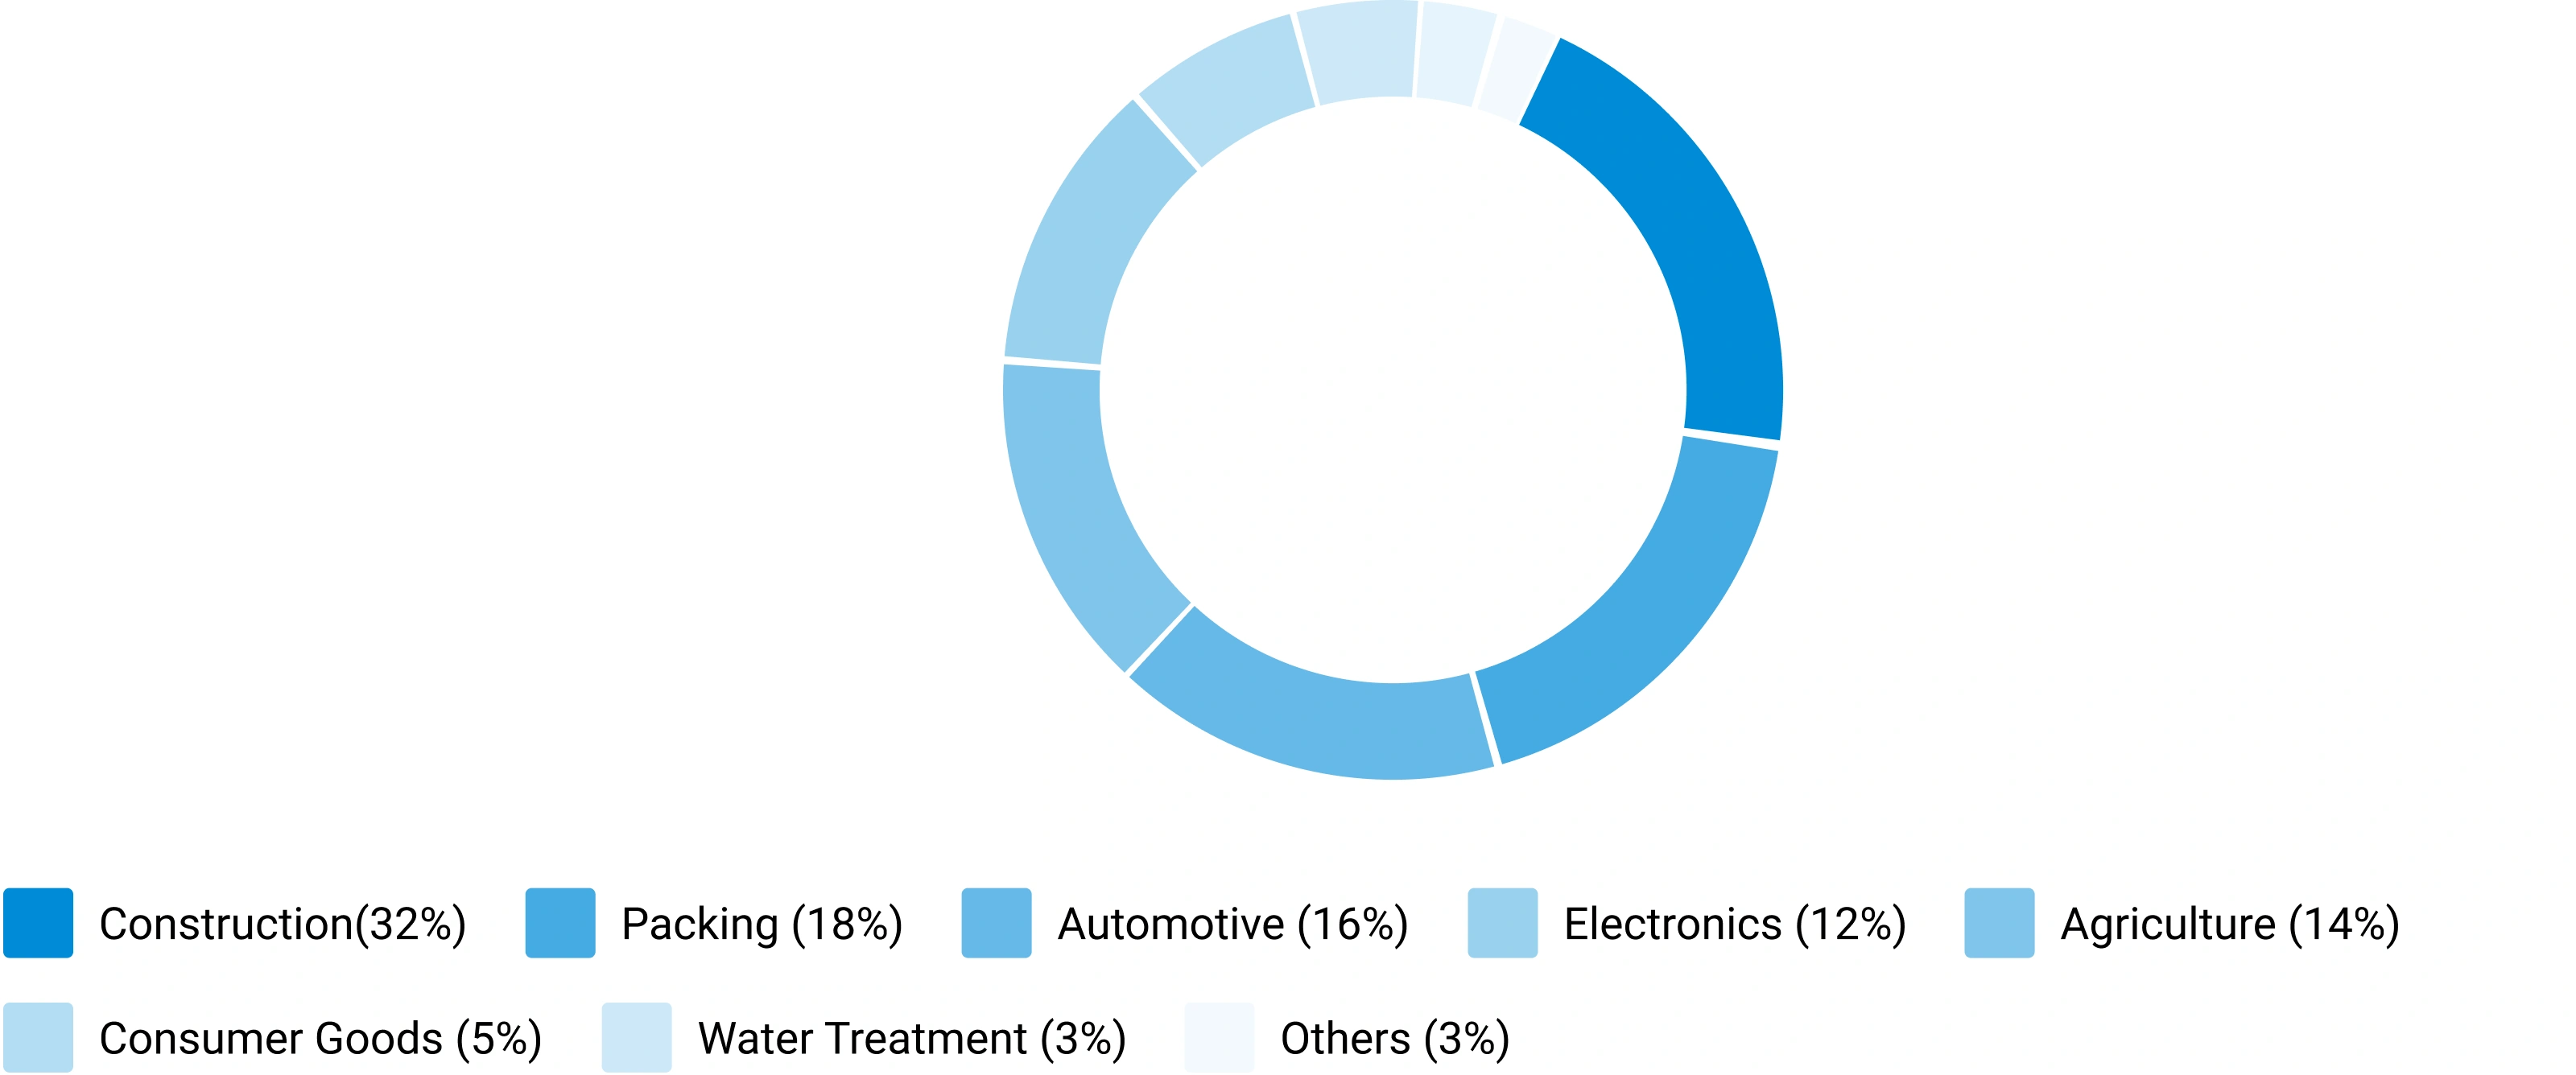
Chemical demand is evaluated across automotive, construction, packaging, electronics, agriculture, healthcare, consumer goods, industrial manufacturing, energy and utilities, and water treatment. Industry output, production trends, and consumption intensity are analyzed to determine demand patterns.
Consumption Modeling
Demand is estimated using measurable indicators: kilograms per vehicle, kilograms per square meter of construction, dosage per cubic meter of water treated, kilograms per hectare of agricultural land, and kilograms per ton of manufactured products. Consumption factors are validated through industry publications and primary interviews.
Application Analysis
The market is segmented by application area to understand product performance requirements, formulation trends, technology adoption, customer preferences, and regulatory requirements improving demand accuracy and segmentation granularity.
Demand-Side Assessment — End-Use Industry Demand Distribution
Illustrative distribution of chemical & materials demand across key end-use industries
Phase 4 - Trade Flow Analysis: Balancing Regional Supply and Demand
Trade flow analysis reconciles regional supply and demand estimates through import and export data, identifying net supply positions, regional dependencies, and market imbalances. It serves as an independent validation layer that tests the consistency of supply-side and demand-side estimates.
Import Analysis
Import data is evaluated to determine volumes, source countries, product dependency, regional supply gaps, and pricing trends — identifying markets that rely heavily on external supply and where domestic production is insufficient to meet demand.
Export Analysis
Export assessments reveal production surplus, export competitiveness, regional manufacturing strength, and global market participation. Export patterns also help validate domestic production estimates and identify net exporting regions.
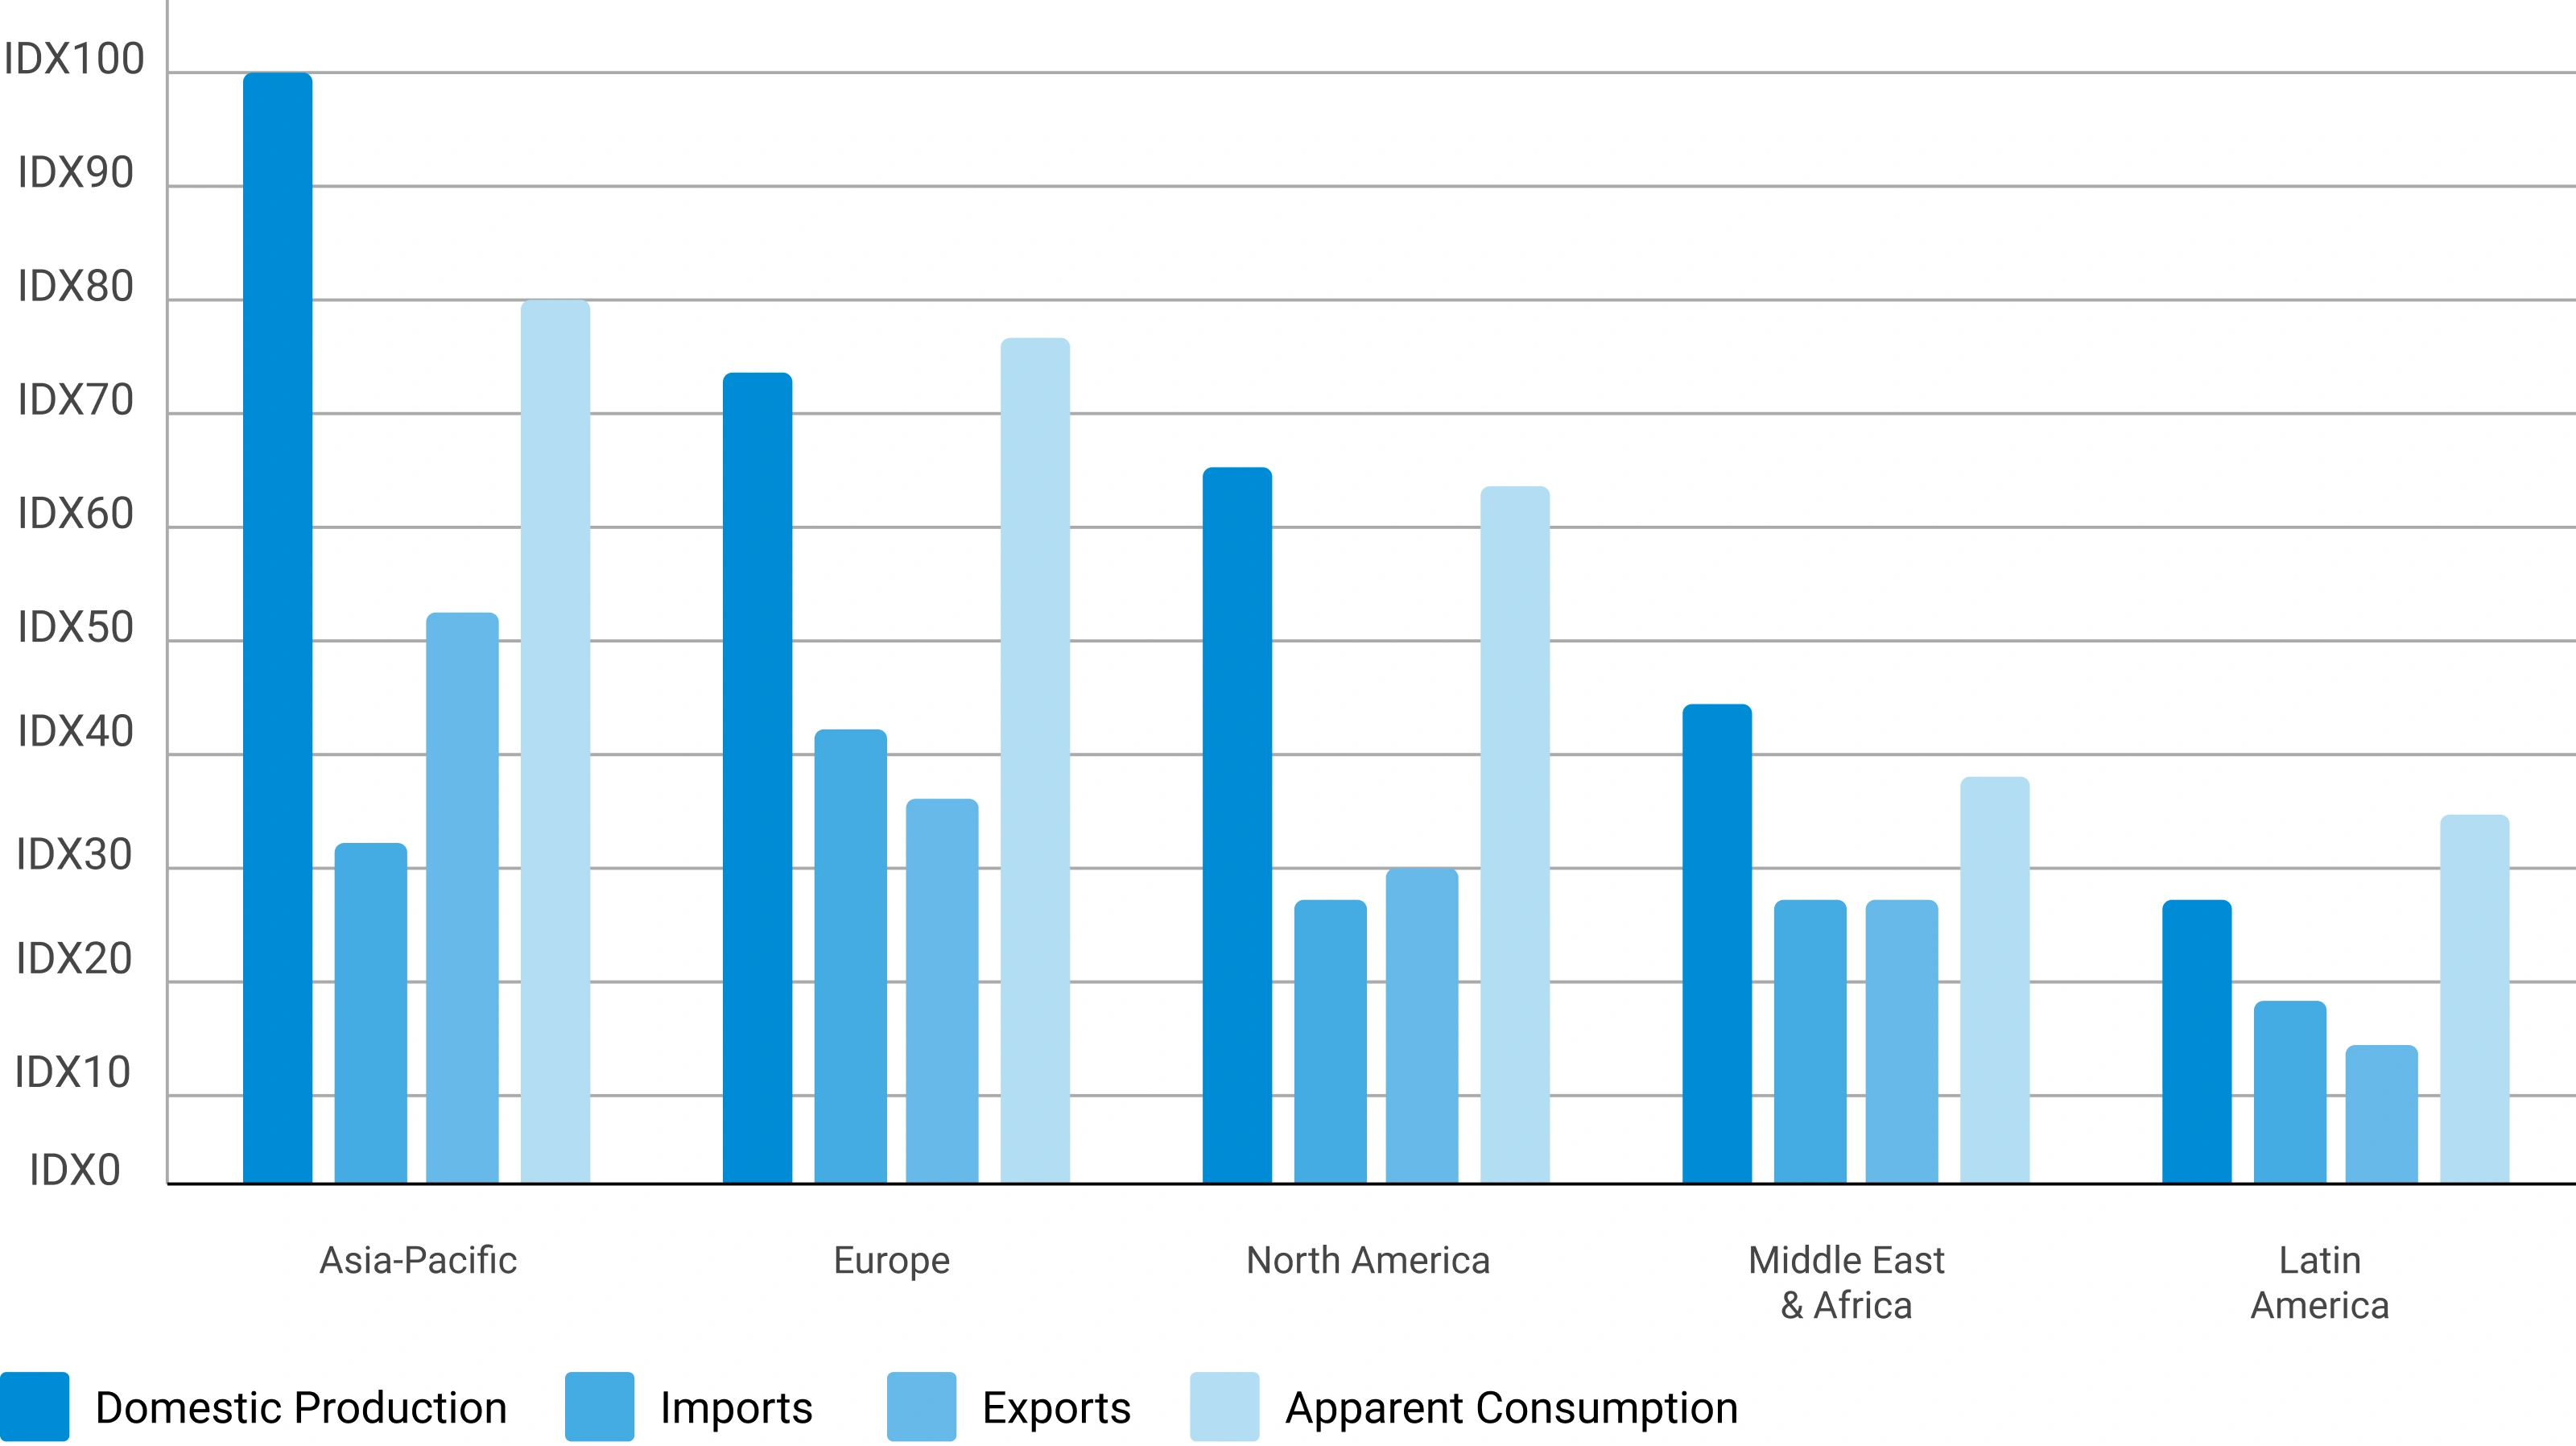
Apparent Consumption Model
Regional consumption is assessed using the standard apparent consumption formula:
Results identify net importing regions, net exporting regions, regional deficits, and surpluses — serving as an independent validation of supply and demand estimates.
Trade Flow Analysis — Net Supply Position by Region
Illustrative apparent consumption vs. domestic production across major regions — positive gap indicates net import dependency
Phase 5 — Primary Research: The Critical Validation Layer
Primary research tests and refines findings from secondary research through direct engagement with industry participants across the supply chain, demand side, and expert community. It captures intelligence that no database or published report can provide — the real-world experience of manufacturers, buyers, and specialists operating in the market.

Supply-Side Interviews
Conversations with chemical manufacturers, raw material suppliers, contract manufacturers, technology providers, and plant operators cover production trends, capacity utilization, pricing developments, technology shifts, and competitive dynamics.

Demand-Side Interviews
Engagement with OEMs, industrial consumers, procurement managers, distributors, formulators, and end-use manufacturers focuses on consumption trends, purchasing behavior, product substitution, demand outlook, and emerging applications.

Industry Expert Consultations
Additional interviews with industry consultants, independent experts, regulatory specialists, technical professionals, and research institutions provide deeper market context and validate key analytical assumptions.
Focus Areas of Primary Research:
Market Size & Forecast Validation
Revenue estimates, volume consumption, growth rates, forecast assumptions, regional demand.Supply Chain & Value Chain Assessment
Raw material sourcing, supply chain challenges, distribution networks, procurement practices.Production & Capacity Analysis
Manufacturing capacity, utilization rates, expansion projects, plant investments.Pricing & Cost Structure Analysis
Product pricing trends, feedstock costs, energy costs, margin pressures, pricing outlook.Competitive Landscape Assessment
Volume and value estimates confirmed to be fully consistent with one another before publicationInterview Volume by Market Scope
| Study Scope | Number of Interviews |
|---|---|
| Niche Market | 20 – 30 |
| Mid-Sized Market | 30 – 50 |
| Global Market | 50 – 80 |
| Highly Fragmented Market | 80 – 120 |
Interview Details:
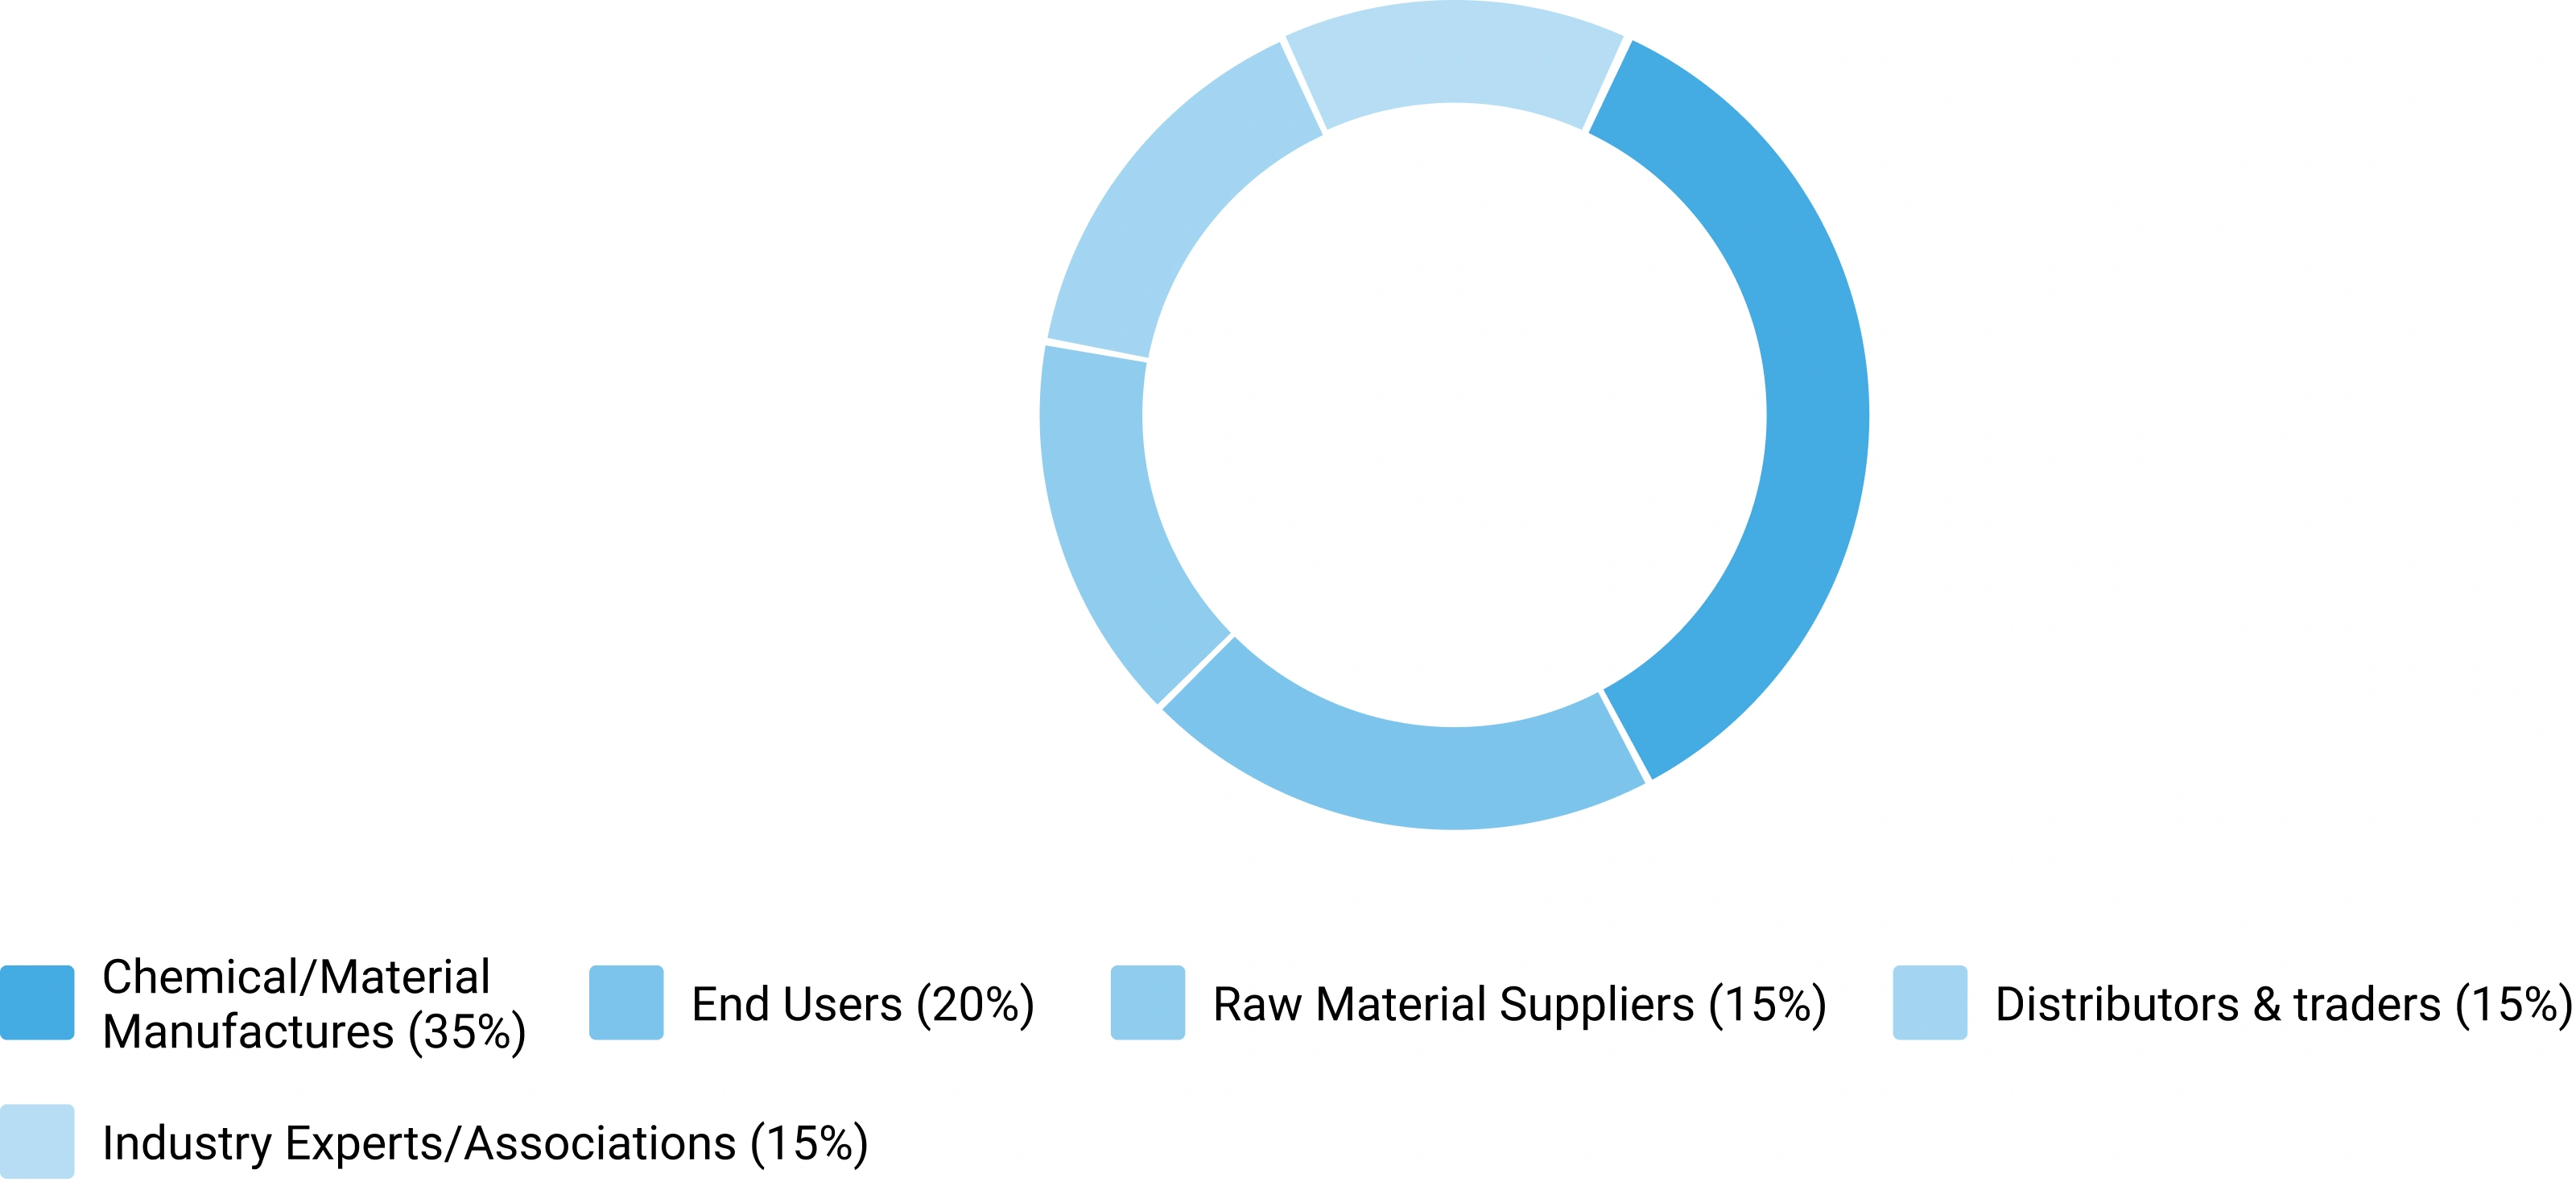
Category : Manufacturers, Suppliers, Distributors, End Users, Experts/Associations
Average Duration : 30–60 Minutes
Interview Mode : Video calls, telephonic interviews, expert consultations
Interview Format : Structured / Semi-Structured questionnaire
Focus Areas of Primary Research:
Market Size & Forecast Validation :
Revenue estimates, volume consumption, growth rates, forecast assumptions, regional demand.
Supply Chain & Value Chain Assessment :
Raw material sourcing, supply chain challenges, distribution networks, procurement practices.
Production & Capacity Analysis :
Manufacturing capacity, utilization rates, expansion projects, plant investments.
Pricing & Cost Structure Analysis :
Product pricing trends, feedstock costs, energy costs, margin pressures, pricing outlook.
Competitive Landscape Assessment :
Market share, competitor positioning, strategic initiatives, partnerships, acquisitions.
Primary Research — Stakeholder Coverage by Category
Distribution of interview respondents across stakeholder categories (% share from PPT data)
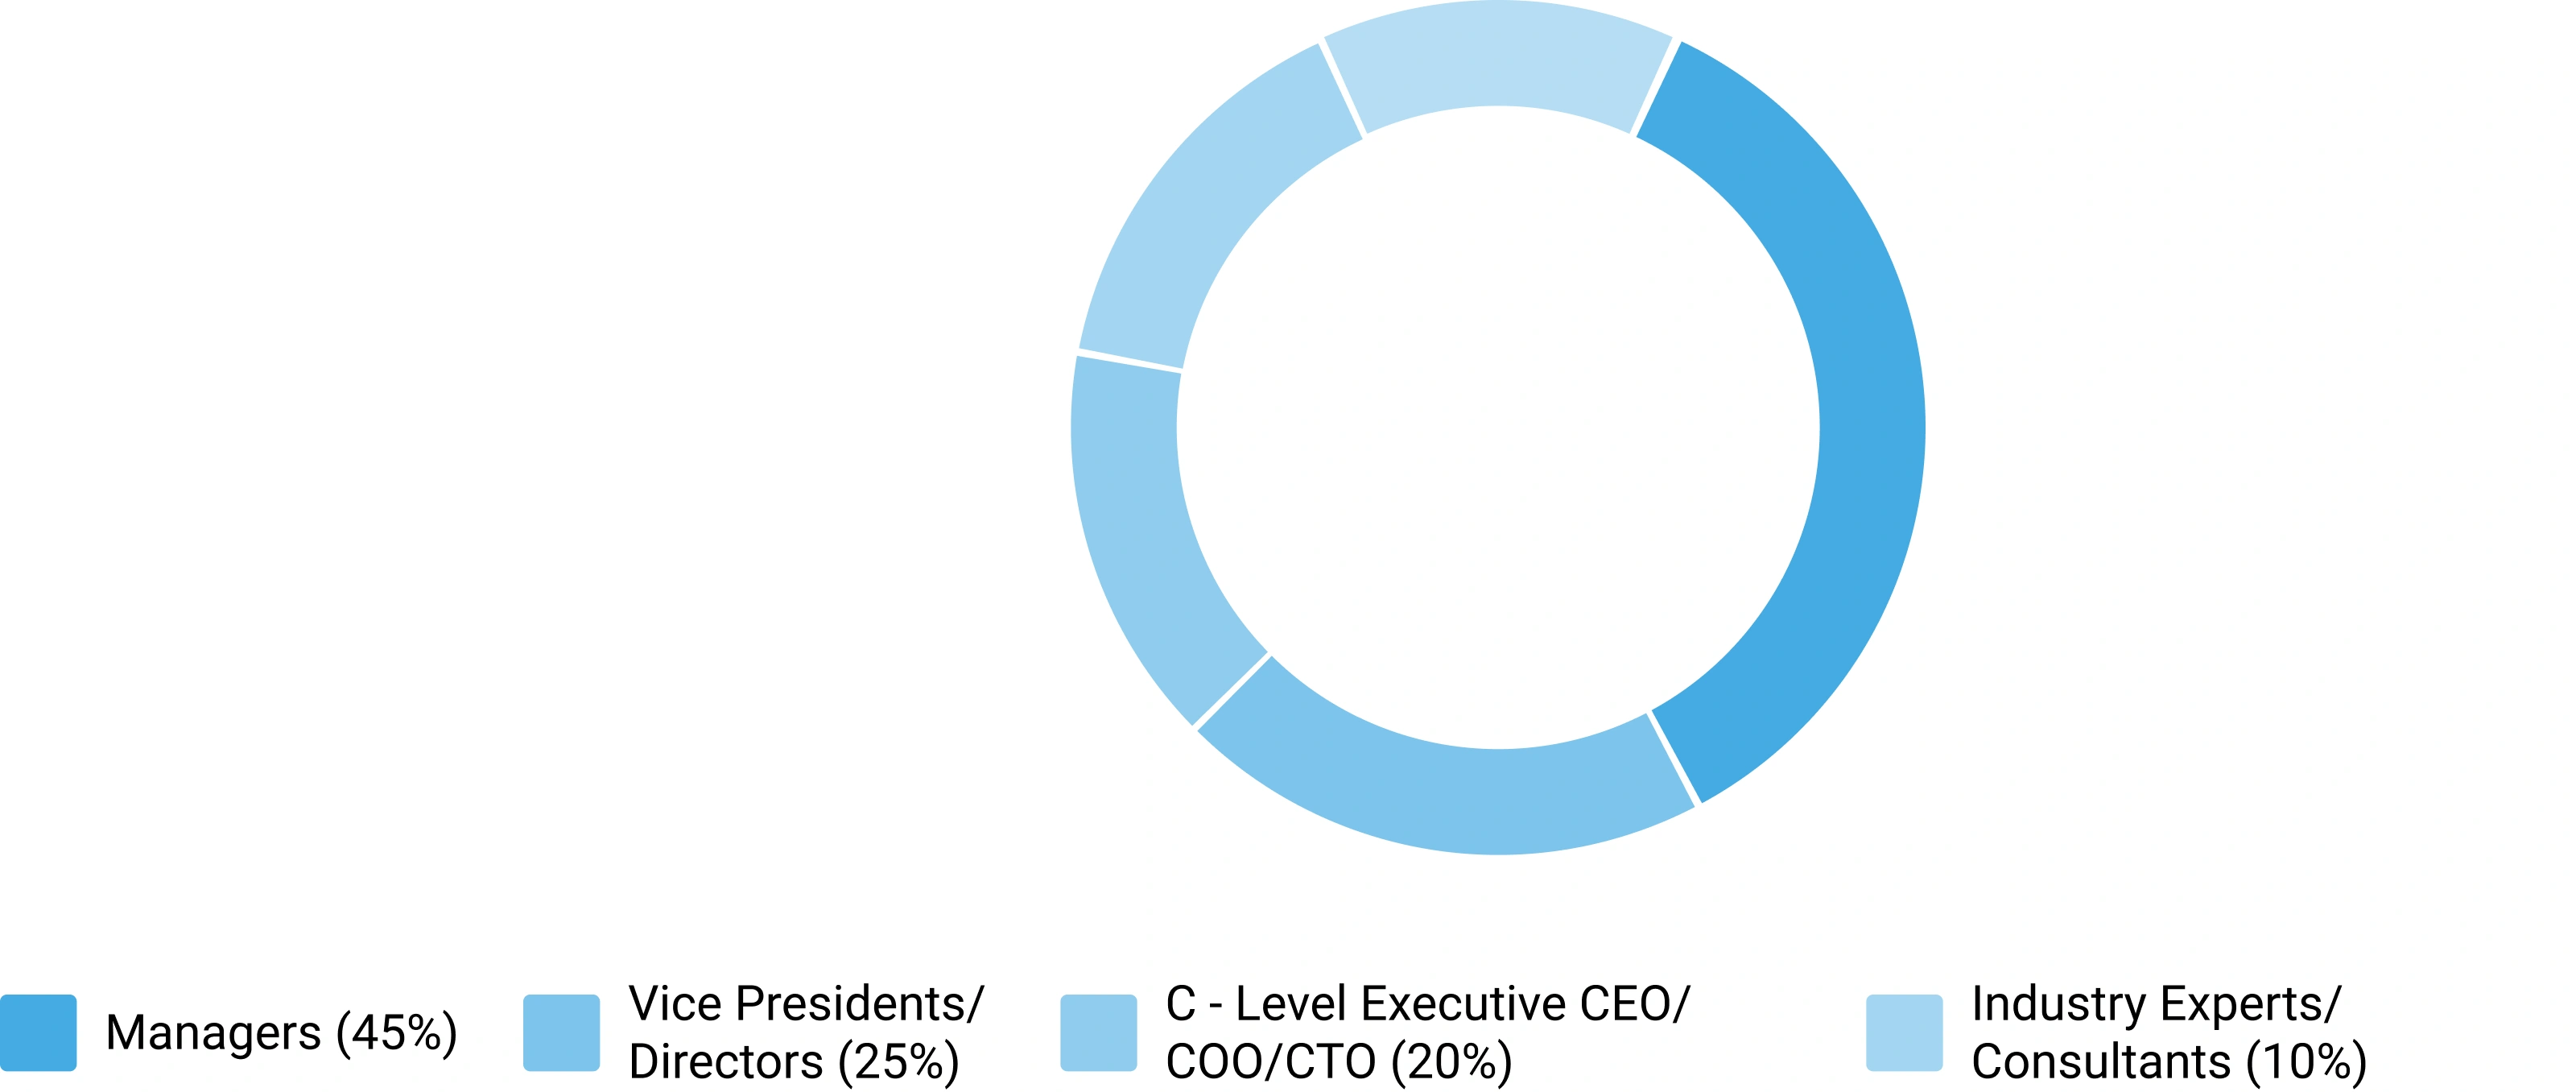
Primary Research — Respondent Designation Profile
Seniority breakdown of interview respondents (% share from PPT data)
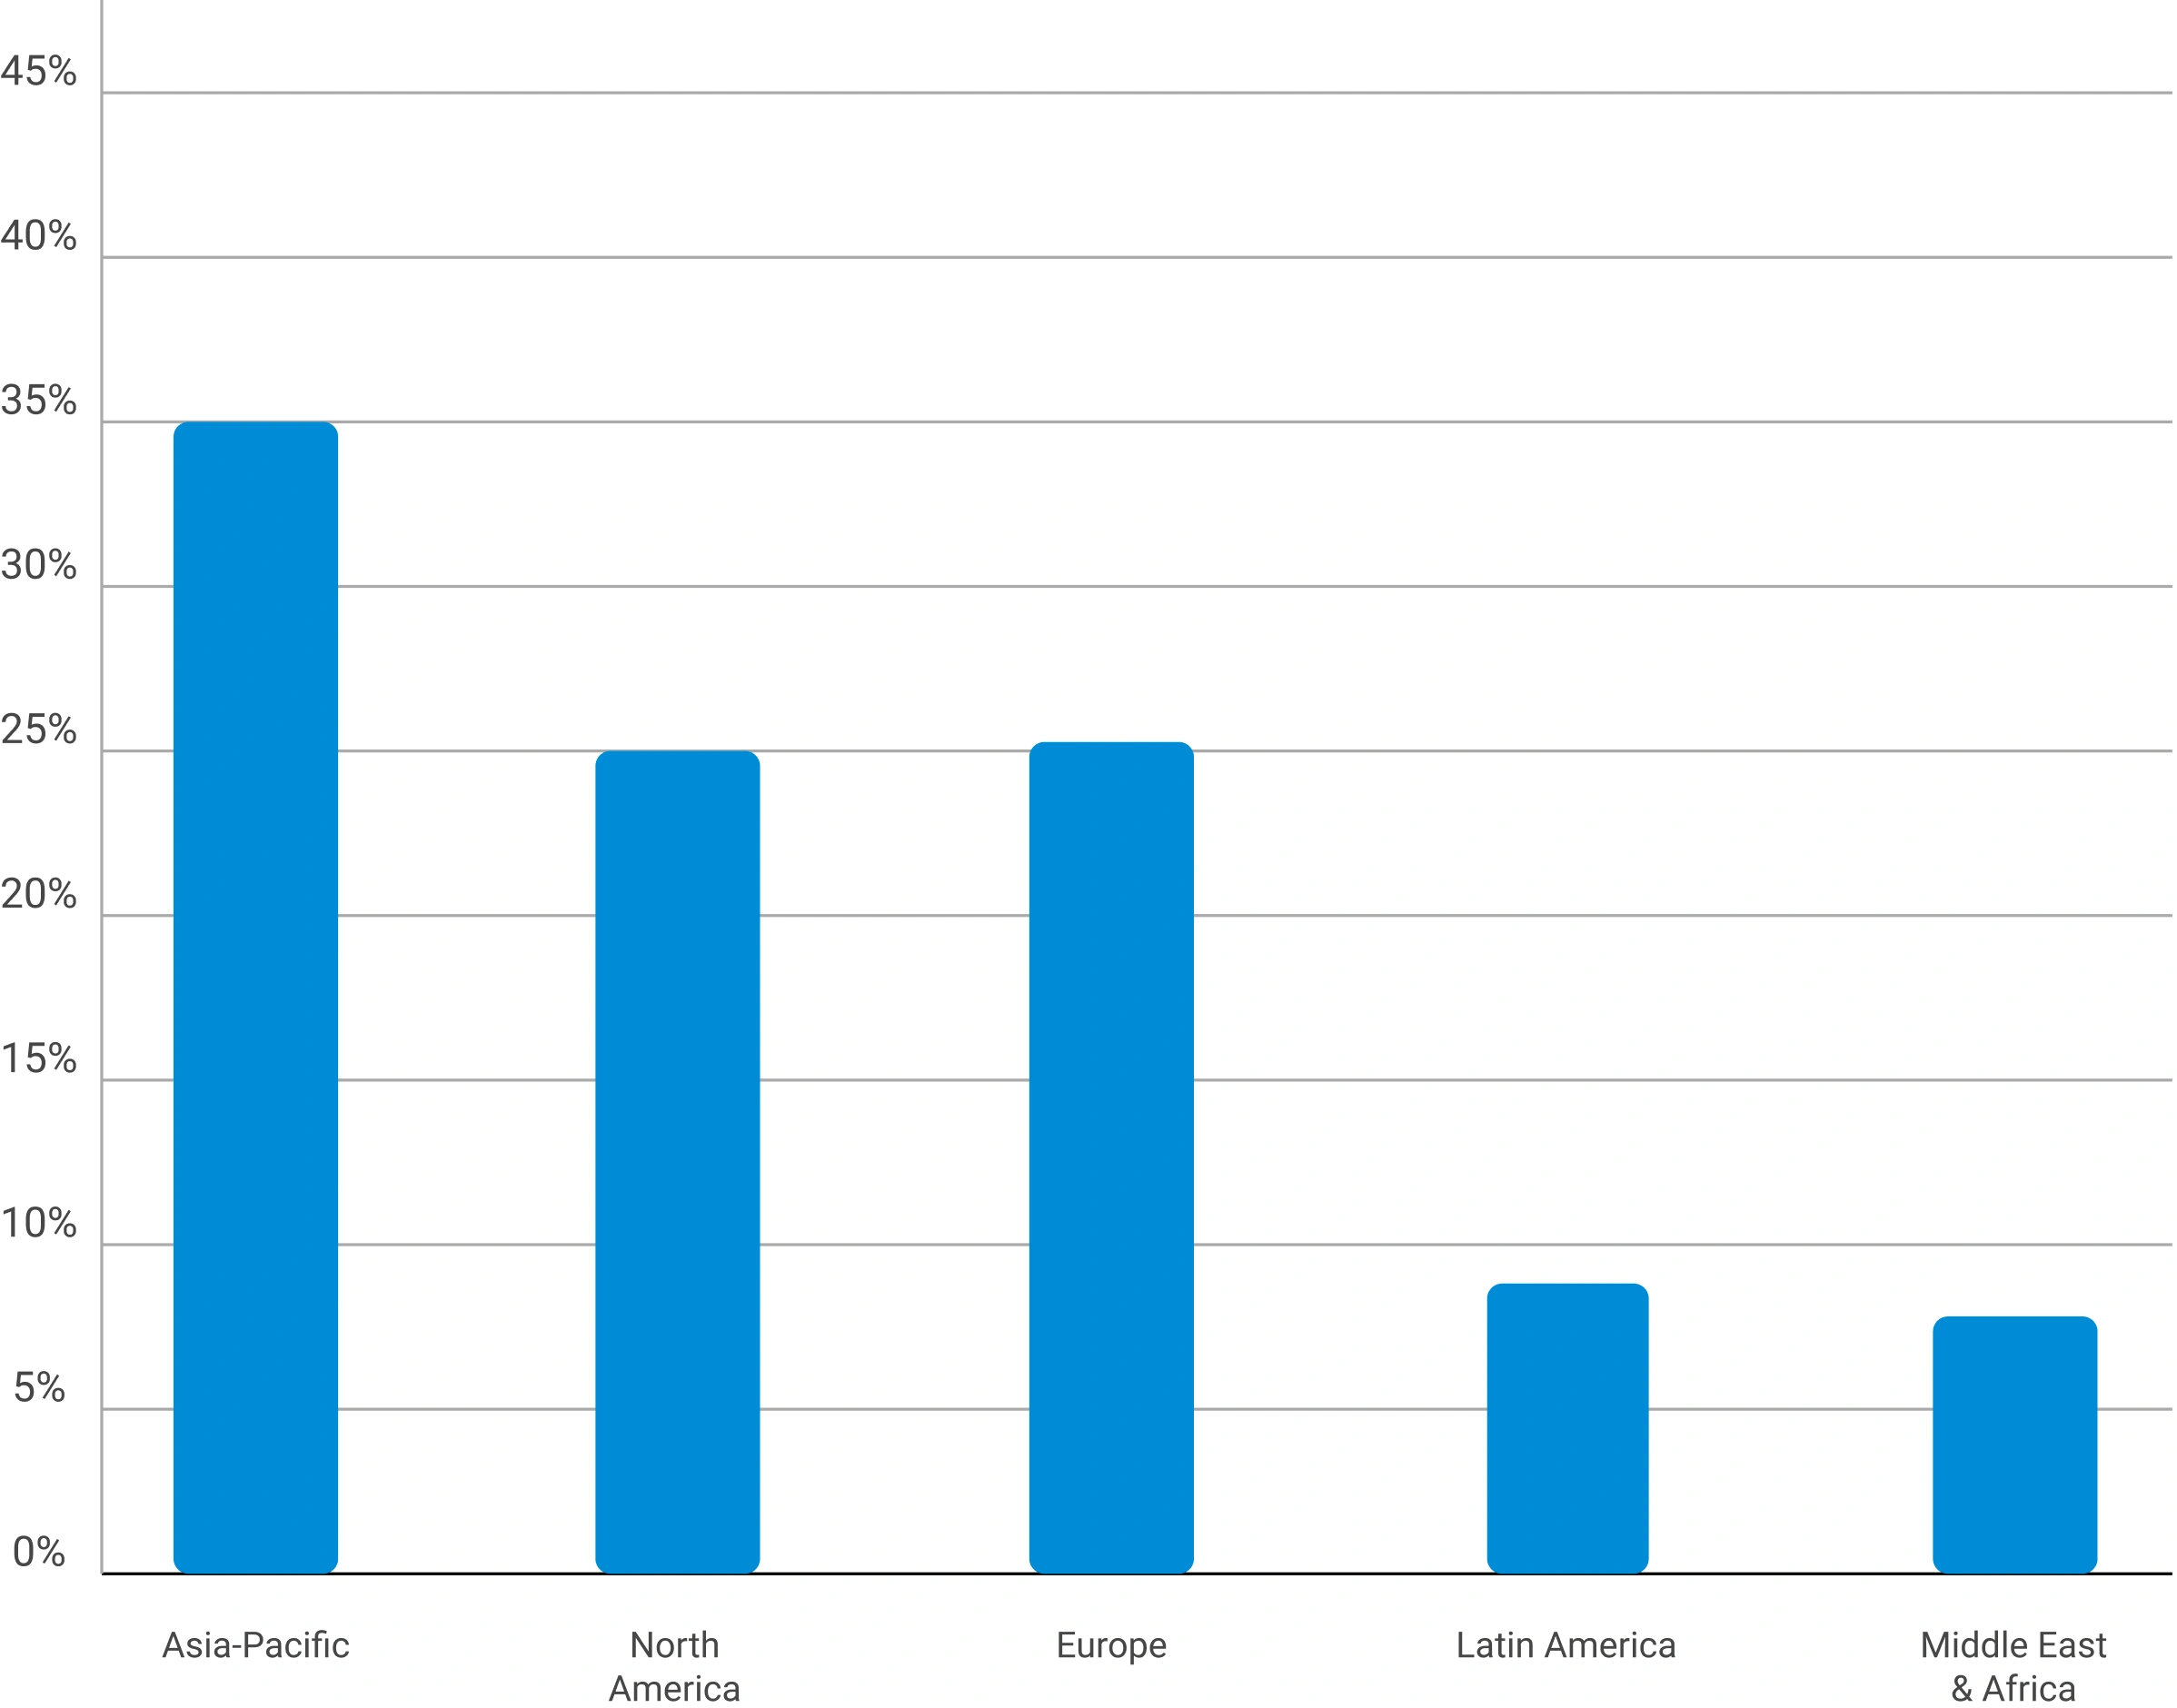
Primary Research — Geographic Coverage of Interviews
Regional distribution of primary research engagement (% share from PPT data)
Phase 6 — Data Triangulation and Market Validation
No single methodology is relied upon in isolation. Multiple independent estimation approaches are combined and reconciled to ensure consistency, accuracy, and analytical defensibility. Any material deviations between approaches are investigated and adjusted through additional validation cycles.
The final market size is derived through weighted triangulation of all validated methodologies. Any material deviations between approaches are investigated and adjusted through additional validation cycles. The outcome represents the most realistic assessment of the market based on available evidence and expert confirmation ensuring that volume and value estimates are fully consistent with one another.
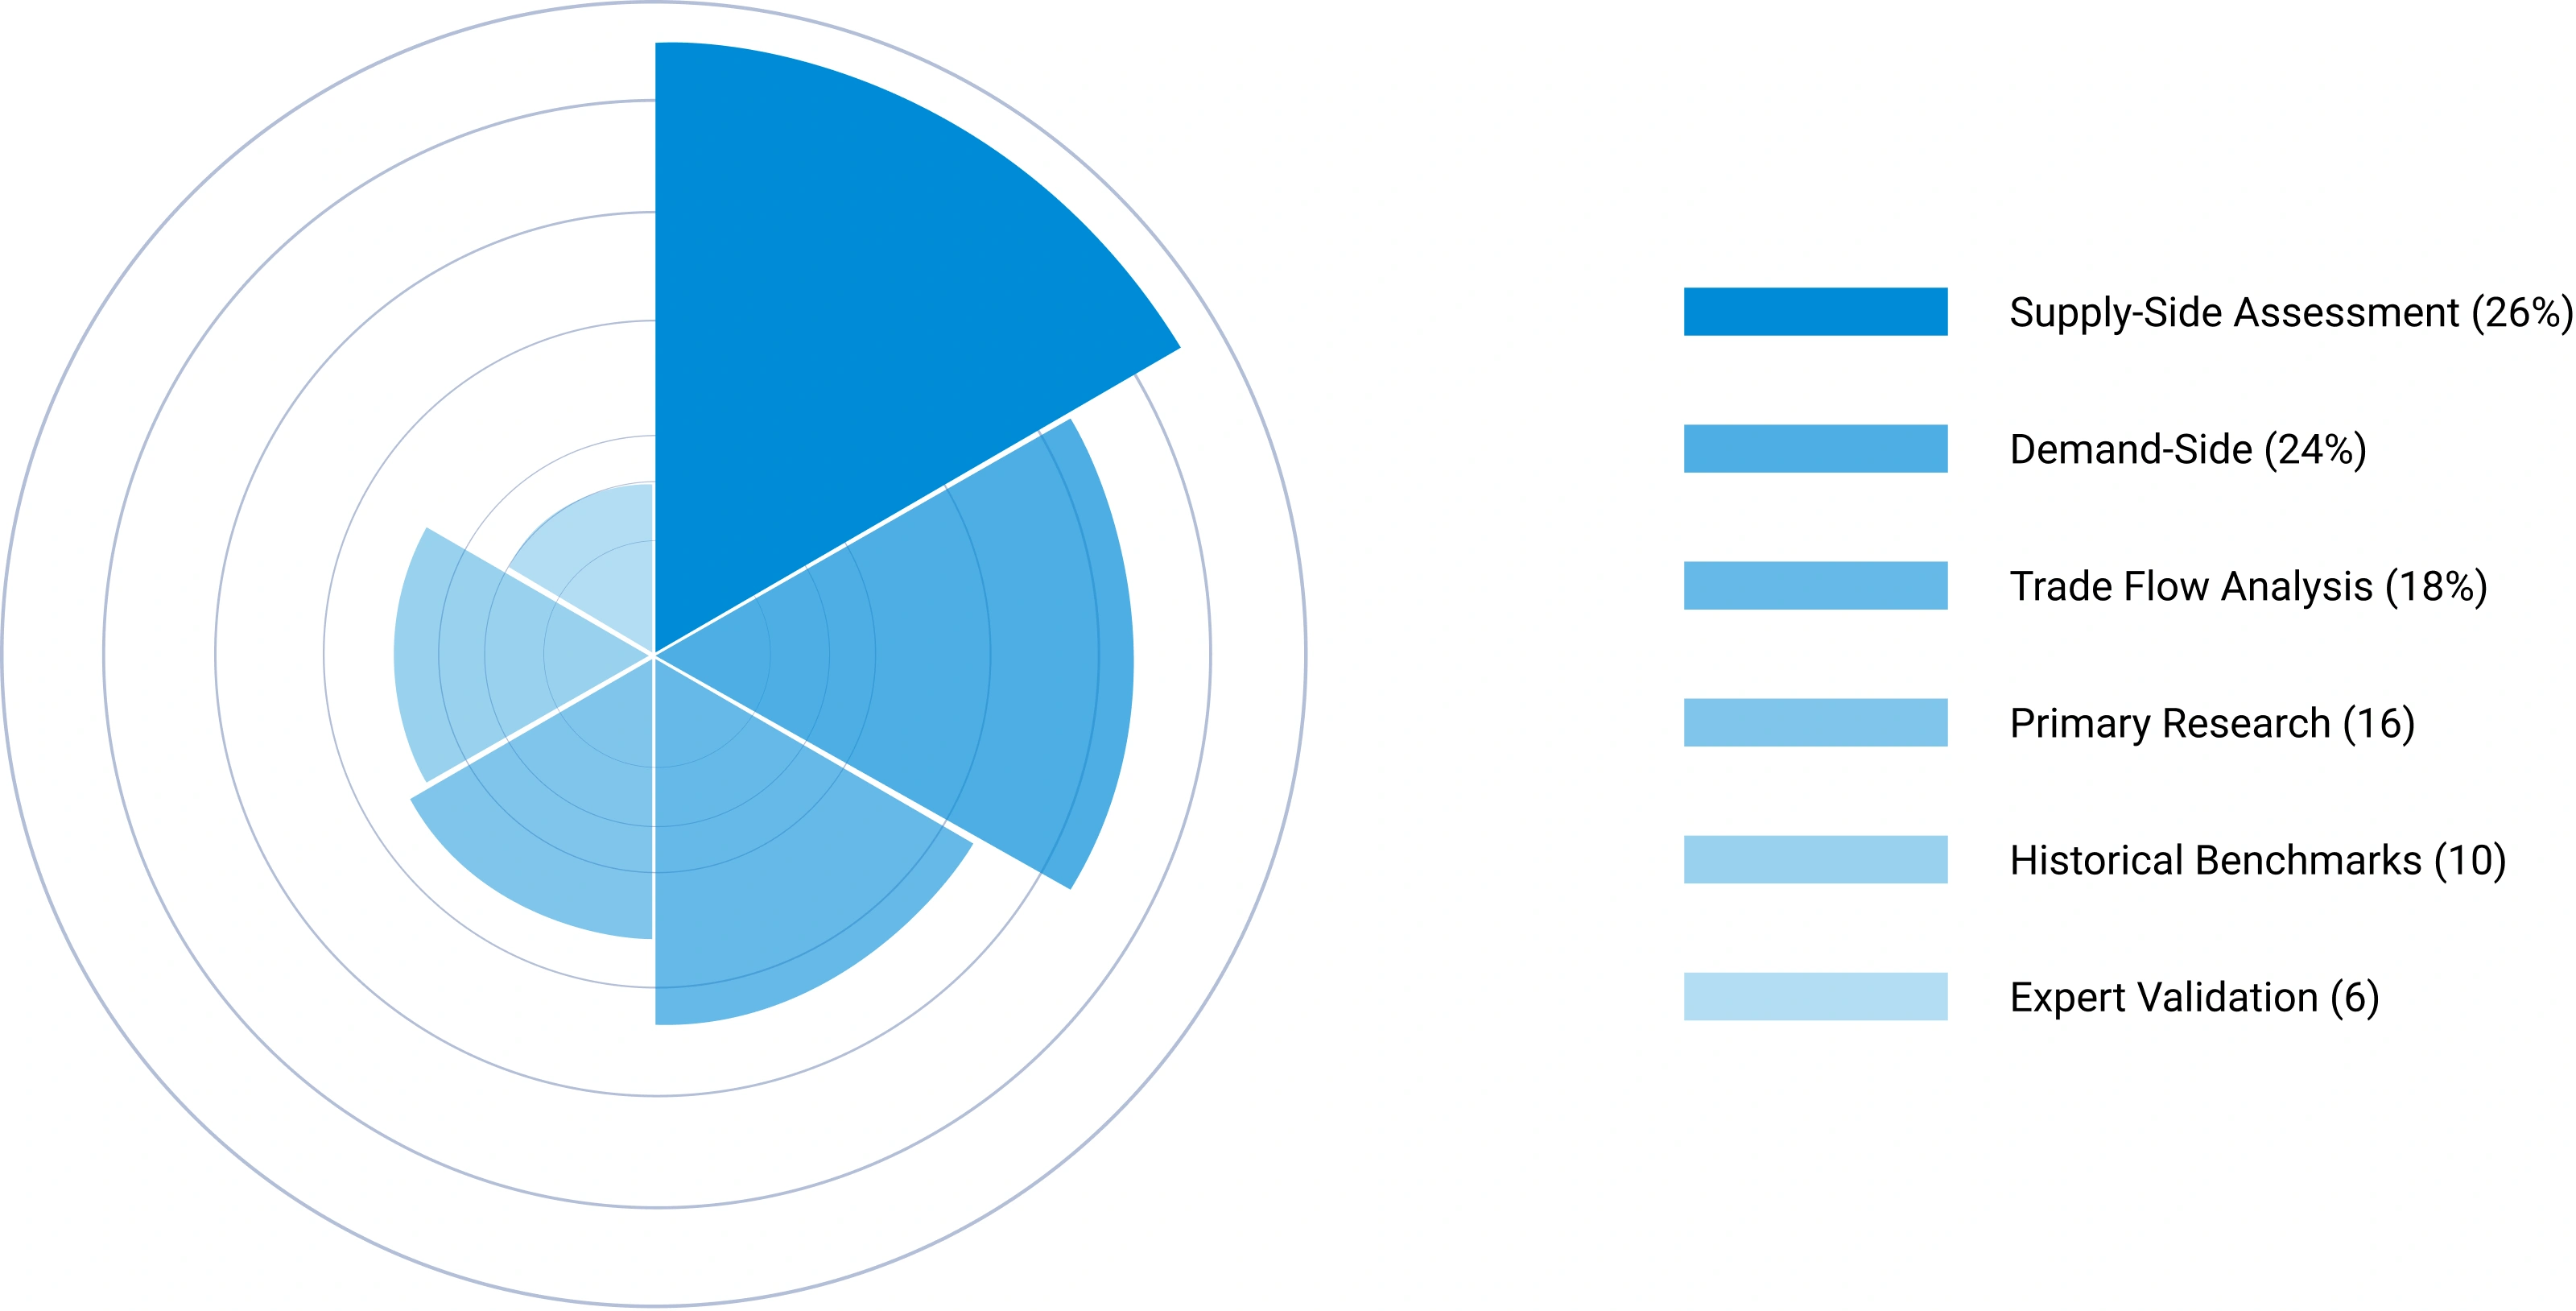
Triangulation Framework — Input Contribution Weight
Relative weight each sizing input contributes to the final reconciled market estimate
Phase 7 — Forecast Modeling: Projecting Future Market Evolution
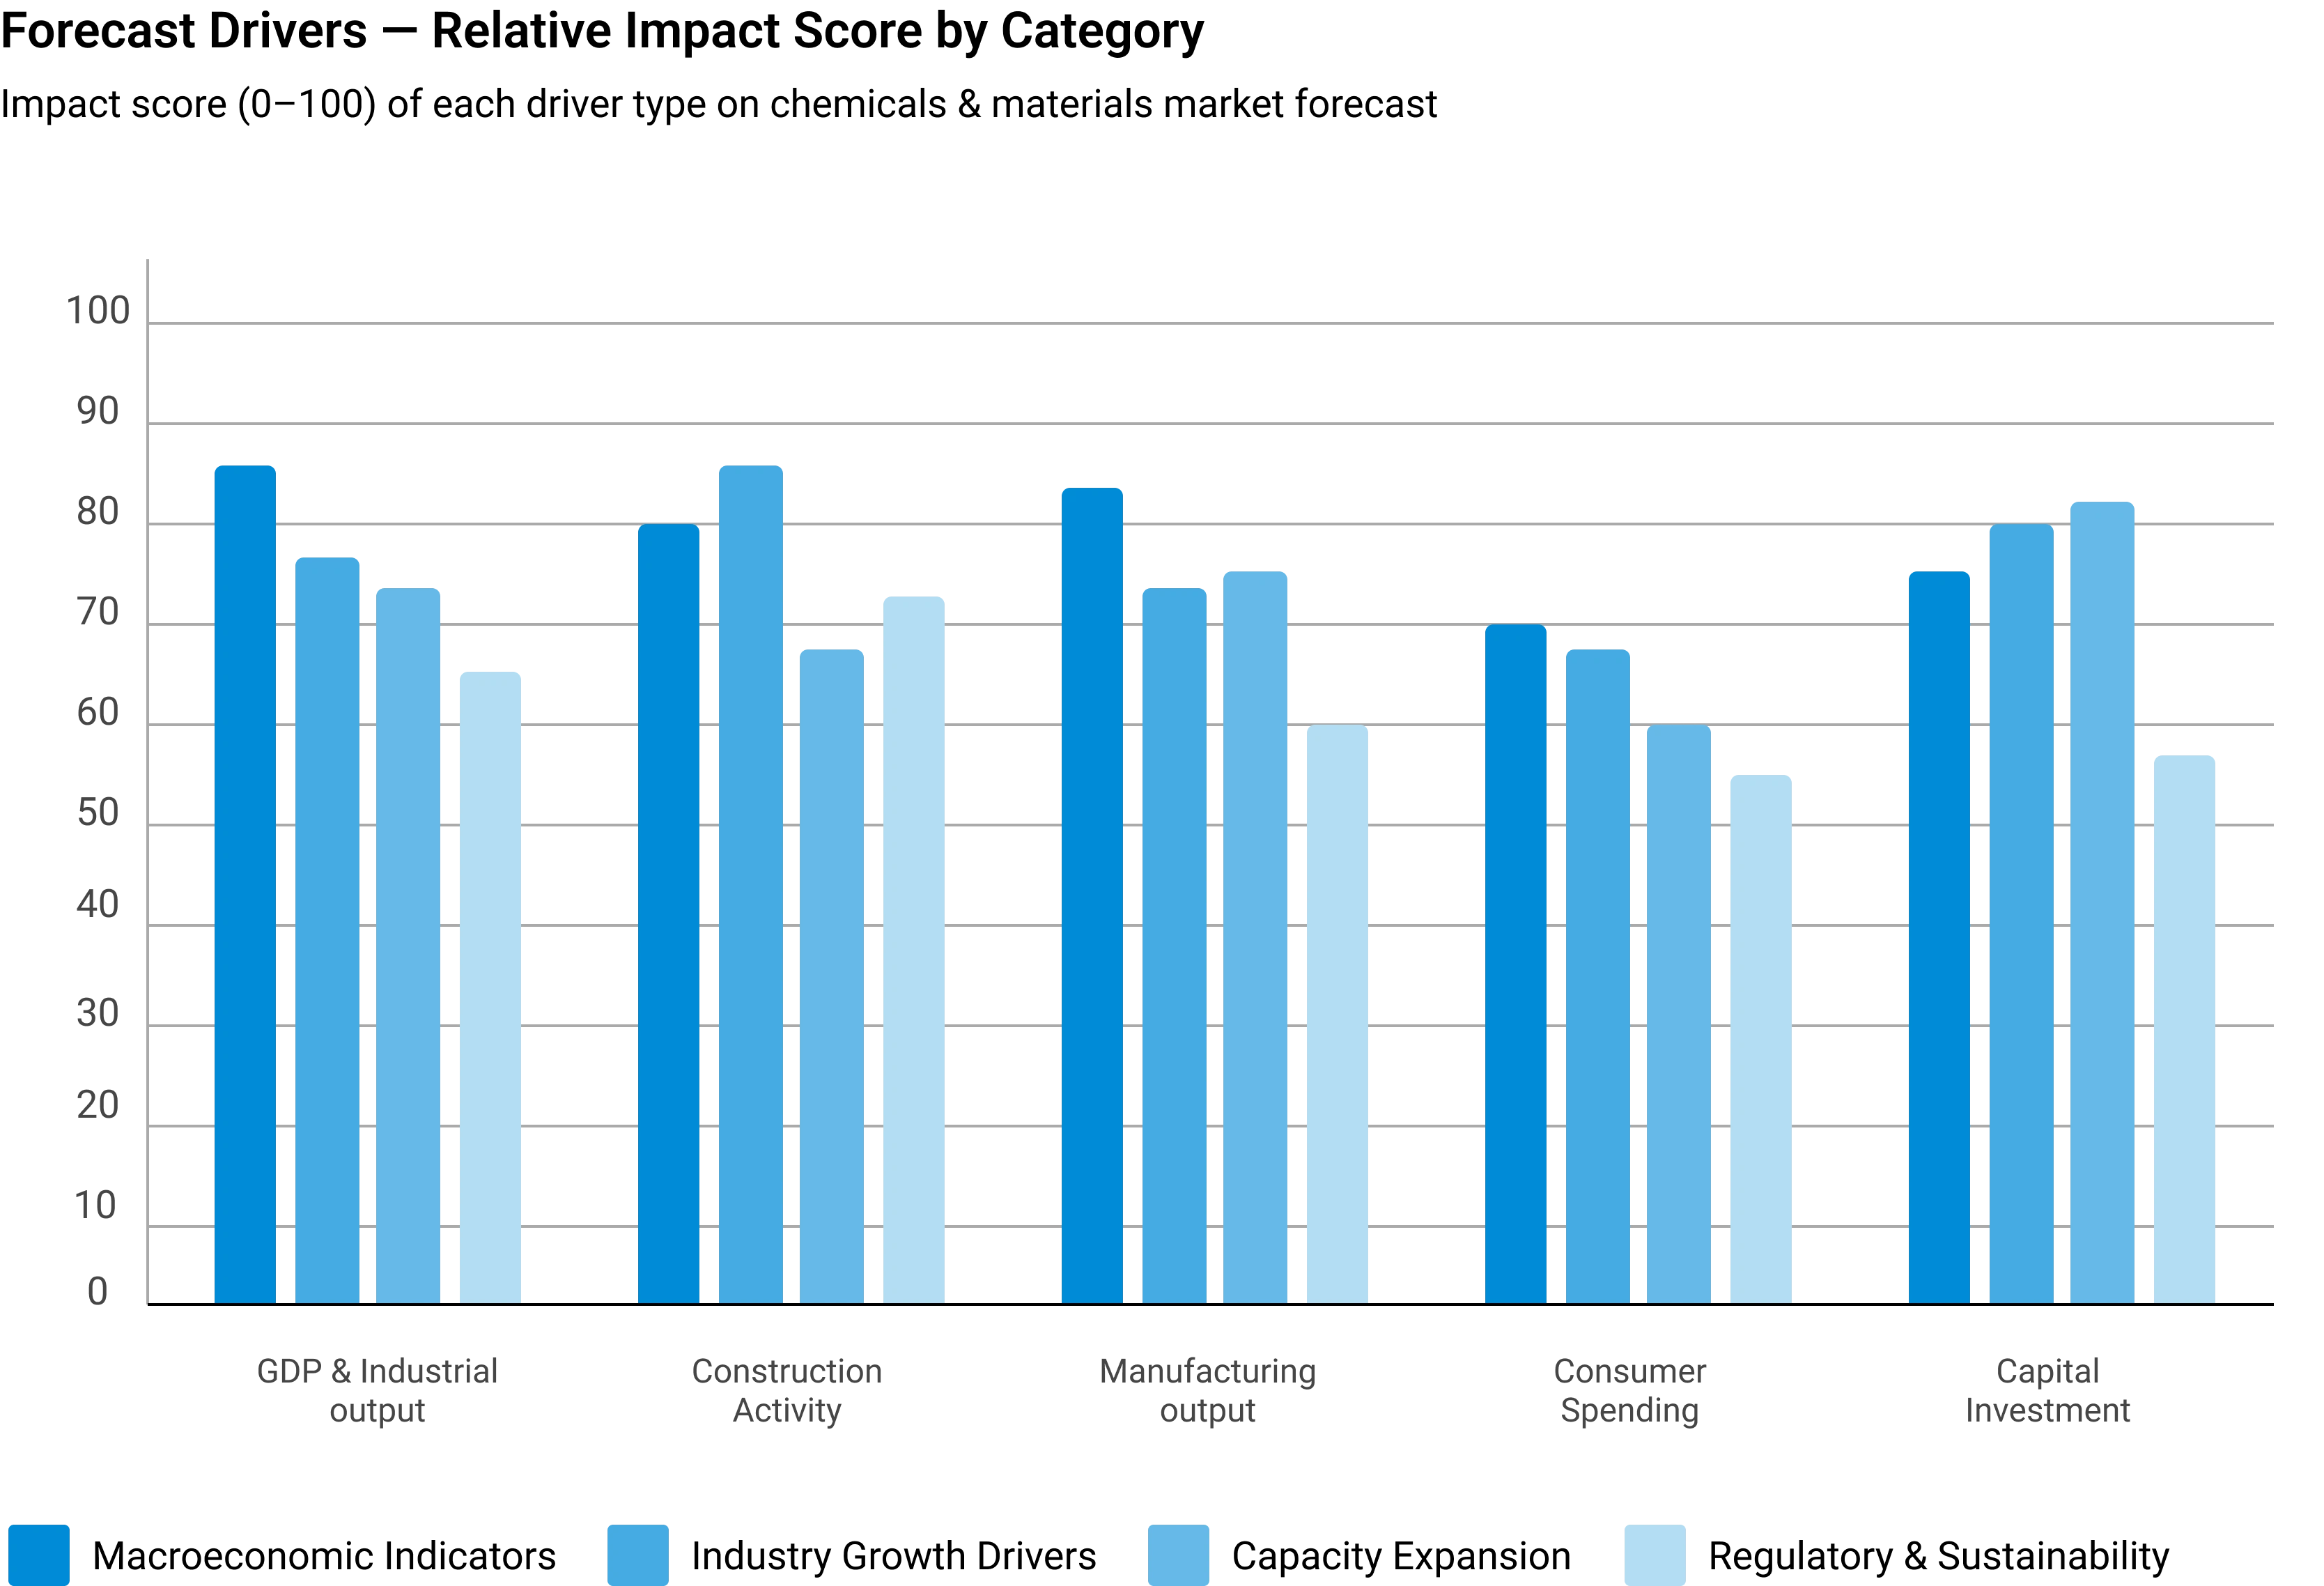
Forecasting evaluates the future trajectory of the market using a combination of quantitative indicators and qualitative assessments across economic, industry, and regulatory dimensions. Rather than simple extrapolation, each driver is independently modeled and integrated into a composite forecast.
Macroeconomic Indicators
GDP growth, industrial production, manufacturing output, construction activity, consumer spending, and capital investment form the quantitative foundation of long-term demand projections. These are applied at country, regional, and global levels.
Industry Growth Drivers
Urbanization, infrastructure development, industrialization, technological innovation, sustainability initiatives, and evolving product performance requirements are assessed at regional and industry levels — capturing both structural and cyclical demand drivers.
Capacity Expansion Analysis
Announced plant expansions, new manufacturing facilities, technology upgrades, and strategic investments are evaluated to determine future supply-demand dynamics and potential market tightness or oversupply situations.
Regulatory & Sustainability
Environmental regulations, chemical safety standards, emission reduction targets, circular economy initiatives, and sustainability requirements are incorporated as they often influence product adoption rates and market growth trajectories.
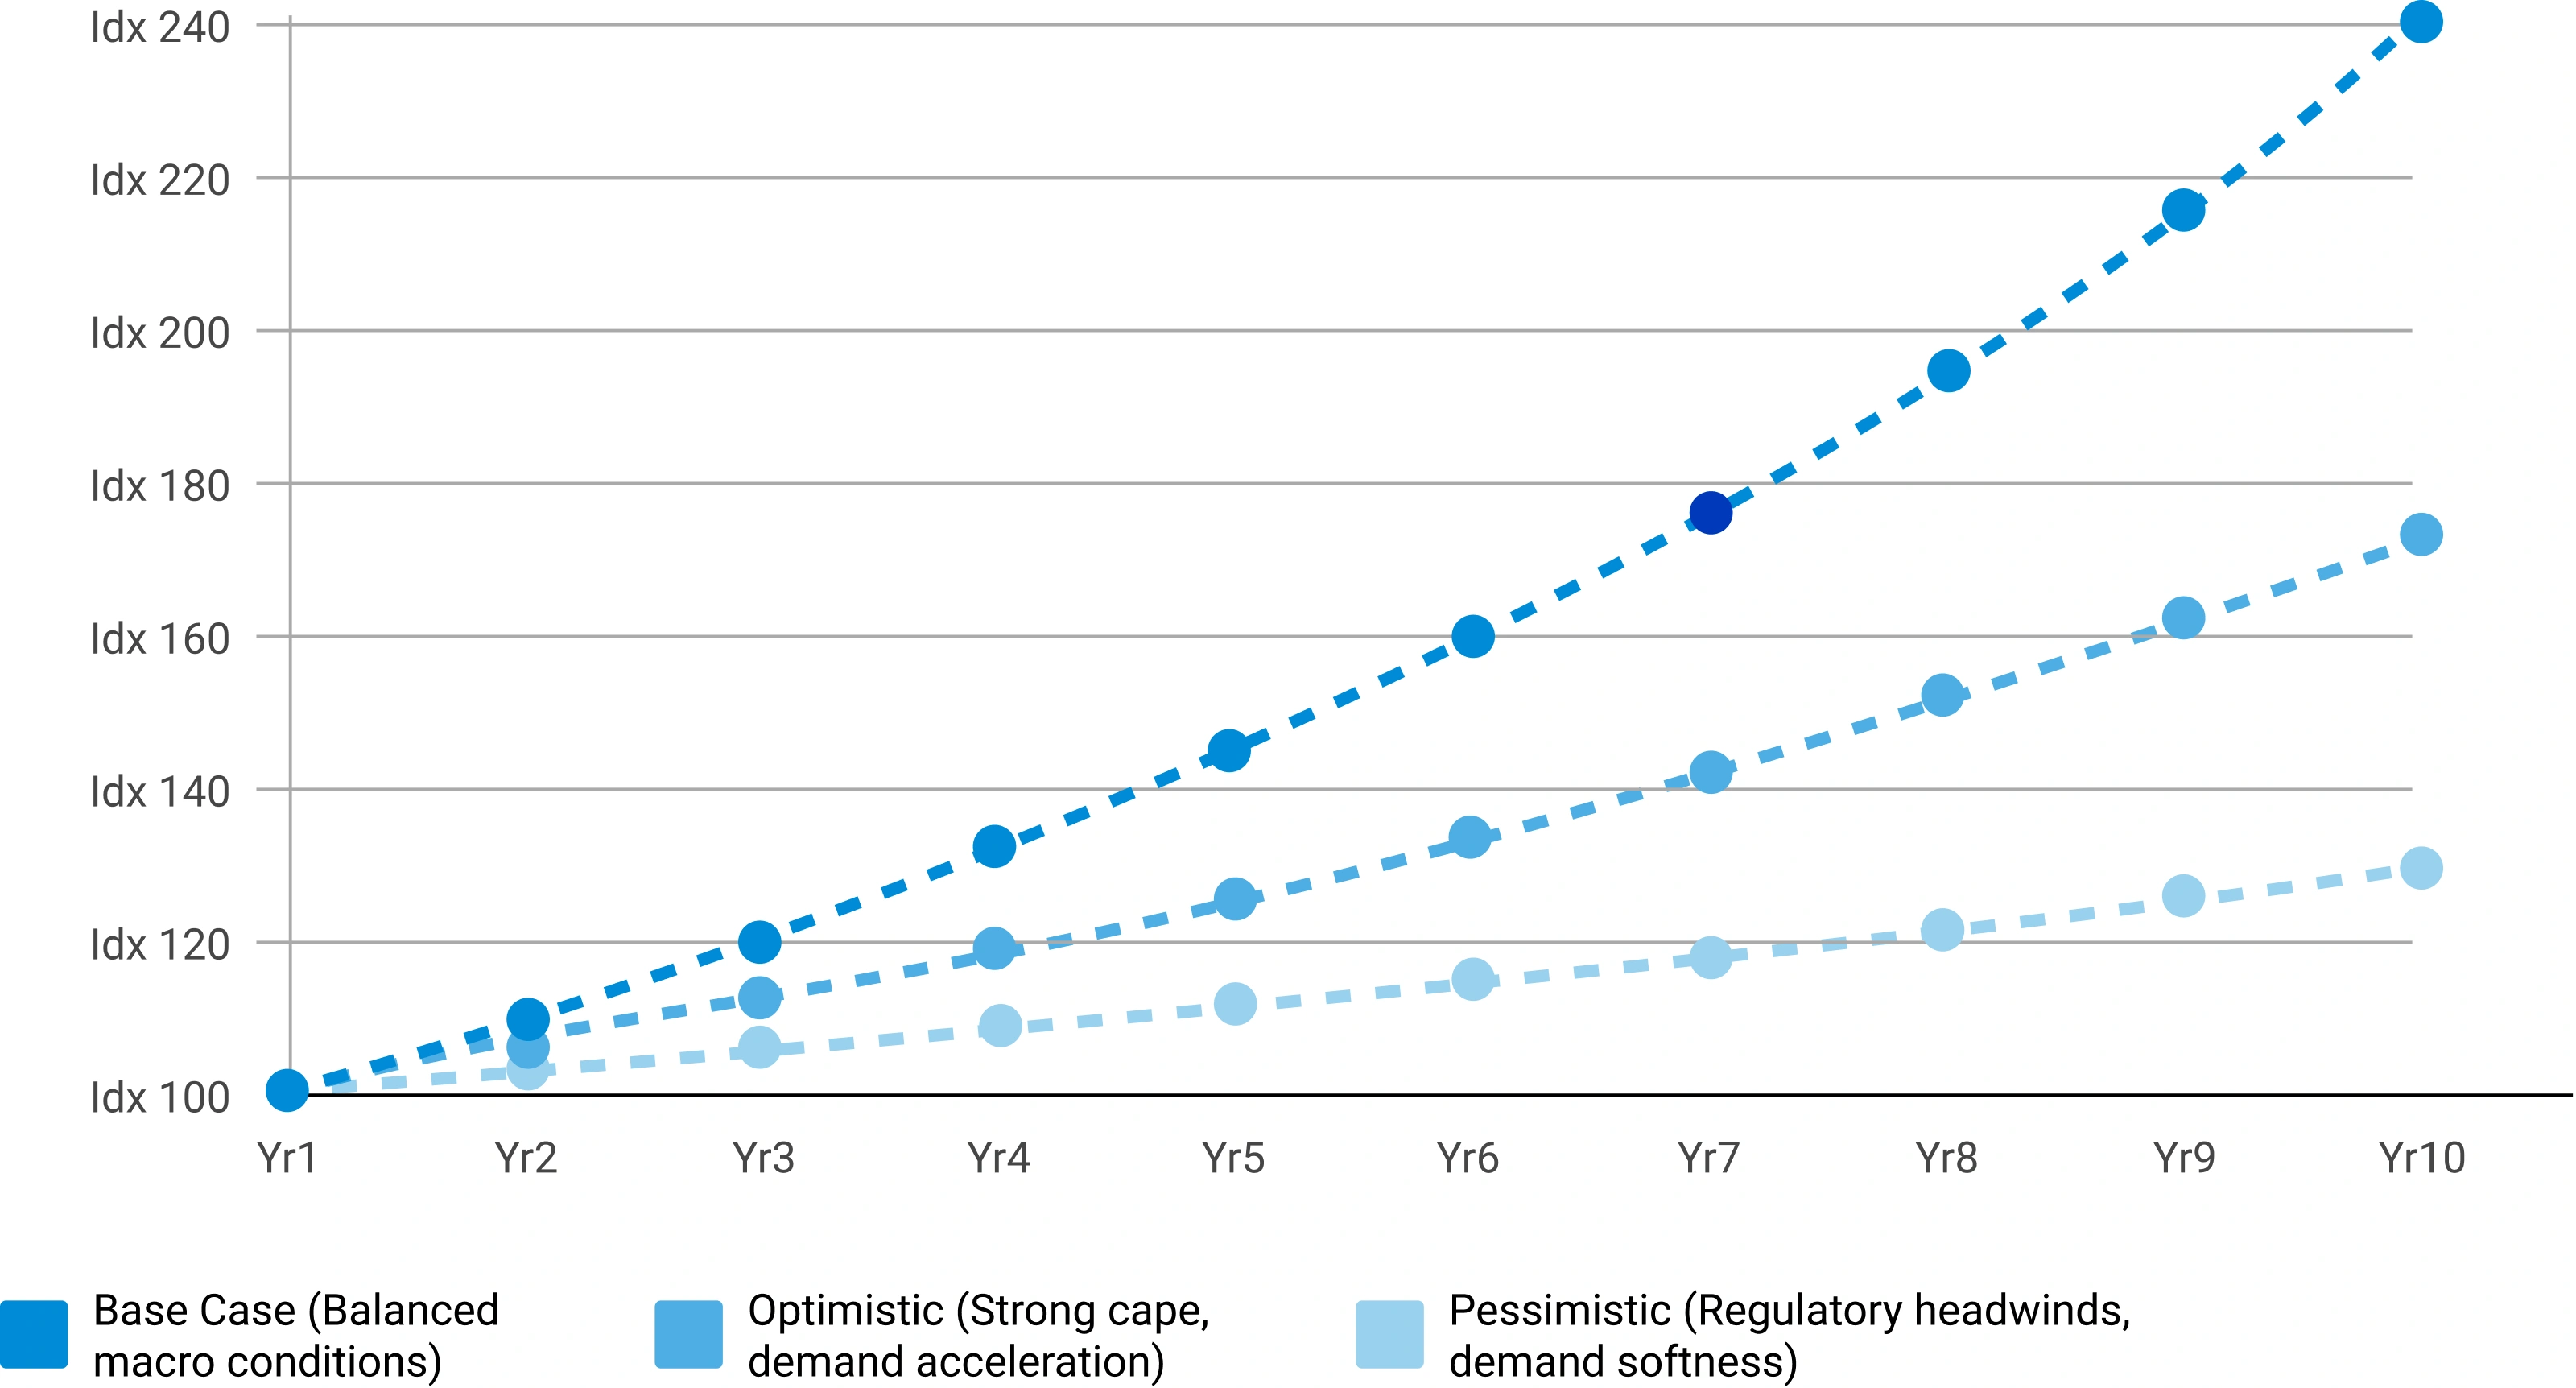
Scenario Forecast Range — Indexed Market Growth (Year 1–10)
Illustrative indexed growth trajectories across Base, Optimistic, and Pessimistic scenarios over a 10-year forecast horizon
Forecast Drivers — Relative Impact Score by Category
Impact score (0–100) of each driver type on chemicals & materials market forecast



Comments
Share your thoughts, ask a question, or provide feedback about this report.