
What is Europe Liquefied Petroleum Gas Market Size and Share?
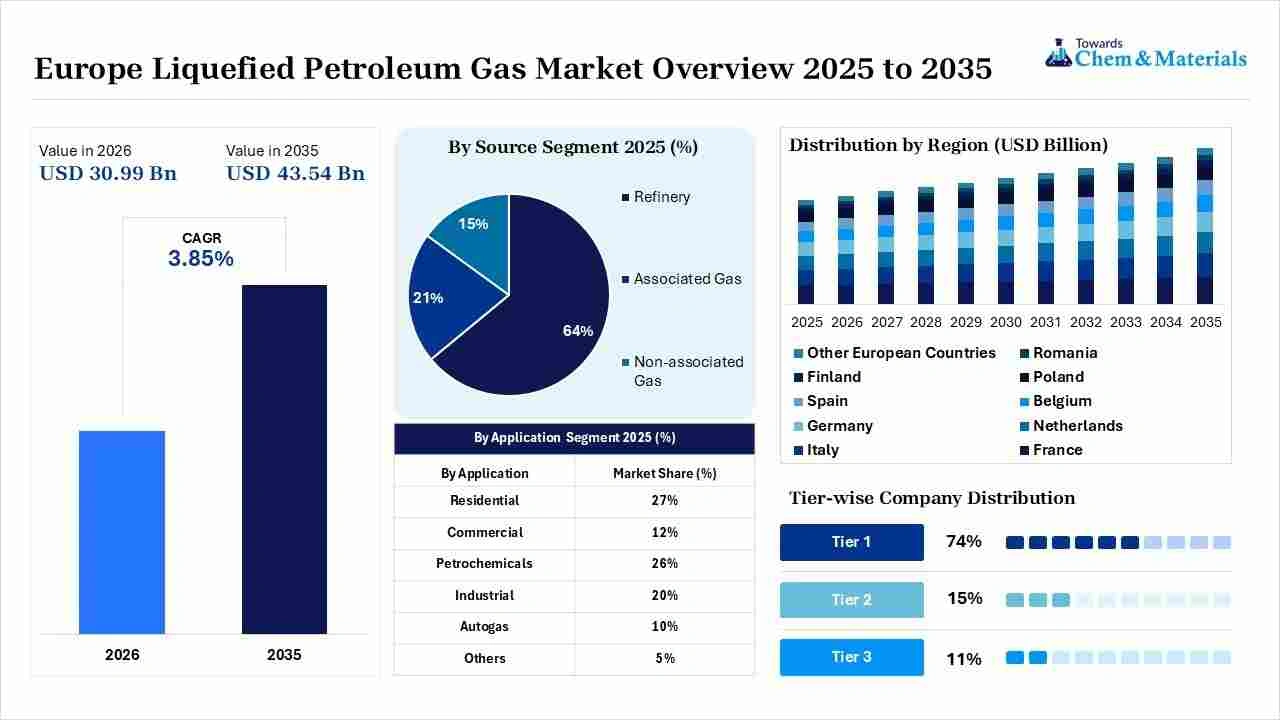
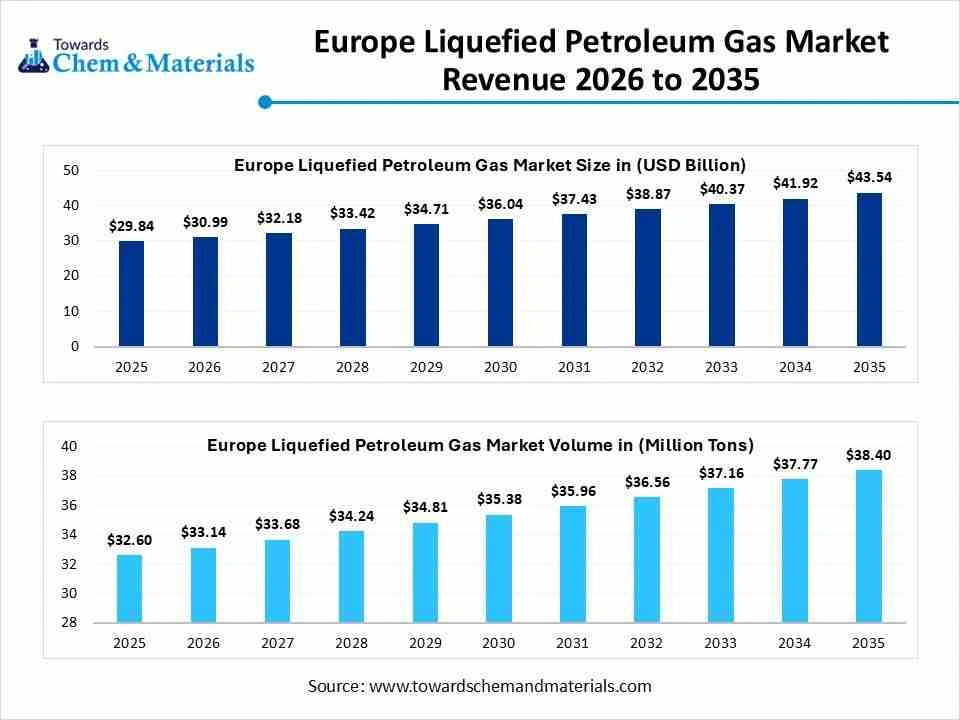
The Europe liquefied petroleum gas market size was estimated at USD 29.84 billion in 2025 and is predicted to increase from USD 30.99 billion in 2026 to approximately USD 43.54 billion by 2035 and is expected to grow at a CAGR of 3.85% during 2025-2035. The growing use in key industries as a fuel source and as a petrochemical feedstock for manufacturers of lower olefins and other domestic organic chemicals. The key players collaboration in Europe market supports long-term supply contracts through joint ventures and strategic partnerships, which helps in stabilizing the fuel distribution and supports the clean energy transition, supporting growth of the market.
Market Highlights
- By country, France dominated the Europe liquefied petroleum gas market with a share of 17.80% in 2025 and is expected to grow at a CAGR of 3.88% over the forecast period.
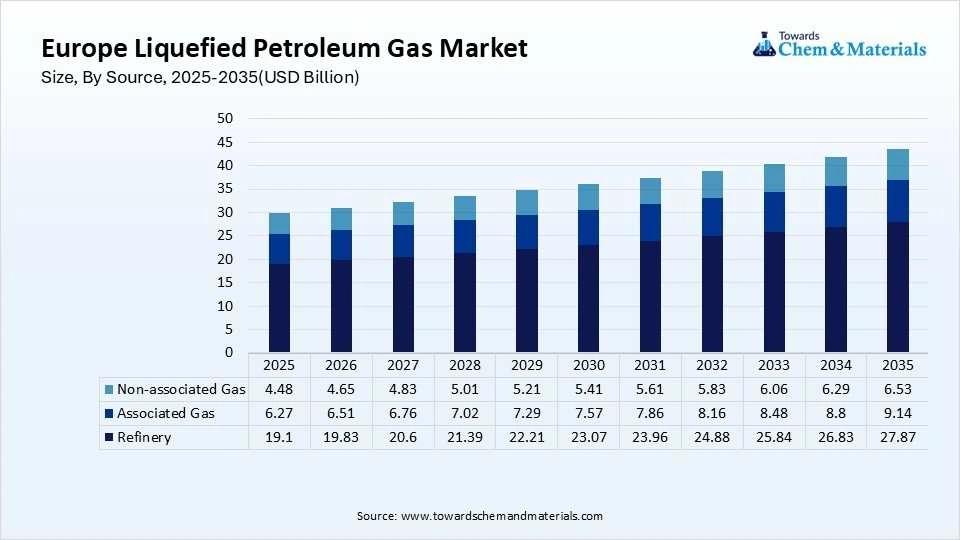
- By source, the refinery segment dominated the market with a 64% share in 2025 and is expected to grow at a CAGR of 3.42% over the forecast period.
- By source, the non-associated gas segment held a 15% market share in 2025 and is expected to have the fastest growth with a CAGR of 4.76% in the forecast period.
- By application, the residential segment dominated the market with a 27% share in 2025 and is expected to grow at a CAGR of 3.12% over the forecast period.
- By application, the petrochemical segment held a 26% market share in 2025 and is expected to have the fastest growth with a CAGR of 4.82% in the forecast period.
- By product, the propane segment dominated the market with a 48% share in 2025 and is expected to grow at a CAGR of 4.05% over the forecast period.
- By product, the propane-butane mix segment held a 20% market share in 2025 and is expected to have the fastest growth with a CAGR of 4.38% in the forecast period.
According to Towards Chemicals and Materials Analytics and Consulting, the Europe Liquefied Petroleum Gas Market volume was valued at 32.60 million tons in 2025 and is expected to surpass around 38.40 million tons by 2035, accelerating a compound annual growth rate (CAGR) of 1.65% over the forecast period from 2026 to 2035.
Market Overview
Low-Carbon Transition
LPG is widely used due to increased adoption of LPG as a low-carbon alternative fuel, as there is a shift towards cleaner energy sources through government initiatives, which help reduce greenhouse gas emissions and support climate neutrality targets, which increases the shift towards cleaner energy adoption and supporting growth. The increased adoption of Autogas vehicles and internal combustion engine supporting the lower transportation emissions, increasing Autogas demand. Accelerated investment in optimizing distribution networks and supply restructuring, which shifts supply sources, followed by restrictions on Russian LPG.
The strong demand for industrial and residential use for chemical feedstocks, rural space and water heating. The government-backed initiative like transition to BioLPG and renewable liquid gases accelerated by government mandates like biofuel mandates and production incentives for hydrotreated vegetable oil and sustainable aviation fuel and EU innovation and research funds for heavy public funding thorough Horizon Europe and the ETS Innovation Fund.
- For instance, Italy implemented the "Ecobonus Retrofit" program, providing direct subsidies of €400 for vehicle owners to convert existing Euro 4 or higher combustion cars to LPG. The Ecobonus portal provides financial incentives for installing new LPG or methane fuel systems in existing vehicles.
Global Investment Flow for Europe Liquefied Petroleum Gas Market 2026
The growing investment by the government and major key players in the region supports growth through investment in production facilities and innovation in the building of the product development.
The government incentives and high investment through subsidies and programs, as there is heavy demand for biofuel in both commercial and residential setups.
- In February 2026, the UK renewable liquid gas supply industry has committed £1 billion in total decade investments, with £415 million planned through 2030 to scale up net-zero alternatives. The supply is set to rise by over 35 million litres; bioLPG is a major factor in decarbonising heat.(Source: www.heatingandventilating.net)
Report scope
| Report Attributes | Details |
| Market Size in 2026 | USD 30.99 Billion/ 33.14 Million Tons |
| Expected Size in 2035 | USD 43.54 Billion/ 38.40 Million Tons |
| Growth Rate | CAGR of 3.85% |
| Base Year of Estimation | 2025 |
| Forecast Period | 2025-2035 |
| Segment Covered | By Source, By Application, By Product |
| Key Companies Profiled | Exxon Mobil Corporation, Chevron Corporation, ConocoPhillips, Gazprom PJSC, Equinor ASA, Eni S.p.A., Novatek PAO, UGI Corporation (AmeriGas), Vitol, QatarEnergy, Abu Dhabi National Oil Company (ADNOC), Linde plc, Primagas (SHV subsidiary), Rheingas, Petronas |
Market Growth Trends:
- The growing energy transition in Europe uses LPG, which supports the replacement of high-emission fuels emission fuels which are commonly used, like coal, for residential and commercial heating, which is a growing trend in the market.
- The increased application and expansion of automotive adoption, which helps in lowering carbon emissions and makes it affordable from brands like Dacia scaling LPG-powered vehicle demand.
- Supply chain diversification, as there is heavy reliance on imports and a growing need for chemical applications and rising feedstock needs, boosts growth.
Smart Network Infrastructure
The European liquefied petroleum gas industry shifted towards smart grid automation, predictive maintenance, predictive maintenance and precise emission tracking through AI integration, as it helps in cutting the costs, and helps boosts supply chain security, and aligns with strict environmental regulations, supporting growth. Smart infrastructure uses AI to manage the gas and energy distribution networks through smart networking; AI helps in blending renewable alternatives smoothly, and investment growth with AI-backed monitoring tools supports growth.
Supply Chain Analysis of Europe Liquefied Petroleum Gas Market:
LPG Production & Processing
- Liquefied petroleum gas, primarily consisting of propane and butane, is produced as a by-product of natural gas processing and crude oil refining. It is subsequently processed, purified, stored under pressure, and distributed for residential, commercial, industrial, agricultural, and automotive applications.
- Key Players: Shell, TotalEnergies, BP, UGI Corporation.
- UGI Corporation operates LPG distribution businesses across multiple European countries through UGI International, supplying residential, commercial, industrial, agricultural, wholesale, and autogas customers.
Quality Testing & Certification
- LPG must comply with requirements covering composition, purity, vapor pressure, combustion characteristics, storage, transportation, and handling safety. For automotive LPG, EN 589:2024 specifies requirements and test methods for marketed and delivered LPG used in LPG-powered vehicles.
- Key Authorities & Standards: European Committee for Standardization, International Organization for Standardization, EN 589, European Union regulatory framework.
- Shell supplies LPG and other energy products across international markets, with its fuel operations subject to applicable product-quality, transportation, and safety requirements.
Distribution to End-Use Industries
- LPG is distributed through cylinders, bulk storage systems, pipelines, terminals, road transportation, and retail fueling networks to residential and commercial heating, cooking, industrial processing, agriculture, power generation, and automotive applications.
- Key Suppliers: UGI Corporation, TotalEnergies, Shell.
- TotalEnergies participates in the LPG value chain through production, trading, storage, and distribution activities, supplying LPG for residential, commercial, industrial, and mobility applications across European and international markets.
Sustainability Analysis of European Liquefied Petroleum Gas
European liquefied petroleum gas and its renewable alternatives offer an immediate, lower-carbon energy bridge for off-grid and rural sectors, emitting 12% less than oil while transitioning toward net-zero targets. The growing shift towards renewable liquid gases and aligning with industrial standards 4with industrial standards through a framework. The environmental and operational performance, by lowering emissions and aligning with sector commitments and decarbonization pathways, aligns with environmental standards.
What is Liquefied Petroleum Gas?
Liquefied petroleum gas is a portable fossil fuel mixture primarily made of propane and butane that becomes liquid under moderate pressure. The gas consists of propane and butane, which should align with quality standards and rules across Europe, such as DIN EN 589. The LPG stays liquid at room temperature when it is stored at low pressure. It is produced through crude oil refining and natural gas extraction, also produced as a renewable liquid gas co-product of sustainable aviation fuel and hydrogenated vegetable oil processes.
European Liquefied Petroleum Gas Premium Pricing Analysis
European liquefied petroleum gas and natural gas prices have surged to multi-year highs, driven by a heavy geopolitical risk premium tied to Middle East disruptions and tight winter storage. The price is affected by the Strait of Hormuz, which largely constrains critical regional energy transit, inflating costs which results in a higher cost of the product. The global competition for non-Gulf LNG and logistics constraints continue to elevate inland landed costs. The price in the coming decade will decrease due to increased use and demand and domestic bio-based production.
Europe Liquefied Petroleum Gas Market Carbon Tax Analysis
The European carbon taxes and regulations, such as the EU Emissions Trading System and the Carbon Border Adjustment Mechanism, directly increase supply costs and threaten to split global gas and LNG markets. The increased gas imports result in higher import prices and also add the full carbon border taxes to gas imports, resulting in increased costs of the product. Strict EU monitoring and emissions regulations directly result in expenses and cut emissions to stay competitive in Europe. The growing shift towards bio-based and lower-carbon emissions protocols and industrial shift will help in lowering the carbon tax.
Europe Liquefied Petroleum Gas Market Regulatory Landscape
| Country / Region | Regulatory Body | Key Regulations | Focus Areas | Notable Notes |
| European Union | European Commission, European Chemicals Agency | Seveso III Directive, REACH Regulation, Energy Taxation Directive | Storage safety, chemical safety, taxation | The EU regulates LPG handling, storage, transport, and use through stringent safety and environmental requirements. LPG is subject to harmonized minimum energy-taxation rules, while member states may apply higher rates. |
| Germany | Federal Ministry for the Environment, Federal Environment Agency | Federal Immission Control Act, Seveso III requirements | Emissions control, storage safety, industrial applications | Germany has established LPG infrastructure for residential, commercial, industrial, and automotive applications, supported by strict safety and environmental standards. |
| France | Ministry for Ecological Transition, Ministry of Economy, Finance and Industrial and Digital Sovereignty | Environmental Code, Seveso regulations | Industrial safety, fuel quality, emissions | France supports LPG use in transport and heating while maintaining stringent requirements for storage facilities and hazardous installations. |
| Italy | Ministry of Environment and Energy Security, Ministry of Infrastructure and Transport | Seveso III regulations, ADR requirements | LPG storage, transport, distribution | Italy has significant LPG consumption in residential, commercial, and automotive applications, with safety requirements covering distribution and transportation. |
| Netherlands | Ministry of Infrastructure and Water Management, Netherlands Enterprise Agency | Environmental Management Act, Seveso regulations | Industrial safety, emissions, energy transition | The Netherlands emphasizes safe LPG storage and handling and integrates LPG within broader energy and transport policies. |
Market Dynamics
Drivers
Transitional Bridge Fuel
The key growth drivers which supports the growth of the market are the transition towards a clean transitional bridge fuel, which helps in replacing the carbon-heavy coal and heating oil, aligning with the carbon neutrality targets and overcoming urban pollution, supporting growth. The other major drivers are the increased adoption within automotive sectors due to increased automotive expansion, and rural and off-grid access to energy sources for both residential and industrial heating supports the growth of the market.
Challenges
Price Instability and Market Volatility
The key challenges that hinder growth are price instability and market volatility, as buyers face high price instability because crude oil and feedstock prices are changing very rapidly, which results in rising geopolitical risks. The other major growth challenges are high infrastructure and maintenance costs, geopolitical and supply chain shifts, regulatory pressures, and the clean energy transition are major growth restrictions in the market.
Opportunities
Adoption of Bio-LPG and Renewable Feedstocks
The key growth opportunities which creates exceptional growth are the adoption of bio-LPG and renewable feedstocks like biogas and waste oils, which help in lowering the lifecycle carbon emissions, supporting growth. The other major growth opportunities are expansion of Autogas in transportation, off-grid and rural heating demands, and chemical and industrial applications, which maintain operational efficiency while complying with evolving environmental frameworks, supporting growth and expansion of the market.
Segmental Insights
Source Insights
The refinery segment dominated the market with a 64% share in 2025 and is expected to grow at a CAGR of 3.42% over the forecast period, driven by the growing shift and infrastructure development in the region, development of import facilities, infrastructure expansion, and refinery ownership, which fuels the growth. Increased extraction of gas help improving cost efficiency of regional manufacturing within European regions, supporting growth. Refineries help in separating the crude oil through distillation to yield LPG, diesel, and gasoline.
- For instance, ORLEN Paliwa expanded its domestic LPG storage and terminal infrastructure across Poland, shifting its supply entirely away from Russia to rely on its own refineries in Poland and Lithuania alongside diversified Western European imports.(Source:www.euro-petrole.com)
The non-associated gas segment held a 15% market share in 2025 and is expected to have the fastest growth, with a CAGR of 4.76% in the forecast period is a foundation source for extraction of LPG extraction, which is extracted from natural gas fields. They are extracted directly from non-associated natural gas reservoirs rather than refinery streams or crude-linked associated gas. Non-associated gas refers to natural gas found in reservoirs that do not contain significant amounts of crude oil. LPG extracted from these dedicated dry gas or wet gas wells forms a crucial baseline for the growth of the market.
Europe Liquefied Petroleum Gas Market Share, By Source, 2025(%)
| By Source | Market Share (%) |
| Refinery | 64% |
| Associated Gas | 21% |
| Non-associated Gas | 15% |
Application Insights
The residential segment dominated the market with a 27% share in 2025 and is expected to grow at a CAGR of 3.12% over the forecast period, driven by growing consumption in the region, as there is heavy reliance on rural residential heating, cooking, and hot water production, supporting growth. Particularly in Germany and France, rural heating is a major and primary stabilizer for residential LPG demand, which contributes to the growth of the market.
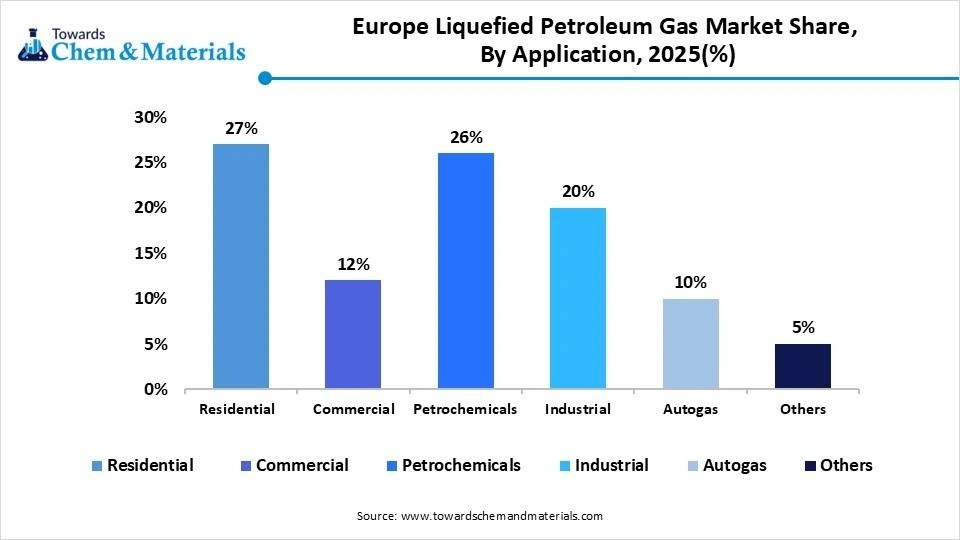
The petrochemical segment held a 26% market share in 2025 and is expected to have the fastest growth with a CAGR of 4.82% in the forecast period, driven by demand in the chemical application sector for the production of local polymers and solvent manufacturing, which increases the growth of the market. Refineries increasingly maximize profitability by converting lower-value gas streams like LPG and naphtha into high-value chemical building blocks such as ethylene and propylene, further contributing to the growth.
Europe Liquefied Petroleum Gas Market Share, By Application, 2025(%)
| By Application | Market Share (%) |
| Residential | 27% |
| Commercial | 12% |
| Petrochemicals | 26% |
| Industrial | 20% |
| Autogas | 10% |
| Others | 5% |
Product Insights
The propane segment dominated the market with a 48% share in 2025 and is expected to grow at a CAGR of 4.05% over the forecast period, the growing use of LPG for residential and commercial purposes, which increases usage. The rising shale gas production and natural gas processing help in abundant supply and provide a steady and low-cost supply of extracted propane, supporting growth. The increased priorities for local propane streams for household cooking fuel supplies further propel the growth and expansion.
The propane-butane mix segment held a 20% market share in 2025 and is expected to have the fastest growth with a CAGR of 4.38% in the forecast period, driven by key growth drivers and applications like high operational flexibility and cost-effectiveness, which support growth. Climate adaptability, storage benefits, infrastructure expansion, and clean fuel policies are the major advantages and accelerate consumer adoption, supporting growth. The major application of mixed products in residential, commercial, and transportation contributes greatly to the growth of the market.
Europe Liquefied Petroleum Gas Market Share, By Product, 2025(%)
| By Product | Market Share (%) |
| Propane | 48% |
| Butane | 32% |
| Propane-Butane Mix | 20% |
Regional Analysis
How did France dominate the Europe Liquefied Petroleum Gas Market in 2025?
France liquefied petroleum gas market size was estimated at USD 5.31 billion in 2025 and is projected to reach USD 7.77 billion by 2035, growing at a CAGR of $7.77 from 2026 to 2035. France dominated the European liquefied petroleum gas market with a share of 17.80% in 2025 and is expected to grow at a CAGR of 2.90% over the forecast period, driven by growing consumption in the country. Government backing and incentives for the purchase of cleaner and hybrid vehicle options strongly support automotive LPG adoption and growth. The growing use in the construction and residential sector acts as a main segment for the growing consumption, especially in rural areas, significantly contributing to the growth of the market. The presence of major industry players in the country, with the presence of key distributors like Antargaz, Rubis SCA, Primagaz, and DCC plc, plays an important role in the growth of the market, supporting expansion.
Italy Liquefied Petroleum Gas Market: Infrastructure Development
Italy liquefied petroleum gas market size was estimated at USD 4.45 billion in 2025 and is projected to reach USD 6.88 billion by 2035, growing at a CAGR of 4.45% from 2026 to 2035. Italy held a market share of 14.90% in 2025. The Italy liquefied petroleum gas market is experiencing growth driven by growing consumption, which is roughly 110.76 thousand barrels per day, which is backed by the presence of local depots, a sales network between regions, and authorized cylinder dealers in the region, which propels growth. presence of key players like Liquigas, which is a major distributor of LPG and LNG have large customer base, which is domestic and industrial, of more than 330,000, which holds about 20percent of the domestic market, which is a major growth factor in the market.
Germany Liquefied Petroleum Gas Market: Energy Diversification
Germany liquefied petroleum gas market size was estimated at USD 3.82 billion in 2025 and is projected to reach USD 5.70 billion by 2035, growing at a CAGR of 4.08% from 2026 to 2035. Germany held a market share of 12.80% in 2025, driven by heavy expansion of infrastructure and a steady supply chain for heating and fuel demand, fueling market growth in the country. Germanys energy diversification, as there is an ongoing shift towards broader and alternative portable gas options for both industrial and residential use, drives the growth. The growing chemical sector demand and application in chemical and petrochemicals as a vital industrial feedstock further propels growth.
United Kingdom Liquefied Petroleum Gas Market: Growing investment
Liquefied petroleum gas in the UK is a flammable mix of propane and butane used by hundreds of thousands of off-grid homes and businesses for heating, cooking, and fuel. The key growth driver is the Strong demand across off-grid residential, commercial, agricultural, and industrial sectors that cannot easily use standard electric heat pumps in the country, which propels the growth. The growing investment and key collaboration between the companies to scale net-zero alternatives further build a great expansion potential for the market.
Recent Developments
- In May 2026, the Zero Emissions Ship Technology Association launched the Global Liquid Hydrogen Alliance, an international platform focused on advancing pure green hydrogen and liquid hydrogen as a scalable and commercially viable zero-emission fuel for maritime shipping.(Source: www.marinelink.com)
- In July 2026, ADX Energy Limited, an oil and gas producer and explorer focused on Europe, revealed a multi-well plan to quickly boost production across its assets. The company, which manages mature production sites in Austria and nearby exploration projects, introduced this initiative during its update on the shallow gas work program on 20 July 2026. This move underscores ADXs strategic priority to utilize its existing infrastructure and data to speed up development in key European energy markets.(Source: kalkine.com.au)
- In January 2026, Glenfarne Group, majority owner and developer of the Alaska LNG Project, announced a series of major advances that move Phase One of the Alaska LNG Project from development into early execution focused on rapidly delivering reliable, affordable natural gas to Alaskans.(Source: glenfarnegroup.com)
Competitive Analysis
The key player collaborations on green technology development and supply chain transition work on the development of LPG and renewable bio-LPG. Major companies leading these efforts include SHV Energy, UGI International, TotalEnergies SE, and BP PLC.
- SHV Energy is collaborating with GTI Energy and Drochaid Research Services on bioethanol-to-bioLPG plant designs, alongside a strategic partnership with Lanzatech to capture carbon for renewable propane production.(Source: www.shvenergy.com)
- SEFE and Angola LNG Securing Energy for Europe (SEFE) expanded its partnership with Angola LNG to secure half a million tonnes of LNG (eight cargoes) throughout 2026 to diversify supply portfolios.(Source: www.sefe.eu)
- Wison New Energies signed a collaboration agreement to integrate Shells Dual Mixed Refrigerant liquefaction technology into floating LNG solutions, expanding advanced infrastructure deployment.(Source: www.euro-petrole.com)
- TotalEnergies and EPH formed a joint venture focus handling up to 2 million tonnes per annum of LNG, though criticized for potentially locking Europe into long-term fossil dependencies.(Source: beyondfossilfuels.org)
Top players in the European Liquefied Petroleum Gas Market & Their Offerings:
| Company | Company Type/Position | Major Headquarters | Geographic Presence | Liquefied Petroleum Gas Offerings | Key Offering/Strength |
| SHV Energy | Major LPG distribution and energy solutions provider | Hoofddorp, Netherlands | Europe, Asia Pacific, North America, Latin America | LPG, propane, butane, bioLPG, cylinders, bulk LPG, and off-grid energy solutions | One of the worlds leading LPG distributors, with strong local distribution networks across Europe. |
| Shell plc | Integrated energy and LPG supplier | London, United Kingdom | Europe, North America, Asia Pacific, Middle East, Africa | LPG for residential, commercial, industrial, and autogas applications | Strong LPG marketing, supply, and logistics capabilities across international markets. |
| TotalEnergies SE | Integrated energy and LPG producer | Courbevoie, France | Europe, Africa, Middle East, Asia Pacific, North America | LPG, propane, butane, autogas, and renewable bioLPG solutions | Integrated refining and distribution network with growing emphasis on lower-carbon LPG alternatives. |
| BP plc | Integrated energy and LPG supplier | London, United Kingdom | Europe, North America, Asia Pacific, Middle East, Africa | LPG, propane, butane, and energy supply solutions | Strong global energy trading and distribution capabilities supporting LPG supply chains |
| Repsol S.A. | Integrated energy and petrochemicals company | Madrid, Spain | Europe, North America, Latin America, Asia | LPG, bottled propane and butane, autogas, and industrial LPG solutions | Strong downstream presence in Southern Europe with established LPG distribution and retail infrastructure |
Other Top Players Are
- Exxon Mobil Corporation
- Chevron Corporation
- ConocoPhillips
- Gazprom PJSC
- Equinor ASA
- Eni S.p.A.
- Novatek PAO
- UGI Corporation (AmeriGas)
- Vitol
- QatarEnergy
- Abu Dhabi National Oil Company (ADNOC)
- Linde plc
- Primagas (SHV subsidiary)
- Rheingas
- Petrona
Segments Covered
By Source
- Refinery
- Oil Refining
- Crude Oil Distillation
- Catalytic Cracking
- Hydrocracking
- Refinery Off-Gases
- Oil Refining
- Associated Gas
- Crude Oil Production
- Oilfield Separation
- Natural Gas Processing
- Non-associated Gas
- Natural Gas Processing
- Gas Separation Plants
- Gas Fractionation
By Application
- Residential
- Cooking
- Space Heating
- Water Heating
- Commercial
- Hospitality
- Restaurants & Catering
- Retail & Services
- Petrochemicals
- Ethylene Production
- Propylene Production
- Chemical Feedstock
- Industrial
- Manufacturing
- Metal Processing
- Food Processing
- Glass & Ceramics
- Autogas
- Passenger Vehicles
- Commercial Vehicles
- Fleet Vehicles
- Others
- Agriculture
- Power Generation
- Construction
- Leisure & Recreation
By Product
- Propane
- Commercial Propane
- Industrial Propane
- Residential Propane
- Autogas Propane
- Butane
- Commercial Butane
- Industrial Butane
- Household Butane
- Propane-Butane Mix
- Residential LPG Mix
- Commercial LPG Mix
- Automotive LPG Mix
A Seven-Phase Framework
Our methodology is designed to be universally applicable across commodity chemicals, specialty chemicals, petrochemicals, construction chemicals, coatings, electronic chemicals, industrial gases, agrochemicals, water treatment chemicals, and performance materials. Each phase builds upon the last, creating a layered validation structure that minimizes estimation error and maximizes analytical confidence.
The framework ensures comprehensive market coverage, robust cross-validation, and reliable long-term forecasting — producing market estimates that withstand scrutiny from investors, regulators, and corporate strategy teams.

Seven-Phase Framework — Analytical Effort Distribution
Relative analytical effort allocated across each phase of the Chemicals & Materials research framework

Phase 1 - Secondary Research: Establishing the Foundation
Secondary research collects and evaluates publicly available information from authoritative sources, establishing the foundational understanding of market structure, value chain dynamics, competitive landscape, and end-use demand patterns. Every source is evaluated for credibility, recency, geographic relevance, and methodological soundness before inclusion.
Industry Associations
Sources include ACC, CEFIC, ICCA, JCIA, CPCIF, and SOCMA providing production volumes, consumption trends, capacity developments, and sustainability initiatives.
Company Disclosures
Annual reports, investor presentations, earnings transcripts, and regulatory filings reveal product portfolios, manufacturing footprints, capacity expansions, and revenue segmentation.
Government Databases
National statistical offices, customs authorities, environmental agencies, and industrial production databases provide verified statistics on output, trade flows, and regulatory compliance.
Trade Databases
UN Comtrade, ITC, Eurostat, and national customs authorities enable assessment of global product movement, import dependency, and export competitiveness across regions.
Our Secondary Research Sources
- Ministry of Chemicals and Fertilizers
- European Chemicals Agency
- United States Department of Energy
- Ministry of Industry and Information Technology
- Ministry of Economy Trade and Industry
- Ministry of Trade Industry and Energy
- National Institute of Standards and Technology
- Council of Scientific and Industrial Research
- Fraunhofer Society
- National Institute for Materials Science
Phase 2 — Supply-Side Assessment: Mapping Production Capabilities
Production Capacity Analysis
All major manufacturers are assessed for existing installed capacity, planned additions, expansions, new plant announcements, and technology adoption — mapped at global, regional, and country levels.
Capacity Utilization Adjustment
Installed capacity is adjusted using utilization rates based on demand conditions, feedstock availability, plant operating rates, maintenance schedules, and regulatory restrictions.
Manufacturer Revenue Analysis
Product-specific revenues, segment-level performance, regional distribution, average selling prices, and margin trends are evaluated to establish market value estimates.
Supply-Side Assessment — Capacity vs. Effective Production by Region
Illustrative comparison of installed capacity vs. effective production volume (after utilization rate adjustment) across major regions

Phase 3 — Demand-Side Assessment: Quantifying Chemical Consumption
Demand-side analysis quantifies chemical consumption across industries, applications, and geographies — identifying where and how chemicals are consumed throughout the value chain with precision.
End-Use Industry Analysis
Chemical demand is evaluated across automotive, construction, packaging, electronics, agriculture, healthcare, consumer goods, industrial manufacturing, energy and utilities, and water treatment. Industry output, production trends, and consumption intensity are analyzed to determine demand patterns.
Consumption Modeling
Demand is estimated using measurable indicators: kilograms per vehicle, kilograms per square meter of construction, dosage per cubic meter of water treated, kilograms per hectare of agricultural land, and kilograms per ton of manufactured products. Consumption factors are validated through industry publications and primary interviews.
Application Analysis
The market is segmented by application area to understand product performance requirements, formulation trends, technology adoption, customer preferences, and regulatory requirements improving demand accuracy and segmentation granularity.
Demand-Side Assessment — End-Use Industry Demand Distribution
Illustrative distribution of chemical & materials demand across key end-use industries

Phase 4 - Trade Flow Analysis: Balancing Regional Supply and Demand
Trade flow analysis reconciles regional supply and demand estimates through import and export data, identifying net supply positions, regional dependencies, and market imbalances. It serves as an independent validation layer that tests the consistency of supply-side and demand-side estimates.
Import Analysis
Import data is evaluated to determine volumes, source countries, product dependency, regional supply gaps, and pricing trends — identifying markets that rely heavily on external supply and where domestic production is insufficient to meet demand.
Export Analysis
Export assessments reveal production surplus, export competitiveness, regional manufacturing strength, and global market participation. Export patterns also help validate domestic production estimates and identify net exporting regions.
Apparent Consumption Model
Regional consumption is assessed using the standard apparent consumption formula:
Results identify net importing regions, net exporting regions, regional deficits, and surpluses — serving as an independent validation of supply and demand estimates.
Trade Flow Analysis — Net Supply Position by Region
Illustrative apparent consumption vs. domestic production across major regions — positive gap indicates net import dependency

Phase 5 — Primary Research: The Critical Validation Layer
Primary research tests and refines findings from secondary research through direct engagement with industry participants across the supply chain, demand side, and expert community. It captures intelligence that no database or published report can provide — the real-world experience of manufacturers, buyers, and specialists operating in the market.

Supply-Side Interviews
Conversations with chemical manufacturers, raw material suppliers, contract manufacturers, technology providers, and plant operators cover production trends, capacity utilization, pricing developments, technology shifts, and competitive dynamics.

Demand-Side Interviews
Engagement with OEMs, industrial consumers, procurement managers, distributors, formulators, and end-use manufacturers focuses on consumption trends, purchasing behavior, product substitution, demand outlook, and emerging applications.

Industry Expert Consultations
Additional interviews with industry consultants, independent experts, regulatory specialists, technical professionals, and research institutions provide deeper market context and validate key analytical assumptions.
Focus Areas of Primary Research:
Market Size & Forecast Validation
Revenue estimates, volume consumption, growth rates, forecast assumptions, regional demand.Supply Chain & Value Chain Assessment
Raw material sourcing, supply chain challenges, distribution networks, procurement practices.Production & Capacity Analysis
Manufacturing capacity, utilization rates, expansion projects, plant investments.Pricing & Cost Structure Analysis
Product pricing trends, feedstock costs, energy costs, margin pressures, pricing outlook.Competitive Landscape Assessment
Volume and value estimates confirmed to be fully consistent with one another before publicationInterview Volume by Market Scope
| Study Scope | Number of Interviews |
|---|---|
| Niche Market | 20 – 30 |
| Mid-Sized Market | 30 – 50 |
| Global Market | 50 – 80 |
| Highly Fragmented Market | 80 – 120 |
Interview Details:
Category : Manufacturers, Suppliers, Distributors, End Users, Experts/Associations
Average Duration : 30–60 Minutes
Interview Mode : Video calls, telephonic interviews, expert consultations
Interview Format : Structured / Semi-Structured questionnaire
Focus Areas of Primary Research:
Market Size & Forecast Validation :
Revenue estimates, volume consumption, growth rates, forecast assumptions, regional demand.
Supply Chain & Value Chain Assessment :
Raw material sourcing, supply chain challenges, distribution networks, procurement practices.
Production & Capacity Analysis :
Manufacturing capacity, utilization rates, expansion projects, plant investments.
Pricing & Cost Structure Analysis :
Product pricing trends, feedstock costs, energy costs, margin pressures, pricing outlook.
Competitive Landscape Assessment :
Market share, competitor positioning, strategic initiatives, partnerships, acquisitions.
Primary Research — Stakeholder Coverage by Category
Distribution of interview respondents across stakeholder categories (% share from PPT data)

Primary Research — Respondent Designation Profile
Seniority breakdown of interview respondents (% share from PPT data)

Primary Research — Geographic Coverage of Interviews
Regional distribution of primary research engagement (% share from PPT data)

Phase 6 — Data Triangulation and Market Validation
No single methodology is relied upon in isolation. Multiple independent estimation approaches are combined and reconciled to ensure consistency, accuracy, and analytical defensibility. Any material deviations between approaches are investigated and adjusted through additional validation cycles.
The final market size is derived through weighted triangulation of all validated methodologies. Any material deviations between approaches are investigated and adjusted through additional validation cycles. The outcome represents the most realistic assessment of the market based on available evidence and expert confirmation ensuring that volume and value estimates are fully consistent with one another.
Triangulation Framework — Input Contribution Weight
Relative weight each sizing input contributes to the final reconciled market estimate

Phase 7 — Forecast Modeling: Projecting Future Market Evolution
Forecasting evaluates the future trajectory of the market using a combination of quantitative indicators and qualitative assessments across economic, industry, and regulatory dimensions. Rather than simple extrapolation, each driver is independently modeled and integrated into a composite forecast.
Macroeconomic Indicators
GDP growth, industrial production, manufacturing output, construction activity, consumer spending, and capital investment form the quantitative foundation of long-term demand projections. These are applied at country, regional, and global levels.
Industry Growth Drivers
Urbanization, infrastructure development, industrialization, technological innovation, sustainability initiatives, and evolving product performance requirements are assessed at regional and industry levels — capturing both structural and cyclical demand drivers.
Capacity Expansion Analysis
Announced plant expansions, new manufacturing facilities, technology upgrades, and strategic investments are evaluated to determine future supply-demand dynamics and potential market tightness or oversupply situations.
Regulatory & Sustainability
Environmental regulations, chemical safety standards, emission reduction targets, circular economy initiatives, and sustainability requirements are incorporated as they often influence product adoption rates and market growth trajectories.
Scenario Forecast Range — Indexed Market Growth (Year 1–10)
Illustrative indexed growth trajectories across Base, Optimistic, and Pessimistic scenarios over a 10-year forecast horizon

Forecast Drivers — Relative Impact Score by Category
Impact score (0–100) of each driver type on chemicals & materials market forecast




Comments
Share your thoughts, ask a question, or provide feedback about this report.