
What is the Asia Pacific Zero-Waste Chemical Manufacturing Market Size and Share?
The Asia Pacific zero-waste chemical manufacturing market size was valued at USD 19 billion in 2025 and is projected to grow from USD 21.14 billion in 2026 to USD 55.18 billion by 2035, exhibiting a CAGR of 11.25% during the forecast period. Rising hazardous-waste disposal costs, tightening environmental regulation, feedstock-security priorities, and export-market sustainability requirements are moving zero-waste chemistry from a compliance cost to a core margin strategy. The report analyzes market size, segmentation, pricing, demand-supply, value chain, technology, regulation, customers, and applications. It also profiles 25 leading companies, covering market share, benchmarking, strategic developments, M&A, and white-space opportunities.
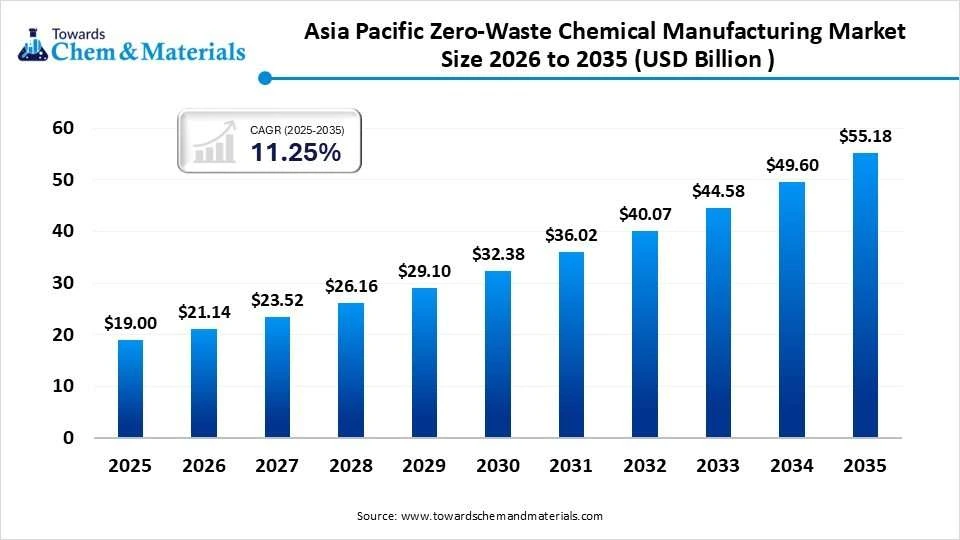
Overview – Zero-Waste Chemistry is Moving from a Compliance Cost to a Margin and Feedstock-Security Strategy
Asia Pacific produces more than half of the world’s chemical output by value. It also generates the largest absolute volume of chemical process waste, which makes it the center of gravity for zero-waste manufacturing. The market, defined as spend on process technologies, recovery and valorization systems, circular feedstock, and engineering services that eliminate or monetize waste in chemical plants, Historical growth over 2020-2025 was approximately 11.25% per year, so the market is maturing from its early adoption phase into scaled deployment.
China dominates with the largest share in the market, accounting for approximately 42% of regional share. India is the fastest-growing major market at around 11% CAGR. Solvent and acid recovery and zero-liquid-discharge (ZLD) water systems together represent nearly half of current revenue, while chemical recycling and circular feedstock are the fastest-growing technologies at approximately 11.5% CAGR over the forecast period. The market is moderately fragmented: the top ten participants hold an estimated 38-42% of revenue, and technology specialists, engineering contractors, and integrated chemical producers compete for the same projects.
The full report quantifies these dynamics by technology, chemical sub-sector, country, plant archetype, and investment type.
Key Takeaways
- China accounts for the largest share of approximately 42%, while India is the fastest-growing country at around 11% CAGR during the forecast period.
- The solvent and acid recovery segment is expected to dominate the market with around a 25% share in 2025.
- The chemical recycling and circular feedstock segment is the fastest-growing technology at approximately 14% CAGR over the forecast period.
- Hazardous-waste disposal costs have risen 30-60% over five years in several Asian jurisdictions, and on-site solvent recovery returns an estimated 60-90% of solvent value with payback periods of 2-5 years.
- Recovered solvents cost about 40-70% of virgin solvent, while certified recycled-content chemicals command premiums of roughly 10-30%.
- Regional chemical-waste generation is growing at around 4-5% annually, while compliant treatment and recovery capacity is expanding at 7-8%.
- Specialty, pharmaceutical and battery chemical producers are the highest-value customers, prioritizing purity, yield and certified circularity over price.
- Technology licensors and service operators capture the highest margin pools, driving a shift toward recurring-revenue and as-a-service models.
- Restrictions on waste imports have pushed Asia Pacific toward domestic circular supply, while Chinese and Japanese technology exports to emerging Asia Pacific are expanding.
- Japan and South Korea sustain the highest pricing premiums, while South and Southeast Asia are the most price-sensitive.
- India, Southeast Asia and technology-led services are the most attractive growth areas, while commodity-grade chemical recycling is the most challenging.
Segmentation Analysis – Solvent and Acid Recovery Lead, but Chemical Recycling and Circular Feedstock Captures the Fastest Growth
- By technology, the solvent and acid recovery segment dominated the market with the largest share of 25% in 2025 and is expected to grow at a CAGR of 7.5% during the forecast period.
- By technology, the chemical recycling and circular feedstock segment held a 15% market share in 2025 and is expected to grow at the fastest CAGR of 14% over the forecast period.
- By chemical sub-sector, the petrochemicals segment dominated the market with the largest share of 32% in 2025 and is expected to grow at a CAGR of 8% during the forecast period.
- By chemical sub-sector, the battery and electronic chemicals segment held a 10% market share in 2025 and is expected to grow at the fastest CAGR of 12% over the forecast period.
- By project type, the greenfield segment dominated the market with the largest share of 54% in 2025 and is expected to grow at a CAGR of 7% during the forecast period.
- By project type, the retrofit/brownfield segment held a 46% market share in 2025 and is expected to grow at the fastest CAGR of 11.5% over the forecast period.
The full report extends segmentation to technology, chemical sub-sector, ownership model, and project type.
Key Coverage
- Technology, sub-sector, and ownership-model segmentation
- Share, revenue, and CAGR by segment
- Highest-value and emerging segments
- Declining legacy segments
Market Dynamics – Disposal Cost Inflation, Feedstock Security and Export-Market Pressure Are Reshaping Capital Allocation
- Drivers: Hazardous-waste disposal costs have risen 30-60% over the past five years in several Asian jurisdictions, and landfill capacity near industrial clusters is constrained. Producers recover an estimated 60-90% of solvent value through on-site recovery, with payback periods commonly in the 2-5 year range. Export customers in Europe and North America increasingly require lifecycle and product-carbon disclosure from Asian suppliers.
- Restraints: Capex for ZLD can add 8-15% to project cost and recycled-feedstock yields remain variable. Small and mid-sized producers, which make up a large share of Asian chemical output, often lack the capital and technical staff to adopt these systems.
- Opportunities: Industrial-park circular-economy programs, waste-to-chemical conversion in battery and plastics value chains, and as-a-service models that remove upfront capital are the main white spaces.
- Challenges: Enforcement inconsistency and low virgin-resin prices can delay returns on circular investments.
Key Coverage
- Driver and restraint impact quantification
- Disposal-cost and recovery-economics benchmarks
- Regulatory and customer-requirement timelines
How are Recovery Economics, Recycled-Content Premiums and Service Models Reshaping Pricing and Value Capture?
Recovered solvents typically cost 40–70% of virgin solvent prices, depending on purity and production scale, creating a potential cost advantage of 30–60% for suitable recovery applications. Meanwhile, recycled-content and certified circular chemicals command premiums of approximately 10–30% over virgin equivalents, with the highest premiums generally associated with specialty applications and export-oriented supply chains. Zero-liquid-discharge (ZLD) system economics vary according to effluent complexity, while energy consumption and brine management remain key operating-cost drivers. Service-based and build-own-operate (BOO) contracts also typically deliver margins several percentage points higher than equipment-only sales.
Our analysis indicates that pricing is increasingly determined by recovery efficiency, product quality, regulatory requirements, and the ability to deliver measurable environmental value not simply by the cost of treatment or recycled production. The contrast between lower-cost recovered solvents and premium-priced circular chemicals highlights two distinct value drivers: cost savings for industrial users and sustainability-linked pricing power for certified products. In our assessment, service-based models offer an additional route to stronger margins by generating recurring revenue and extending customer relationships beyond initial equipment sales.
In our view, regional differences will remain critical to pricing and investment decisions. Japan and South Korea sustain the highest premiums, supported by stronger willingness to pay for compliant and sustainable solutions, while South and Southeast Asian markets are more price-sensitive. Energy costs, waste-disposal fees and enforcement intensity further influence project economics. Suppliers serving price-sensitive markets may need to prioritize operating efficiency and scalable recovery technologies, whereas providers targeting premium markets can differentiate through higher-purity outputs, certification and integrated service offerings.
The full report further examines regional pricing benchmarks, recovered-solvent economics, recycled-content premiums, ZLD capital and operating costs, and profitability differences between equipment sales and recurring service contracts. Where data availability permits, these insights can also be provided through a structured pricing and recovery-economics dataset, tracking product or technology, region, virgin-product reference price, recovered-product cost, recycled-content premium, capital cost per ton of capacity, operating cost, service model, and contract economics. Users can filter and benchmark these metrics across regions, technologies and business models to identify cost advantages, premium opportunities and the most attractive routes to value capture.
Key Coverage
- Cost per ton treated and recovered by technology
- Capex benchmarks by system type and scale
- Equipment vs. service-model margins
- Price pass-through and elasticity
- Pricing outlook to 2035
Where are Chemical-Waste Treatment Capacity Gaps Creating the Biggest Market Opportunities?
Chemical-waste generation is increasing by around 4–5% annually, while compliant treatment and recovery capacity is growing by 7–8% per year. However, capacity remains unevenly distributed. South and Southeast Asia, along with inland Chinese industrial clusters, continue to face supply gaps, while coastal China, Japan and South Korea are generally closer to a balance between waste generation and treatment capacity.
The key issue is not just how quickly capacity is growing, but whether the facilities are located where they are needed and can handle the types of waste being generated. Chemical recycling technologies such as pyrolysis and depolymerization are gaining traction, but much of the announced capacity has yet to become operational. Existing early-stage plants typically run at 50–70% utilization, highlighting the challenges of scaling operations and achieving consistent performance.
We assess that the strongest growth opportunities lie in underserved industrial regions where waste volumes are rising faster than access to compliant treatment facilities. However, announced projects should not be treated as immediately available supply, as actual capacity depends on project completion, commissioning and operating performance. The report compares waste generation, operating capacity, utilization rates and planned projects by country and technology to identify supply shortages, emerging investment opportunities and regions with the greatest potential for capacity expansion.
Key Coverage
- Waste generation vs. compliant capacity by country
- Capacity additions and project pipeline
- Utilization of recovery and recycling assets
- Surplus and deficit corridors
Where is Value Captured Across the Chemical-Waste Recovery Chain, and Which Supply Bottlenecks Limit Profitability?
The chemical-waste recovery value chain spans waste collection and feedstock aggregation, technology licensing, equipment supply and engineering, plant operations, recovered-product processing, and sales to chemical customers. Technology licensors and service operators generally capture stronger margins than equipment fabricators, as licensing fees and recurring service contracts offer opportunities for higher-value revenue.
Meanwhile, limited availability of qualified suppliers for membranes, catalysts, specialty alloys, and high-efficiency evaporators can affect project costs and delivery timelines. Transport and waste aggregation also represent significant cost factors, particularly where waste is generated across dispersed industrial sites.
Our analysis indicates that profitability depends not only on treatment technology, but also on control over specialized expertise, critical equipment, and long-term customer relationships. Licensing and service-based models can provide more recurring revenue than one-time equipment sales, while dependence on a small pool of qualified suppliers can expose project developers to cost increases and delays. In addition, inefficient collection networks can reduce recovery economics before the waste even reaches a treatment facility.
In our view, the strongest competitive advantage will come from combining efficient recovery technology with reliable feedstock access and recurring service revenue. Companies that improve waste collection, secure critical equipment and develop long-term operating relationships may be better positioned to manage costs and protect margins. The full report examines cost contributions, margin distribution, and supply-chain bottlenecks across each stage, helping identify where value is concentrated, which dependencies create operational risks, and where opportunities exist for integration or differentiation.
Key Coverage
- Value-chain map and margin pools
- Supplier concentration for membranes, catalysts and critical equipment
- Waste aggregation and logistics economics
- Bottleneck assessment
Trade & Import–Export Analysis: Restrictions on Waste Imports Have Pushed Asia Pacific Toward Domestic Circular Supply
Several major Asian economies have restricted imports of plastic and chemical waste, which accelerated domestic recycling and recovery investment. Specialized equipment, membranes and catalysts remain import-dependent in several ASEAN and South Asian markets. Meanwhile, Chinese and Japanese technology exports to emerging Asia are expanding. The full report analyzes technology and equipment trade corridors, tariff effects, and localization opportunities.
Technology & Innovation – Advanced Recycling, Electrochemical Processes and Digital Process Optimization Expand the Addressable Pool
Mature technologies include distillation, evaporation, and conventional ZLD. Emerging technologies include pyrolysis and gasification for mixed plastics, solvolysis and depolymerization, membrane distillation, electrochemical synthesis, and AI-based yield and waste prediction. Patent filings in chemical recycling and green process chemistry from Asian applicants have grown at double-digit rates over the last five years, and Asia accounts for a majority of global filings. The full report tracks patents, commercial plants, technology readiness and cost curves for each route.
Regulatory & Sustainability Analysis – Extended Producer Responsibility, Carbon Pricing and Hazardous-Waste Enforcement Are Tightening
Key forces include national hazardous-waste regimes, ZLD mandates in water-stressed regions, industrial-park circularity targets, plastic-recycling mandates, emerging carbon markets, and export-market carbon and disclosure requirements. Together, they are estimated to influence a majority of projected incremental spend. The full report covers regulation by country, compliance timelines, and cost impact.
Customer & Application Analysis – Specialty, Pharma and Battery Chemical Producers Pay for Purity and Certified Circularity
Purchase criteria rank recovery yield, purity, and reliability above price in specialty and pharma applications, where qualification cycles run 6-18 months, and switching costs are high. Commodity producers prioritize payback and energy intensity. Customer concentration is moderate, with large integrated producers accounting for a major share of project spend. The report quantifies application shares, CAGR, and unmet needs, notably low-cost solutions for mid-sized producers.
How is Competition Evolving Between Integrated Chemical Producers, Technology Specialists and Resource-Recovery Service Providers?
The chemical-waste treatment and recovery market brings together three main competitor groups: integrated chemical producers that develop waste-reduction systems for their own operations and commercialize selected technologies; technology and engineering specialists that license processes and build treatment facilities; and water and resource-recovery service providers that generate recurring revenue through operating contracts. The top five players collectively account for an estimated 22–25% of the market, while the top ten hold approximately 38–42%, indicating a relatively fragmented competitive structure. Regional players in China, Japan and South Korea also maintain strong positions through local expertise and participation in government-linked projects.
Our analysis indicates that competitive advantage depends increasingly on a company's position within the value chain, rather than scale alone. Integrated producers benefit from internal demand and operating experience, technology specialists can monetize proprietary processes across multiple projects, and service operators gain from long-term customer relationships. The relatively limited share held by the top ten players also suggests that no small group of companies dominates the entire market, leaving room for specialists with differentiated technologies or strong regional networks.
In our view, the most attractive competitive positions are likely to be those that combine technical expertise with reliable project execution and recurring service revenue. Integrated players may benefit from extending proven in-house solutions to external customers, while engineering specialists and service providers can strengthen their positions through technology partnerships, operational capabilities and selective expansion into underserved regions. The full report compares competitor positioning, business models, regional presence, technology capabilities and value-chain exposure to identify potential market leaders, competitive gaps and opportunities for differentiation or consolidation.
Tentative Leading Company Universe
| Sr. no | Company | HQs | Market Position | Core Strength | Major Segments |
| 1 | BASF | Germany | Global scale leader | Verbund integration, process technology | Petrochemicals, specialty |
| 2 | Dow | U.S. | Global leader | Circular plastics, integration | Petrochemicals, packaging |
| 3 | SABIC | Saudi Arabia | Global/regional leader | Feedstock integration, circular polymers | Petrochemicals |
| 4 | Sinopec | China | Regional scale leader | Capacity, domestic projects | Petrochemicals, refining |
| 5 | Wanhua Chemical | China | Regional growth leader | Efficiency, expansion | Isocyanates, specialty |
| 6 | Mitsubishi Chemical Group | Japan | Regional technology leader | Recycling, materials | Specialty, advanced materials |
| 7 | Sumitomo Chemical | Japan | Regional specialist | Process chemistry | Agrochemicals, fine chemicals |
| 8 | Mitsui Chemicals | Japan | Regional specialist | Circular feedstock | Materials, mobility |
| 9 | Asahi Kasei | Japan | Technology leader | Membranes, process technology | Electronics, materials |
| 10 | LG Chem | South Korea | Regional leader | Battery materials, recycling | Battery, petrochemicals |
| 11 | Lotte Chemical | South Korea | Regional leader | Recycled polymers | Petrochemicals |
| 12 | SK Geo Centric | South Korea | Recycling challenger | Advanced recycling cluster | Plastics recycling |
| 13 | Reliance Industries | India | Regional scale leader | Integration, scale | Petrochemicals |
| 14 | Tata Chemicals | India | Regional specialist | Inorganics, sustainability | Soda ash, specialty |
| 15 | PTT Global Chemical | Thailand | Regional leader | Circular initiatives | Petrochemicals |
| 16 | Indorama Ventures | Thailand | Recycling leader | PET recycling scale | Packaging, polyester |
| 17 | Toray Industries | Japan | Technology specialist | Membranes | Water, materials |
| 18 | Veolia | France | Service leader | Resource recovery, operations | Industrial water, waste |
| 19 | Xylem (Evoqua) | U.S. | Technology and service leader | Water treatment, ZLD | Industrial water |
| 20 | Aquatech | U.S. | ZLD specialist | Zero-discharge systems | Power, chemicals |
| 21 | Honeywell UOP | U.S. | Technology licensor | Recycling, process technology | Refining, plastics |
| 22 | Axens | France | Technology licensor | Process licensing | Petrochemicals |
| 23 | Evonik | Germany | Specialty leader | Process catalysis | Specialty |
| 24 | Covestro | Germany | Specialty leader | Circular polymers | Polymers |
| 25 | Clariant | Switzerland | Catalyst and specialty leader | Catalysts, bio-based | Specialty |
Market Share & Competitive Ranking – Scale Producers Lead Through Captive Deployment, While Specialists Lead Through Third-Party Revenue
Because much zero-waste spend is internal, the report separates third-party market revenue from captive deployment to avoid distorting rankings. Estimated shares: integrated producers lead on captive volume, while Veolia, Xylem and specialist ZLD providers lead on third-party service and equipment revenue. Chinese producers are gaining share fastest, aided by domestic project volume. Shares are analytical estimates, and the report discloses ranges rather than false precision.
Competitive Benchmarking – Integration, Technology Depth and Service Models Create Structural Advantage
Companies are compared based on their technology range, revenue from waste recovery, geographic presence, R&D investment, capacity, customer relationships and sustainability performance. They are grouped into four categories: Leader, Strong, Moderate, and Emerging. BASF, Dow and SABIC perform strongly in integration, while Asahi Kasei, Toray and Honeywell UOP stand out for their technology expertise and intellectual property. Veolia and Xylem are recognized for their wide service networks and service-based business models.
Product Portfolio Benchmarking
The analysis compares companies with broad chemical portfolios, such as BASF, Dow and Mitsubishi Chemical, with specialists focused on membranes, catalysts, zero-liquid-discharge (ZLD) systems and recycling technologies. It examines the strengths and gaps in their product offerings. One notable opportunity is the development of affordable, modular treatment systems designed for mid-sized chemical manufacturers that may not need large, complex facilities.
Technology & Innovation Benchmarking
Companies are compared based on their patents, pilot projects, commercial plants, technology partnerships, and readiness to bring new solutions to market. Japanese and South Korean companies show strong capabilities in advanced recycling and materials-related patents, while Chinese companies are seeing faster growth in patent filings. This comparison helps distinguish companies with established commercial technologies from those whose innovations are still being tested or developed.
Competitive Application Benchmarking
The analysis looks at which companies are best positioned to serve different chemical industries. Integrated producers have a strong presence in petrochemicals, Japanese and European specialists focus on fine and pharmaceutical chemicals, and South Korean companies have established positions in battery materials. A potential growth opportunity lies in developing practical and affordable waste-recovery solutions for mid-sized agrochemical and dye manufacturers, which may have fewer suitable options available.
Manufacturing & Capacity Benchmarking
The report compares manufacturing facilities, advanced-recycling capacity, plant utilization, announced projects, and regional expansion plans. It also distinguishes between capacity that is already operational and capacity that has only been announced. Since planned advanced-recycling capacity is significantly higher than actual operating output, announced projects should not be treated as available supply. This comparison helps assess companies' real production capabilities, expansion progress and ability to meet future demand.
Strategic Developments & M&A Landscape – Consolidation is Shifting Toward Water Technology, Recycling, and Regional Platforms
Recent activity includes large integrated-site investments in southern China, advanced-recycling clusters in South Korea, and Japanese joint ventures in recycling and materials. In M&A, Xylem’s acquisition of Evoqua (about USD 7.5 billion, 2023) and Veolia’s integration of its largest water-services rival (2022) illustrate consolidation in industrial water and resource recovery. Future themes include technology tuck-ins, regional platforms in India and ASEAN, and vertical integration into recycled feedstock. The full report tracks deals with values, rationale, and technology exposure.
Company Strategic Positioning
Companies are classified qualitatively as Market Leaders (BASF, Dow, SABIC), Growth Leaders (Wanhua, Reliance), Technology Leaders (Asahi Kasei, Honeywell UOP, Toray), Scale Leaders (Sinopec), Regional Leaders (LG Chem, Lotte, PTT Global), Application Specialists (Sumitomo, Evonik) and Emerging Challengers (SK Geo Centric, Indorama).
Opportunity & White-Space Analysis – Mid-Sized Producers, As-a-Service Models and Battery-Chemical Circularity Are the Largest Untapped Pools
The highest-value opportunities include modular recovery and ZLD for mid-sized producers (an estimated USD 6-8 billion pool by 2035), as-a-service offerings that shift capex to operating cost, battery-chemical recovery loops, and industrial-park-level shared infrastructure in India and ASEAN.
Industry Structure (Porter’s Five Forces)
- Supplier Power – Medium: Membranes and catalysts are supplied by a relatively limited number of qualified vendors, giving suppliers some control over prices and availability.
- Buyer Power – Medium-High: Large chemical producers have strong negotiating power and may develop in-house treatment and recovery systems to reduce costs and dependence on external providers.
- Threat of New Entrants – Medium: Entering the market requires specialized technology, industry experience, and a proven track record, making it difficult for new companies to compete immediately.
- Threat of Substitutes – Low-Medium: Strict environmental rules limit alternatives to compliant treatment and recovery. However, cheaper disposal options in regions with weaker enforcement can still affect demand.
- Competitive Rivalry – High: Integrated chemical producers, technology specialists and service operators compete for overlapping projects, increasing pressure on pricing, technology performance and service quality.
PESTLE Analysis
- Political: Government policies promoting circularity and differences in environmental enforcement across regions influence market growth.
- Economic: Rising waste-disposal costs and fluctuations in feedstock prices affect the financial benefits of recovery and recycling.
- Social: Growing concerns about pollution near industrial areas are putting pressure on companies to manage chemical waste more responsibly.
- Technological: Advances in chemical recycling, automation and digital process optimization are helping improve recovery efficiency and plant performance.
- Legal: Hazardous-waste regulations, Extended Producer Responsibility (EPR) requirements and carbon-related rules are shaping compliance costs and investment decisions.
- Environmental: Water scarcity and tighter emissions controls are increasing the need for efficient treatment, water reuse and waste-recovery solutions.
Market Attractiveness
Rated Highly Attractive: India, Southeast Asia and technology-led services. Attractive: China and South Korea. Moderate: Japan, given maturity. Challenging: commodity-grade chemical recycling dependent on low virgin-feedstock prices.
Future Outlook – How Will Compliance Spending Evolve into a Core Competitive Advantage by 2035?
Margins should migrate toward service and technology models, while advanced-recycling economics improve as scale builds. Likely winners are integrated producers with captive demand, technology licensors and service operators with recurring contracts. Potential challengers include Chinese technology providers expanding across Asia Pacific.
Key Strategic Questions
- How large is the Asia Pacific zero-waste chemical manufacturing market, and how fast will it grow through 2035?
- Which technologies offer the highest growth and margin?
- How do recovery economics compare with virgin production and disposal?
- What recycled-content premiums are sustainable by chemical family?
- Where do waste generation and compliant capacity diverge?
- How much announced advanced-recycling capacity will actually be commissioned?
- Which regulations most affect investment timing?
- How is competitive positioning shifting among integrated, specialist, and service players?
- What M&A themes will reshape the market?
- Where are the largest white-space opportunities for mid-sized producers?
- Which scenarios and trigger variables most change the 2035 outlook?
List of Segments
By Technology
- Solvent and Acid Recovery
- Zero-Liquid-Discharge (ZLD) Water Systems
- Valorization and Industrial Symbiosis
- Chemical Recycling and Circular Feedstock
- Process Intensification, Catalytic and Green-Chemistry Redesign
- Waste-Heat, Off-Gas and Residue Recovery
By Chemical Sub-Sector
- Petrochemicals
- Specialty and Fine Chemicals
- Agrochemicals
- Pharmaceutical Intermediates
- Chlor-Alkali and Commodity Inorganics
- Battery and Electronic Chemicals
By Project Type
- Greenfield
- Retrofit/Brownfield
By Ownership Model
- Owner-Operated (Captive)
- As-a-Service (Build-Own-Operate)
- Equipment and Technology Licensing
By Country
- China
- India
- Japan
- South Korea
- ASEAN
- Australia and New Zealand
- Rest of Asia Pacific
A Seven-Phase Framework
Our methodology is designed to be universally applicable across commodity chemicals, specialty chemicals, petrochemicals, construction chemicals, coatings, electronic chemicals, industrial gases, agrochemicals, water treatment chemicals, and performance materials. Each phase builds upon the last, creating a layered validation structure that minimizes estimation error and maximizes analytical confidence.
The framework ensures comprehensive market coverage, robust cross-validation, and reliable long-term forecasting — producing market estimates that withstand scrutiny from investors, regulators, and corporate strategy teams.

Seven-Phase Framework — Analytical Effort Distribution
Relative analytical effort allocated across each phase of the Chemicals & Materials research framework

Phase 1 - Secondary Research: Establishing the Foundation
Secondary research collects and evaluates publicly available information from authoritative sources, establishing the foundational understanding of market structure, value chain dynamics, competitive landscape, and end-use demand patterns. Every source is evaluated for credibility, recency, geographic relevance, and methodological soundness before inclusion.
Industry Associations
Sources include ACC, CEFIC, ICCA, JCIA, CPCIF, and SOCMA providing production volumes, consumption trends, capacity developments, and sustainability initiatives.
Company Disclosures
Annual reports, investor presentations, earnings transcripts, and regulatory filings reveal product portfolios, manufacturing footprints, capacity expansions, and revenue segmentation.
Government Databases
National statistical offices, customs authorities, environmental agencies, and industrial production databases provide verified statistics on output, trade flows, and regulatory compliance.
Trade Databases
UN Comtrade, ITC, Eurostat, and national customs authorities enable assessment of global product movement, import dependency, and export competitiveness across regions.
Our Secondary Research Sources
- Ministry of Chemicals and Fertilizers
- European Chemicals Agency
- United States Department of Energy
- Ministry of Industry and Information Technology
- Ministry of Economy Trade and Industry
- Ministry of Trade Industry and Energy
- National Institute of Standards and Technology
- Council of Scientific and Industrial Research
- Fraunhofer Society
- National Institute for Materials Science
Phase 2 — Supply-Side Assessment: Mapping Production Capabilities
Production Capacity Analysis
All major manufacturers are assessed for existing installed capacity, planned additions, expansions, new plant announcements, and technology adoption — mapped at global, regional, and country levels.
Capacity Utilization Adjustment
Installed capacity is adjusted using utilization rates based on demand conditions, feedstock availability, plant operating rates, maintenance schedules, and regulatory restrictions.
Manufacturer Revenue Analysis
Product-specific revenues, segment-level performance, regional distribution, average selling prices, and margin trends are evaluated to establish market value estimates.
Supply-Side Assessment — Capacity vs. Effective Production by Region
Illustrative comparison of installed capacity vs. effective production volume (after utilization rate adjustment) across major regions

Phase 3 — Demand-Side Assessment: Quantifying Chemical Consumption
Demand-side analysis quantifies chemical consumption across industries, applications, and geographies — identifying where and how chemicals are consumed throughout the value chain with precision.
End-Use Industry Analysis
Chemical demand is evaluated across automotive, construction, packaging, electronics, agriculture, healthcare, consumer goods, industrial manufacturing, energy and utilities, and water treatment. Industry output, production trends, and consumption intensity are analyzed to determine demand patterns.
Consumption Modeling
Demand is estimated using measurable indicators: kilograms per vehicle, kilograms per square meter of construction, dosage per cubic meter of water treated, kilograms per hectare of agricultural land, and kilograms per ton of manufactured products. Consumption factors are validated through industry publications and primary interviews.
Application Analysis
The market is segmented by application area to understand product performance requirements, formulation trends, technology adoption, customer preferences, and regulatory requirements improving demand accuracy and segmentation granularity.
Demand-Side Assessment — End-Use Industry Demand Distribution
Illustrative distribution of chemical & materials demand across key end-use industries

Phase 4 - Trade Flow Analysis: Balancing Regional Supply and Demand
Trade flow analysis reconciles regional supply and demand estimates through import and export data, identifying net supply positions, regional dependencies, and market imbalances. It serves as an independent validation layer that tests the consistency of supply-side and demand-side estimates.
Import Analysis
Import data is evaluated to determine volumes, source countries, product dependency, regional supply gaps, and pricing trends — identifying markets that rely heavily on external supply and where domestic production is insufficient to meet demand.
Export Analysis
Export assessments reveal production surplus, export competitiveness, regional manufacturing strength, and global market participation. Export patterns also help validate domestic production estimates and identify net exporting regions.
Apparent Consumption Model
Regional consumption is assessed using the standard apparent consumption formula:
Results identify net importing regions, net exporting regions, regional deficits, and surpluses — serving as an independent validation of supply and demand estimates.
Trade Flow Analysis — Net Supply Position by Region
Illustrative apparent consumption vs. domestic production across major regions — positive gap indicates net import dependency

Phase 5 — Primary Research: The Critical Validation Layer
Primary research tests and refines findings from secondary research through direct engagement with industry participants across the supply chain, demand side, and expert community. It captures intelligence that no database or published report can provide — the real-world experience of manufacturers, buyers, and specialists operating in the market.

Supply-Side Interviews
Conversations with chemical manufacturers, raw material suppliers, contract manufacturers, technology providers, and plant operators cover production trends, capacity utilization, pricing developments, technology shifts, and competitive dynamics.

Demand-Side Interviews
Engagement with OEMs, industrial consumers, procurement managers, distributors, formulators, and end-use manufacturers focuses on consumption trends, purchasing behavior, product substitution, demand outlook, and emerging applications.

Industry Expert Consultations
Additional interviews with industry consultants, independent experts, regulatory specialists, technical professionals, and research institutions provide deeper market context and validate key analytical assumptions.
Focus Areas of Primary Research:
Market Size & Forecast Validation
Revenue estimates, volume consumption, growth rates, forecast assumptions, regional demand.Supply Chain & Value Chain Assessment
Raw material sourcing, supply chain challenges, distribution networks, procurement practices.Production & Capacity Analysis
Manufacturing capacity, utilization rates, expansion projects, plant investments.Pricing & Cost Structure Analysis
Product pricing trends, feedstock costs, energy costs, margin pressures, pricing outlook.Competitive Landscape Assessment
Volume and value estimates confirmed to be fully consistent with one another before publicationInterview Volume by Market Scope
| Study Scope | Number of Interviews |
|---|---|
| Niche Market | 20 – 30 |
| Mid-Sized Market | 30 – 50 |
| Global Market | 50 – 80 |
| Highly Fragmented Market | 80 – 120 |
Interview Details:
Category : Manufacturers, Suppliers, Distributors, End Users, Experts/Associations
Average Duration : 30–60 Minutes
Interview Mode : Video calls, telephonic interviews, expert consultations
Interview Format : Structured / Semi-Structured questionnaire
Focus Areas of Primary Research:
Market Size & Forecast Validation :
Revenue estimates, volume consumption, growth rates, forecast assumptions, regional demand.
Supply Chain & Value Chain Assessment :
Raw material sourcing, supply chain challenges, distribution networks, procurement practices.
Production & Capacity Analysis :
Manufacturing capacity, utilization rates, expansion projects, plant investments.
Pricing & Cost Structure Analysis :
Product pricing trends, feedstock costs, energy costs, margin pressures, pricing outlook.
Competitive Landscape Assessment :
Market share, competitor positioning, strategic initiatives, partnerships, acquisitions.
Primary Research — Stakeholder Coverage by Category
Distribution of interview respondents across stakeholder categories (% share from PPT data)

Primary Research — Respondent Designation Profile
Seniority breakdown of interview respondents (% share from PPT data)

Primary Research — Geographic Coverage of Interviews
Regional distribution of primary research engagement (% share from PPT data)

Phase 6 — Data Triangulation and Market Validation
No single methodology is relied upon in isolation. Multiple independent estimation approaches are combined and reconciled to ensure consistency, accuracy, and analytical defensibility. Any material deviations between approaches are investigated and adjusted through additional validation cycles.
The final market size is derived through weighted triangulation of all validated methodologies. Any material deviations between approaches are investigated and adjusted through additional validation cycles. The outcome represents the most realistic assessment of the market based on available evidence and expert confirmation ensuring that volume and value estimates are fully consistent with one another.
Triangulation Framework — Input Contribution Weight
Relative weight each sizing input contributes to the final reconciled market estimate

Phase 7 — Forecast Modeling: Projecting Future Market Evolution
Forecasting evaluates the future trajectory of the market using a combination of quantitative indicators and qualitative assessments across economic, industry, and regulatory dimensions. Rather than simple extrapolation, each driver is independently modeled and integrated into a composite forecast.
Macroeconomic Indicators
GDP growth, industrial production, manufacturing output, construction activity, consumer spending, and capital investment form the quantitative foundation of long-term demand projections. These are applied at country, regional, and global levels.
Industry Growth Drivers
Urbanization, infrastructure development, industrialization, technological innovation, sustainability initiatives, and evolving product performance requirements are assessed at regional and industry levels — capturing both structural and cyclical demand drivers.
Capacity Expansion Analysis
Announced plant expansions, new manufacturing facilities, technology upgrades, and strategic investments are evaluated to determine future supply-demand dynamics and potential market tightness or oversupply situations.
Regulatory & Sustainability
Environmental regulations, chemical safety standards, emission reduction targets, circular economy initiatives, and sustainability requirements are incorporated as they often influence product adoption rates and market growth trajectories.
Scenario Forecast Range — Indexed Market Growth (Year 1–10)
Illustrative indexed growth trajectories across Base, Optimistic, and Pessimistic scenarios over a 10-year forecast horizon

Forecast Drivers — Relative Impact Score by Category
Impact score (0–100) of each driver type on chemicals & materials market forecast




Comments
Share your thoughts, ask a question, or provide feedback about this report.