
Aerospace Foam Market Size Analysis Report 2035
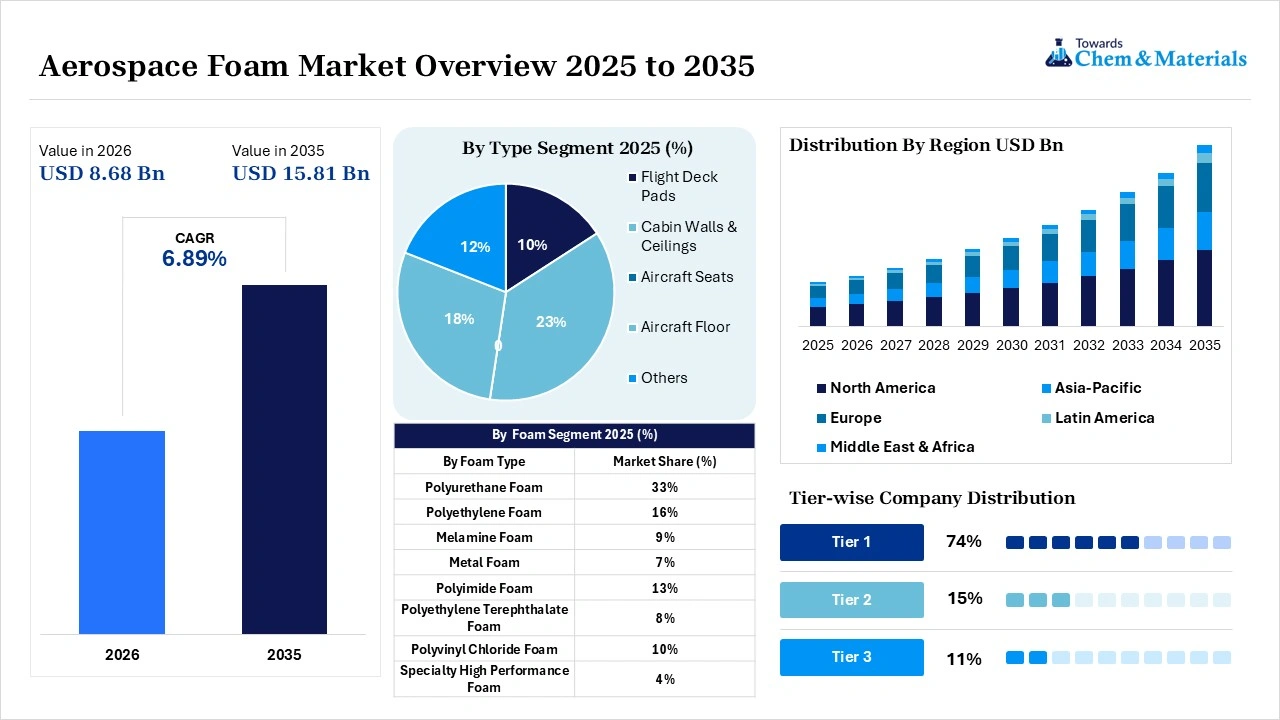
The global aerospace foam market size was valued at USD 8.12 billion in 2025, is estimated to reach USD 8.68 billion in 2026, and is projected to reach USD 15.81 billion by 2035, exhibiting a compound annual growth rate (CAGR) of 6.89% over the forecast period from 2026 to 2035.North America dominated the aerospace foam market with the largest revenue share of 38% in 2025 and is expected to grow at the fastest CAGR of 7.02% during the forecast period. In terms of volume, the aerospace foam market is projected to grow from 422.30 thousand metric tons in 2025 to 757.70 thousand metric tons by 2035. growing at a CAGR of 6.02% from 2026 to 2035.Increasing demand for lightweight and fuel-efficient aircraft is the key factor driving market growth. Also, ongoing growth of global air travel coupled with the strict thermal safety standards for thermal insulation can fuel market growth further.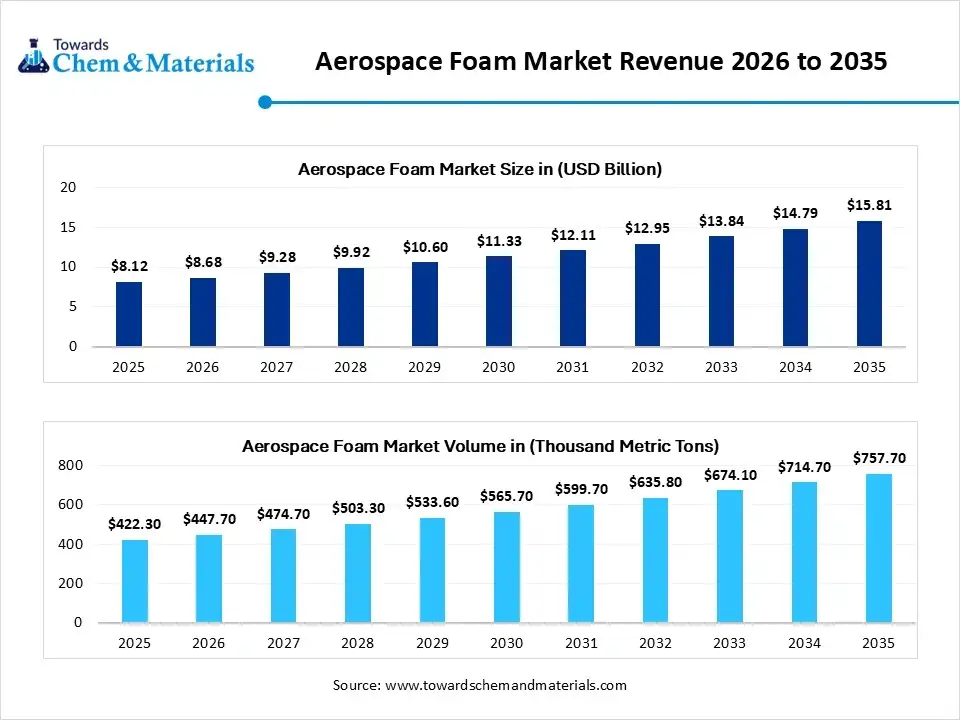
Market Highlights
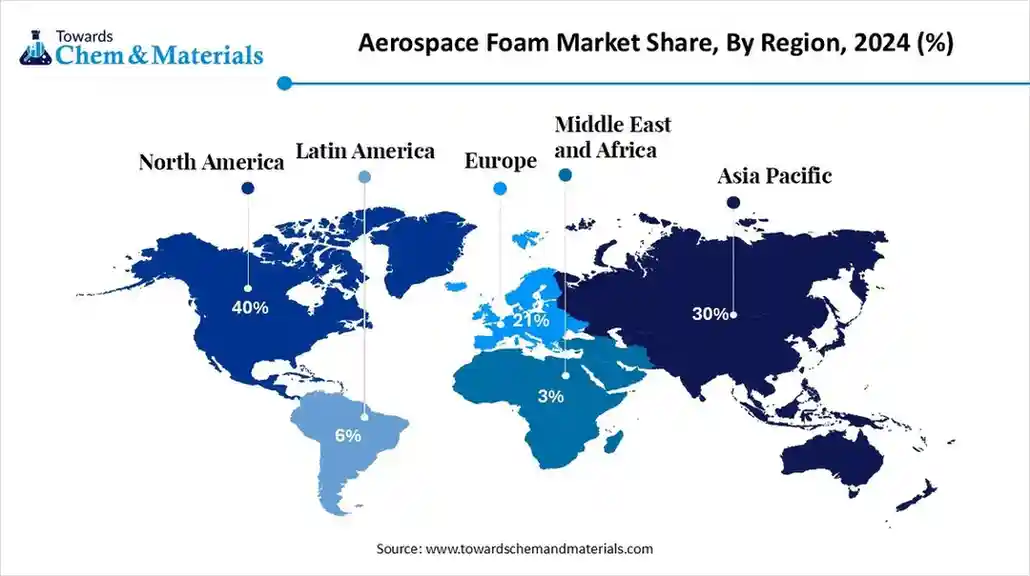
- By region, North America dominated the market with the largest share of 38% in 2025. The dominance of the region can be attributed to the robust base of original equipment manufacturers (OEMs).
- By region, Asia Pacific held the market share of 25% in 2025 and is expected to grow at the fastest CAGR of 8.2% over the forecast period. The growth of the region can be credited to the increasing commercial air travel and ongoing growth of indigenous aviation manufacturing.
- By foam type, the polyurethane foam segment dominated the market with the largest share of 33% in 2025. The aircraft manufacturers heavily rely on polyurethane foam because it hits a "sweet spot" of being high-performing yet affordable.
- By foam type, the polyimide foam segment held the market share of 13% in 2025 and is expected to grow at the fastest CAGR of 8.6% over the forecast period. It serves as a high-performance, premium segment prized for its extreme heat resistance, flame-retardant characteristics, and lightweight properties.
- By application, the aircraft seats segment dominated the market with the largest share of 37% in 2025. Modern planes use innovative foams to minimize the weight of passenger cabins; hence, lighter seats mean planes burn less fuel and emit less carbon dioxide.
- By application, the flight deck pads segment held the market share of 10% in 2025 and is expected to grow at the fastest CAGR of 7.8% over the projected period. These pads offer crucial cushioning and ergonomic support to minimize pilot fatigue.
- By end-use, the commercial aviation segment dominated the market with the largest share of 56% in 2025. The commercial carriers focus on durable, lightweight, and fire-resistant materials to minimize aircraft weight, enhance fuel efficiency, and ensure regulatory compliance.
- By end-use, the military aircraft segment held the market share of 21% in 2025 and is expected to grow at the fastest CAGR of 7.9% over the forecast period. Military operations need aircraft to survive harsh environments.
 Technological Innovations in Foam Production Supports Market Growth
Ongoing innovations in aerospace foam technology enhance the performance characteristics of durability, thermal resistance, and noise absorption. These advancements enable the use of materials in different applications, such as seating, insulation, and structure.
In April 2026, Zotefoams, a global cellular materials manufacturer, has appointed Wulfmeyer, a German aviation specialist based in Hannover, as its first aerospace-approved fabricator under its Global Partner Program. The firm manufactures aircraft interior components, such as non-textile flooring, engineered foam parts, and adhesive systems.(Source:www.aero-mag.com)
Lightweight aerospace foams are rapidly becoming crucial as the market is moving towards fuel-efficient technologies in both defense and commercial realms.
Global Investment Flow for Aerospace Foam 2025
Major investments are targeting polyurethane (PU) and polyethylene (PE) foams to reduce carbon emissions, cut aircraft weight, and increase fuel efficiency. Many airlines are funding aftermarket refurbishments and cabin upgrades to fulfill the increased passenger comfort demands.
Riyadh Air, the newly established national carrier of Saudi Arabia, has officially revealed its highly anticipated cabin interiors ahead of its inaugural commercial flights scheduled for later this year. Characterized as the world's first digital-native airline, Riyadh Air is adopting a forward-thinking, "no legacy" strategy.
High upfront Research & Development (R&D) investments are needed to fulfill strict flame-retardant standards set by the FAA and EASA.
Aerospace Foam Market Trends
- A surge in defense investments in emerging economies is the latest trend in the market shaping positive market growth. Also, major countries globally are starting to implement modernization programs associated with defense, which require more innovative materials to produce aircraft.
- In recent years, the market has been witnessing an exponential surge in demand for lightweight materials, fuelled by the aerospace sector's quest for fuel performance and fuel efficiency. Lightweight foams, like polyethylene and polyurethane, are heavily used in aircraft interiors and structural components.
- The aerospace industry is under immense pressure to minimize its environmental footprint, supporting a transition towards sustainable foam solutions, which is the future trend in the market. Hence, market players are exploring end-of-life solutions for foam products.
Report Scope
| Report Attributes | Details |
| Market Size in 2026 | USD 8.68 Billion/ 447.72 Thousand Metric Tons |
| Expected Size by 2035 | USD 15.81 Billion/ 757.70 Thousand Metric Tons |
| Growth Rate from 2025 to 2035 | CAGR 6.89% |
| Base Year of Estimation | 2025 |
| Forecast Period | 2025 - 2035 |
| Dominant Region | North America |
| Segment Covered | By Foam Type, By Application, By End-use, By Region |
| Key Companies Profiled | Boyd Corporation, ERG Aerospace Corporation, SABIC, ZOTEFOAMS PLC, General Plastics Manufacturing Company, Solvay, UFP Technologies, Inc., NCFI Polyurethanes, DuPont |
AI-Powered Predictive Formulations in the Aerospace Foam Market
Artificial intelligence is transforming the market by replacing costly trial-and-error chemistry with data-driven, simulation-driven, and predictive modelling design. Furthermore, algorithms use historical testing data along with deep learning to output formulations and recipes that increase safety and overall structural integrity.
Supply Chain Analysis of the Aerospace Foam Market
Production & Processing
- It involves converting polymers such as polyimide, melamine, and polyethylene into cellular structures using specialized blowing agents and chemical curing. By using computer-controlled manufacturing, such as CNC foam cutting and 3D foam shaping, to achieve exact and intricate geometries.
- BASF SE: A leading global chemical company producing advanced polyurethane and melamine foam solutions (e.g., Basotect) designed for thermal and acoustic insulation in cabins.
- Other Key Players: Solvay, Boyd Corporation
Quality Testing and Certification
- It ensures aerospace foams should meet stringent safety standards, as these materials are generally used in aircraft interiors, insulation, and seating; they must pass strict FST (fire, smoke, and toxicity) evaluations. In addition, testing is heavily regulated by bodies such as the Federal Aviation Administration (FAA) and the European Union Aviation Safety Agency (EASA).
- Evonik Industries AG (Germany): A leader in high-performance structural foams, especially PMIs (polymethacrylimide) used in rigid core aerospace structures.
- Other Key Players: Zotefoams plc, Boyd Corporation
Distribution to Industrial Users
- It involves procurement and supply of advanced, lightweight, and flame-retardant foam materials to original equipment manufacturers (OEMs) and maintenance, repair, and overhaul (MRO) facilities. These specialized foams are crucial components for the production and refurbishment of aircraft seating, flooring, cabin partitions, and insulation systems.
- Rogers Corporation: Provides high-performance polyurethane and silicone foams optimized for shock absorption and vibration damping in aircraft interiors.
- Other Key Players: Hexcel Corporation, Zotefoams plc
Aerospace Foam Market’s Regulatory Landscape: Global Regulations
| Country/Region | Key Regulations |
| United States | Department of Defense (DoD): Drives the transition to fluorine-free foams (F3) to eliminate toxic per- and polyfluoroalkyl substances (PFAS) in military and defense aircraft applications. |
| European Union | European Union Aviation Safety Agency (EASA): Enforces CS-25 certification specifications, aligning closely with the FAA on strict fire resistance and low cabin toxicity metrics. |
| India | Directorate General of Civil Aviation (DGCA): Implements Civil Aviation Requirements (CAR 21) which sync directly with EASA and FAA rules for material approvals. |
Market Dynamics
Driver
Technological Advancements in Foam Production
Technological innovations in foam manufacturing are one of the major factors driving market growth. Advancements like 3D printing and cutting-edge molding techniques are allowing market players to create complex geometries and customized foam solutions. In addition, these innovations further improve essential foam properties, such as thermal insulation and impact resistance, while optimizing manufacturing workflows to successfully reduce production time and expenses.
Restraint
High Raw Material Costs
Manufacturing aerospace-grade foams needs expensive ingredients and specialized tools, which are the major factors hindering the growth of the market. Most aerospace foams depend on chemicals made from petrochemicals. Moreover, innovative foams such as metal foams or high-temperature plastics need complex machinery to build, which keeps prices high.
Opportunity
Growing Demand for Passenger Safety and Comfort
The surge in air passenger traffic and the changing expectations of travellers is creating lucrative opportunities in the market. Modern aircraft designs heavily use superior foam materials to enhance cabin acoustics, minimize vibration, and offer thermal insulation, which leads to a more comfortable flight experience. Furthermore, increasing emphasis on the passenger experience has significantly boosted the demand for high-performance aircraft seating foam. Additionally, aerospace acoustic foam plays a critical role in reducing cabin noise and vibration.
Segmental Insights
Foam Type Insights
The Polyurethane Foam Segment Dominated the Aerospace Foam Market with 33% of Market Share in 2025
The polyurethane foam segment dominated the market with the largest share of 33% in 2025. The aircraft manufacturers heavily rely on polyurethane foam because it hits a "sweet spot" of being high-performing yet affordable as compared to other specialty alternatives. In addition, modern aerospace PU foams are created to fulfill stringent Fire, Smoke, and Toxicity (FST) safety standards implemented by aviation regulators like the FAA. It further offers thermal insulation, better durability, and sound-dampening at a much lower cost than specialized polyimide and metal foams.
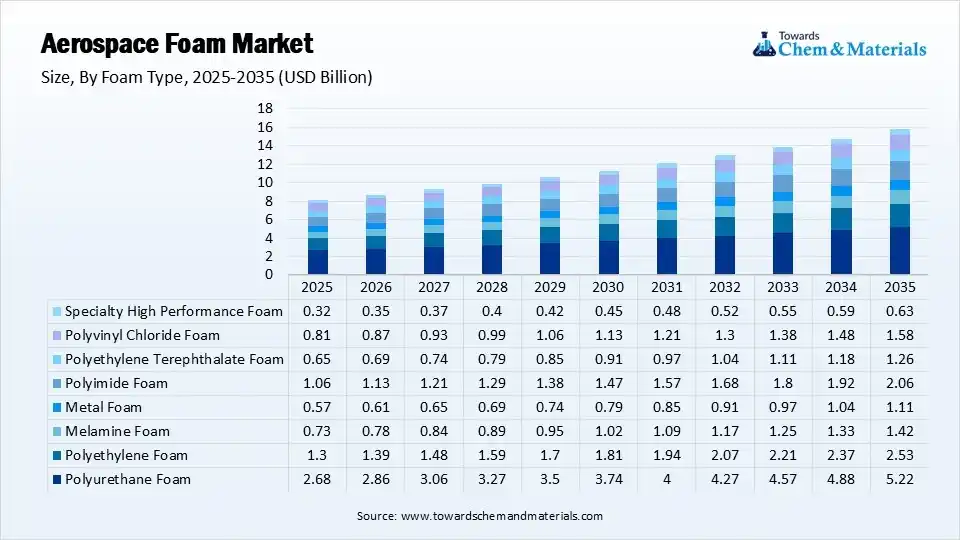 The polyimide foam segment held the market share of 13% in 2025 and is expected to grow at the fastest CAGR of 8.6% over the forecast period. It serves as a high-performance, premium segment prized for its extreme heat resistance, flame-retardant characteristics, and lightweight properties. These foam types have high flame-retardant and temperature resistance properties. These qualities are crucial for harsh aerospace environments, and the foam is increasingly used in applications requiring exceptional thermal stability and fire safety, such as engine compartments and specialized insulation for critical systems.
Application Insights
The Aircraft Seats Segment Dominated the Market with 37% of Market Share in 2025
The aircraft seats segment dominated the market with the largest share of 37% in 2025. Modern planes use innovative foams to minimize the weight of passenger cabins; hence, lighter seats mean planes burn less fuel and emit less carbon dioxide. Polyethylene foams are increasingly used in seat applications for their exceptional shock-absorbing capabilities and lightweight properties. Flame-retardant grades of PE are extensively used to double as flotation and buoyancy devices for over-water safety. The growing need for lightweight aircraft components to propel fuel efficiency in modern cabins is driving segment growth soon.
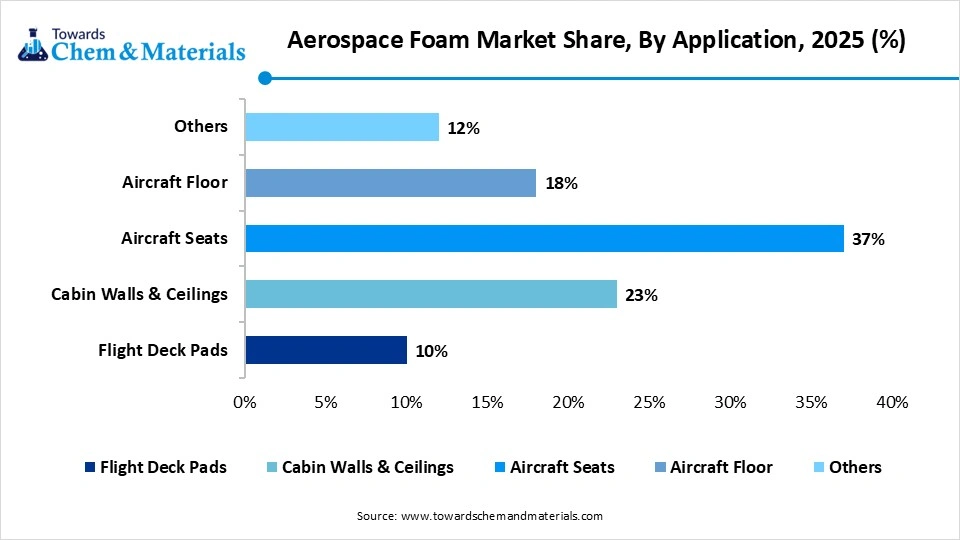
The flight deck pads segment held the market share of 10% in 2025 and is expected to grow at the fastest CAGR of 7.8% over the projected period. This pad offers crucial cushioning and ergonomic support to minimize pilot fatigue by offering exceptional thermal insulation and noise dampening, reducing cockpit interference from engines and aerodynamic forces. Stringent safety and comfort regulations from aviation authorities are increasingly driving this trend. Because airlines place a high priority on passenger experience and safety, this segment represents a major market for foam applications.
End-use Insights
The Commercial Aviation Segment Dominated the Market with 56% of Market Share in 2025
The commercial aviation segment dominated the market with the largest share of 56% in 2025. The commercial carriers focus on durable, lightweight, and fire-resistant materials to minimize aircraft weight, enhance fuel efficiency, and ensure regulatory compliance. Airlines continually seek to reduce aircraft weight. The integration of foam composites, over traditional heavy metals and dense plastics, significantly decreases overall mass. This reduction in weight enables aircraft to consume less fuel and emit lower levels of greenhouse gases. These foams are generally used to build insulated interior panels. These panels form a crucial layer that reduces engine noise.
The military aircraft segment held the market share of 21% in 2025 and is expected to grow at the fastest CAGR of 7.9% over the forecast period. Military operations need aircraft to survive harsh environments. Therefore, aerospace foams used in this segment should meet much higher safety, durability, and specialized performance standards than those in commercial travel. Furthermore, military assets are deployed across diverse environments, ranging from extreme deserts to high-altitude, freezing conditions. In these settings, advanced foams are used to protect temperature-sensitive payloads and weapons systems.
Regional Analysis
How did North America Dominated the Aerospace Foam Market in 2025?
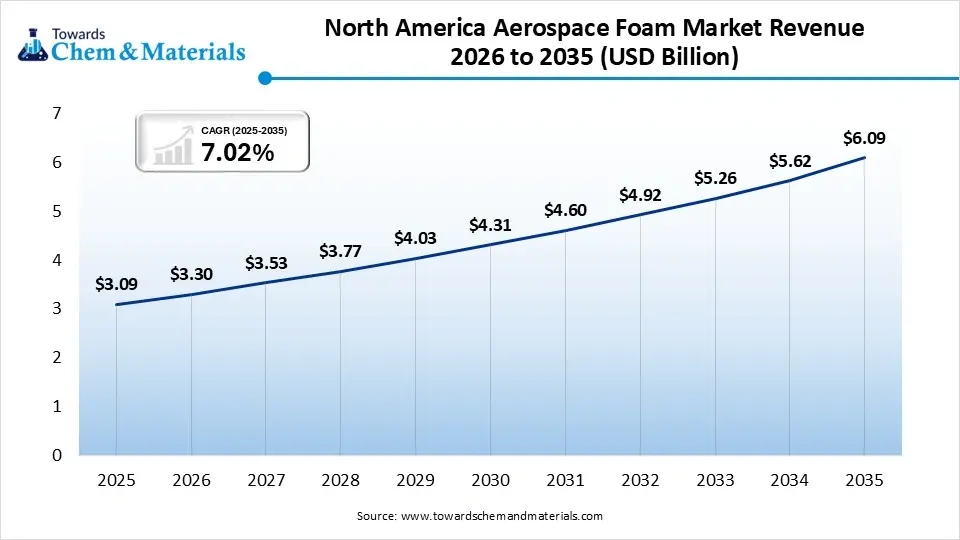
The North America aerospace foam market size was estimated at USD 3.09 billion in 2025 and is projected to reach USD 6.09 billion by 2035, growing at a CAGR of 7.02% from 2026 to 2035.North America dominated the market with the largest share of 38% in 2025. The dominance of the region can be attributed to the robust base of original equipment manufacturers (OEMs) such as Lockheed Martin and Boeing along with the stringent safety regulations. In addition, the region also benefits from the localized manufacturing presence of aerospace giants and advanced research & development (R&D) networks.
United States
- Aerospace foams are heavily used in seating, cabin linings, and sandwich panels to reduce total aircraft weight, which improves fuel efficiency and payload capacity.
- A surge in air passenger traffic and the need for upgraded cabin interiors drive demand for polyurethane and polyethylene foams, leading to country growth soon.
Canada
The large fleet of commercial passenger and cargo aircraft needs continuous maintenance, repair, and overhaul (MRO), generating sustained aftermarket demand.Increased military expenditures and fleet modernization projects require foams with specialized properties like shock absorption and ballistic protection.
The Aisa Pacific aerospace foam market size was estimated at USD 2.03 billion in 2025 and is projected to reach USD 4.03 billion by 2035, growing at a CAGR of 7.10% from 2026 to 2035.Asia Pacific held the market share of 25% in 2025 and was expected to grow at the fastest CAGR of 8.2% over the forecast period. The growth of the region can be credited to the increasing commercial air travel, ongoing growth of indigenous aviation manufacturing, and surge in middle-class populations in emerging economies. To minimize environmental impact and lower emissions, the aerospace industry is increasingly using advanced lightweight core structures, specifically PET foams, bio-polyurethanes, and recyclable materials.
China
Rapid middle-class expansion and low-cost carrier penetration are driving robust commercial fleet growth and subsequent MRO (Maintenance, Repair, and Overhaul) retrofitting of cabin interiors.
Market shifts toward aerogel-based foams and nanotechnology integration to improve thermal/cryogenic insulation and fire resistance properties.
India
A growing middle class and increasing disposable incomes have led to historic aircraft orders by Indian carriers, leading to market growth soon.India is emerging as a regional MRO hub. Increasing maintenance activities require constant replacement of degrading interior acoustic/thermal insulation, carpets, and seating foams.
The Europe aerospace foam market size was estimated at USD 2.19 billion in 2025 and is projected to reach USD 4.35 billion by 2035, growing at a CAGR of 7.10% from 2026 to 2035.Europe held the market share of 27% in 2025. The growth of the region can be linked to the ongoing push for fuel-efficient, lightweight aircraft along with stringent safety regulations. The European Union Aviation Safety Agency (EASA) is increasingly enforcing rigorous smoke, fire, and toxicity (FST) regulations. That needs consistent material advancements, impelling market players to manufacture advanced foams.
Germany
The push to minimize aircraft weight to meet stringent EU carbon reduction targets drives heavy adoption of polyurethane and polyethylene foams in seating, ducting, and structural components.Increasing demand for premium aircraft seating and improved cabin aesthetics needs continuous advancements in resilient, high-comfort polyurethane foams.
France
French operators and airline suppliers are increasingly upgrading fleets with advanced, ergonomic polyurethane foams that offer superior vibration damping and acoustic insulation.Foams used in the French aerospace sector must strictly comply with EASA flammability, smoke, and toxicity (FST) standards.
The Latin America aerospace foam market size was estimated at USD 0.41 billion in 2025 and is projected to reach USD 0.87 billion by 2035, growing at a CAGR of 7.81% from 2026 to 2035.Latin America held the market share of 5% in 2025. The growth of the region can be driven by growing aviation accessibility and steady cabin refurbishment programs along with the increasing demand for lightweight, high-performance materials. Also, the demand for improved cabin comfort fuels demand for innovative melamine and polyimide foams that offer better sound dampening and temperature stability.
Brazil
Brazil's market is heavily supported by the strong regional manufacturing footprint of Embraer. Consistent production of commercial and regional jets creates steady, localized demand for aerospace-grade foams used in seating, insulation, and interior panels.Ongoing Maintenance, Repair, and Overhaul (MRO) activities and the retrofitting of aircraft cabins drive a continuous aftermarket demand for high-performance foams that meet strict flammability.
Argentina
Airlines and manufacturers are prioritizing advanced foam composites such as polyurethane, polyimide, and polyethylene in aircraft insulation and interior panels because they provide high strength-to-weight ratios.Closed-cell and specialized foams are increasingly adopted in next-generation aircraft to reduce cabin noise and improve passenger comfort.
The Middle East & Africa aerospace foam market size was estimated at USD 0.41 billion in 2025 and is projected to reach USD 0.87 billion by 2035, growing at a CAGR of 7.81% from 2026 to 2035.The Middle East & Africa held a market share of 5% in 2025. The growth of the region can be attributed to the rapid investment in robust aviation MRO facilities and the growth of major commercial fleets in major countries. Furthermore, stringent compliance with international aviation mandates, such as those set by the FAA and EASA, regarding fire-retardant, low-smoke, and low-toxicity materials drives a consistent demand for premium, certified aerospace foams.
Saudi Arabia
Ambitious aviation agendas and fleet upgrade programs from regional carriers like Saudi need advanced acoustic and thermal insulation, driving market growth soon.The kingdom's focus on economic diversification has sparked the development of dedicated aerospace parks and strategic investments in defense.
UAE
The UAE, primarily driven by hubs in Dubai and Abu Dhabi, serves as a major global center for aerospace repair and maintenance.The UAE Circular Economy Policy mandates sustainable industrial practices, pushing regional aerospace suppliers to integrate eco-friendly, bio-based, and recyclable foam alternatives to reduce carbon footprints.
Recent Developments
- In March 2026, Hexcel Corporation announced it will present its advanced lightweight composite solutions at the upcoming JEC World exhibition, held at Paris Nord Villepinte. The company's dedicated exhibition space will feature a comprehensive portfolio of high-performance materials.(Source:www.jeccomposites.com)
- In May 2026, GE Aerospace is expanding its 360 Foam Wash jet engine cleaning to maintenance, repair, and overhaul (MRO) facilities globally. According to the manufacturer, this proprietary process reduces exhaust gas temperatures, enhances compressor efficiency, and restores performance margins.(Source:www.aerotime.aero)
Competitive Analysis
Major market players across the globe are using cutting-edge material engineering, global distribution, and sustainability-emphasized product advancements to capture major market share. The competitive landscape is further characterized by a mix of extensive chemical conglomerates and specialized, engineered-foam producers to secure raw materials.
- BASF has launched biomass balance (BMB) grades of its Autofroth® polyurethane systems, specifically designed for the low-pressure polyurethane foam market. These mass-balanced products, along with numerous BASF manufacturing facilities.(Source:www.basf.com)
Strategic Profiles of Key Players Shaping the Aerospace Foam Market
| Company | Company Type / Position | Headquarters | Geographic Presence | Offerings | Key Offering / Strength |
| Evonik Industries AG | Specialty Chemicals Multinational / Global market leader in high-performance rigid polymethacrylimide (PMI) structural core foams. | Essen, Germany | Global operations with primary production and tech hubs across Europe, North America, and Asia-Pacific. | ROHACELLstructural PMI foams and advanced lightweight composite core systems. | ROHACELL PMI Foams: Unmatched strength-to-weight ratio and high temperature resistance, essential for sandwich core structures in aircraft wings, tails, and space launch |
| Zotefoams plc | Niche Cellular Materials Innovator / Industry-standard manufacturer of closed-cell block foams using a unique supercritical nitrogen gas expansion process. | Croydon, United Kingdom | Global footprint with dedicated production facilities in the UK and USA, and a vast distribution network. | ZOTEK® F (Fluoropolymer foams using PVDF) and Ecozote® sustainable flame-retardant polyethylene foam ranges. | ZOTEK® F PVDF Foams: Outstanding Fire, Smoke, and Toxicity (FST) performance, fulfilling strict FAA aviation safety mandates for closed-cell insulation. |
| Rogers Corporation | Engineered Materials Specialist / Dominant supplier of elastomeric gaskets, structural sealants, and impact-absorption components. | Chandler, Arizona, United States | Extensive manufacturing facilities situated across North America, Europe, and major technology corridors in Asia. | PORON® microcellular polyurethanes, BISCO silicone foams, and sound dampening acoustic barriers. | BISCO Silicones: High-temperature sealing capabilities and extreme flame-barrier properties engineered for flight deck instrumentation and harsh-environment seals. |
Other Top Players Are
- DuPont
- ERG Aerospace Corporation
- General Plastics Manufacturing Company
- Greiner Foam International GmbH
- Solvay
- UFP Technologies Inc.
Segments Covered:
By Foam Type
- Polyurethane Foam
- Flexible Polyurethane Foam
- Rigid Polyurethane Foam
- Structural Polyurethane Foam
- Polyethylene Foam
- Cross-linked PE Foam
- Non-cross-linked PE Foam
- Melamine Foam
- Flexible Melamine Foam
- Acoustic Melamine Foam
- Metal Foam
- Aluminum Foam
- Titanium Foam
- Nickel Foam
- Polyimide Foam
- Open-cell Polyimide Foam
- Closed-cell Polyimide Foam
- Polyethylene Terephthalate Foam
- Standard PET Foam
- Recycled PET Foam
- Polyvinyl Chloride Foam
- Cross-linked PVC Foam
- Linear PVC Foam
- Specialty High-Performance Foam
- PMI Foam
- PEI Foam
- Hybrid Aerospace Foam
By Application
- Flight Deck Pads
- Cabin Walls & Ceilings
- Aircraft Seats
- Aircraft Floor
- Others
- Cargo Liners
- Overhead Storage
- Interior Panels
- Lavatories
- Galleys
By End-use
- General Aviation
- Business Jets
- Piston Aircraft
- Turboprop Aircraft
- Commercial Aviation
- Narrow-body Aircraft
- Wide-body Aircraft
- Regional Aircraft
- Military Aircraft
- Fighter Aircraft
- Transport Aircraft
- Surveillance Aircraft
- UAVs
- Rotary Aircraft
- Civil Helicopters
- Military Helicopters
By Region
- North America
- U.S.
- Canada
- Europe
- Germany
- UK
- France
- Italy
- Spain
- Sweden
- Denmark
- Norway
- Asia Pacific
- China
- Japan
- India
- South Korea
- Thailand
- Latin America
- Brazil
- Mexico
- Argentina
- Middle East and Africa (MEA)
- South Africa
- UAE
- Saudi Arabia
- Kuwait
A Seven-Phase Framework
Our methodology is designed to be universally applicable across commodity chemicals, specialty chemicals, petrochemicals, construction chemicals, coatings, electronic chemicals, industrial gases, agrochemicals, water treatment chemicals, and performance materials. Each phase builds upon the last, creating a layered validation structure that minimizes estimation error and maximizes analytical confidence.
The framework ensures comprehensive market coverage, robust cross-validation, and reliable long-term forecasting — producing market estimates that withstand scrutiny from investors, regulators, and corporate strategy teams.

Seven-Phase Framework — Analytical Effort Distribution
Relative analytical effort allocated across each phase of the Chemicals & Materials research framework

Phase 1 - Secondary Research: Establishing the Foundation
Secondary research collects and evaluates publicly available information from authoritative sources, establishing the foundational understanding of market structure, value chain dynamics, competitive landscape, and end-use demand patterns. Every source is evaluated for credibility, recency, geographic relevance, and methodological soundness before inclusion.
Industry Associations
Sources include ACC, CEFIC, ICCA, JCIA, CPCIF, and SOCMA providing production volumes, consumption trends, capacity developments, and sustainability initiatives.
Company Disclosures
Annual reports, investor presentations, earnings transcripts, and regulatory filings reveal product portfolios, manufacturing footprints, capacity expansions, and revenue segmentation.
Government Databases
National statistical offices, customs authorities, environmental agencies, and industrial production databases provide verified statistics on output, trade flows, and regulatory compliance.
Trade Databases
UN Comtrade, ITC, Eurostat, and national customs authorities enable assessment of global product movement, import dependency, and export competitiveness across regions.
Our Secondary Research Sources
- Ministry of Chemicals and Fertilizers
- European Chemicals Agency
- United States Department of Energy
- Ministry of Industry and Information Technology
- Ministry of Economy Trade and Industry
- Ministry of Trade Industry and Energy
- National Institute of Standards and Technology
- Council of Scientific and Industrial Research
- Fraunhofer Society
- National Institute for Materials Science
Phase 2 — Supply-Side Assessment: Mapping Production Capabilities
Production Capacity Analysis
All major manufacturers are assessed for existing installed capacity, planned additions, expansions, new plant announcements, and technology adoption — mapped at global, regional, and country levels.
Capacity Utilization Adjustment
Installed capacity is adjusted using utilization rates based on demand conditions, feedstock availability, plant operating rates, maintenance schedules, and regulatory restrictions.
Manufacturer Revenue Analysis
Product-specific revenues, segment-level performance, regional distribution, average selling prices, and margin trends are evaluated to establish market value estimates.
Supply-Side Assessment — Capacity vs. Effective Production by Region
Illustrative comparison of installed capacity vs. effective production volume (after utilization rate adjustment) across major regions

Phase 3 — Demand-Side Assessment: Quantifying Chemical Consumption
Demand-side analysis quantifies chemical consumption across industries, applications, and geographies — identifying where and how chemicals are consumed throughout the value chain with precision.
End-Use Industry Analysis
Chemical demand is evaluated across automotive, construction, packaging, electronics, agriculture, healthcare, consumer goods, industrial manufacturing, energy and utilities, and water treatment. Industry output, production trends, and consumption intensity are analyzed to determine demand patterns.
Consumption Modeling
Demand is estimated using measurable indicators: kilograms per vehicle, kilograms per square meter of construction, dosage per cubic meter of water treated, kilograms per hectare of agricultural land, and kilograms per ton of manufactured products. Consumption factors are validated through industry publications and primary interviews.
Application Analysis
The market is segmented by application area to understand product performance requirements, formulation trends, technology adoption, customer preferences, and regulatory requirements improving demand accuracy and segmentation granularity.
Demand-Side Assessment — End-Use Industry Demand Distribution
Illustrative distribution of chemical & materials demand across key end-use industries

Phase 4 - Trade Flow Analysis: Balancing Regional Supply and Demand
Trade flow analysis reconciles regional supply and demand estimates through import and export data, identifying net supply positions, regional dependencies, and market imbalances. It serves as an independent validation layer that tests the consistency of supply-side and demand-side estimates.
Import Analysis
Import data is evaluated to determine volumes, source countries, product dependency, regional supply gaps, and pricing trends — identifying markets that rely heavily on external supply and where domestic production is insufficient to meet demand.
Export Analysis
Export assessments reveal production surplus, export competitiveness, regional manufacturing strength, and global market participation. Export patterns also help validate domestic production estimates and identify net exporting regions.
Apparent Consumption Model
Regional consumption is assessed using the standard apparent consumption formula:
Results identify net importing regions, net exporting regions, regional deficits, and surpluses — serving as an independent validation of supply and demand estimates.
Trade Flow Analysis — Net Supply Position by Region
Illustrative apparent consumption vs. domestic production across major regions — positive gap indicates net import dependency

Phase 5 — Primary Research: The Critical Validation Layer
Primary research tests and refines findings from secondary research through direct engagement with industry participants across the supply chain, demand side, and expert community. It captures intelligence that no database or published report can provide — the real-world experience of manufacturers, buyers, and specialists operating in the market.

Supply-Side Interviews
Conversations with chemical manufacturers, raw material suppliers, contract manufacturers, technology providers, and plant operators cover production trends, capacity utilization, pricing developments, technology shifts, and competitive dynamics.

Demand-Side Interviews
Engagement with OEMs, industrial consumers, procurement managers, distributors, formulators, and end-use manufacturers focuses on consumption trends, purchasing behavior, product substitution, demand outlook, and emerging applications.

Industry Expert Consultations
Additional interviews with industry consultants, independent experts, regulatory specialists, technical professionals, and research institutions provide deeper market context and validate key analytical assumptions.
Focus Areas of Primary Research:
Market Size & Forecast Validation
Revenue estimates, volume consumption, growth rates, forecast assumptions, regional demand.Supply Chain & Value Chain Assessment
Raw material sourcing, supply chain challenges, distribution networks, procurement practices.Production & Capacity Analysis
Manufacturing capacity, utilization rates, expansion projects, plant investments.Pricing & Cost Structure Analysis
Product pricing trends, feedstock costs, energy costs, margin pressures, pricing outlook.Competitive Landscape Assessment
Volume and value estimates confirmed to be fully consistent with one another before publicationInterview Volume by Market Scope
| Study Scope | Number of Interviews |
|---|---|
| Niche Market | 20 – 30 |
| Mid-Sized Market | 30 – 50 |
| Global Market | 50 – 80 |
| Highly Fragmented Market | 80 – 120 |
Interview Details:
Category : Manufacturers, Suppliers, Distributors, End Users, Experts/Associations
Average Duration : 30–60 Minutes
Interview Mode : Video calls, telephonic interviews, expert consultations
Interview Format : Structured / Semi-Structured questionnaire
Focus Areas of Primary Research:
Market Size & Forecast Validation :
Revenue estimates, volume consumption, growth rates, forecast assumptions, regional demand.
Supply Chain & Value Chain Assessment :
Raw material sourcing, supply chain challenges, distribution networks, procurement practices.
Production & Capacity Analysis :
Manufacturing capacity, utilization rates, expansion projects, plant investments.
Pricing & Cost Structure Analysis :
Product pricing trends, feedstock costs, energy costs, margin pressures, pricing outlook.
Competitive Landscape Assessment :
Market share, competitor positioning, strategic initiatives, partnerships, acquisitions.
Primary Research — Stakeholder Coverage by Category
Distribution of interview respondents across stakeholder categories (% share from PPT data)

Primary Research — Respondent Designation Profile
Seniority breakdown of interview respondents (% share from PPT data)

Primary Research — Geographic Coverage of Interviews
Regional distribution of primary research engagement (% share from PPT data)

Phase 6 — Data Triangulation and Market Validation
No single methodology is relied upon in isolation. Multiple independent estimation approaches are combined and reconciled to ensure consistency, accuracy, and analytical defensibility. Any material deviations between approaches are investigated and adjusted through additional validation cycles.
The final market size is derived through weighted triangulation of all validated methodologies. Any material deviations between approaches are investigated and adjusted through additional validation cycles. The outcome represents the most realistic assessment of the market based on available evidence and expert confirmation ensuring that volume and value estimates are fully consistent with one another.
Triangulation Framework — Input Contribution Weight
Relative weight each sizing input contributes to the final reconciled market estimate

Phase 7 — Forecast Modeling: Projecting Future Market Evolution
Forecasting evaluates the future trajectory of the market using a combination of quantitative indicators and qualitative assessments across economic, industry, and regulatory dimensions. Rather than simple extrapolation, each driver is independently modeled and integrated into a composite forecast.
Macroeconomic Indicators
GDP growth, industrial production, manufacturing output, construction activity, consumer spending, and capital investment form the quantitative foundation of long-term demand projections. These are applied at country, regional, and global levels.
Industry Growth Drivers
Urbanization, infrastructure development, industrialization, technological innovation, sustainability initiatives, and evolving product performance requirements are assessed at regional and industry levels — capturing both structural and cyclical demand drivers.
Capacity Expansion Analysis
Announced plant expansions, new manufacturing facilities, technology upgrades, and strategic investments are evaluated to determine future supply-demand dynamics and potential market tightness or oversupply situations.
Regulatory & Sustainability
Environmental regulations, chemical safety standards, emission reduction targets, circular economy initiatives, and sustainability requirements are incorporated as they often influence product adoption rates and market growth trajectories.
Scenario Forecast Range — Indexed Market Growth (Year 1–10)
Illustrative indexed growth trajectories across Base, Optimistic, and Pessimistic scenarios over a 10-year forecast horizon

Forecast Drivers — Relative Impact Score by Category
Impact score (0–100) of each driver type on chemicals & materials market forecast




Comments
Share your thoughts, ask a question, or provide feedback about this report.