
U.S. Aquaculture Market Size Analysis Report 2035
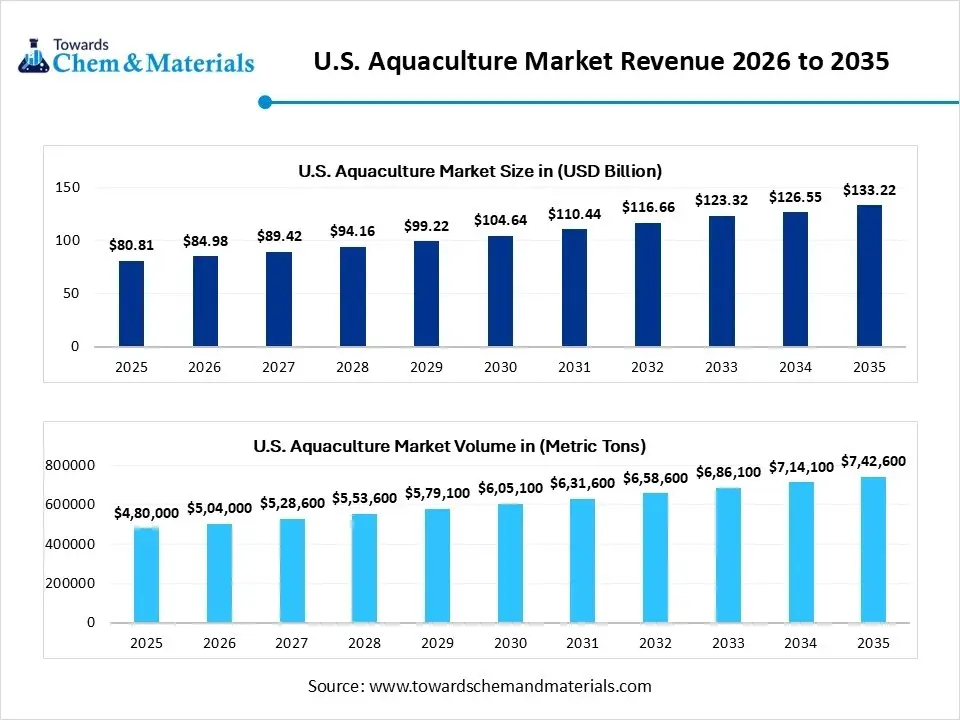
The U.S. aquaculture market size was estimated at USD 80.81 billion in 2025 and is expected to be worth around USD 133.22 billion by 2035, growing at a CAGR of 5.13 % from 2026 to 2035. In terms of volume, the U.S. aquaculture market is projected to grow from 480,000 million tons in 2025 to 742,600 million tons by 2035. growing at a CAGR of 5.11% from 2026 to 2035. the shift towards seafood and food security is forecasted to support the reshaping of supply and demand dynamics in the coming years.
Key Takeaways
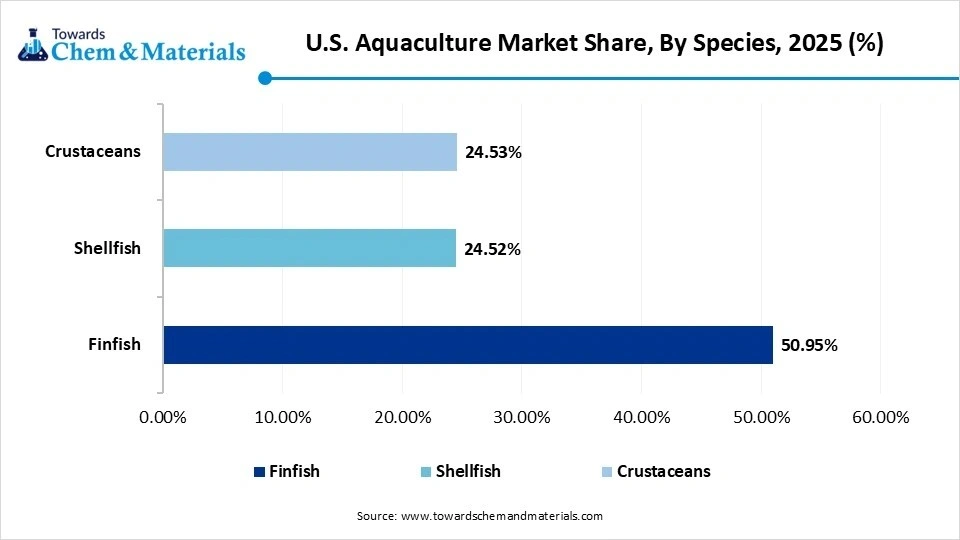
- By species type, the finfish segment dominated the market with a 50.95% industry share in 2025.
- By species type, the shellfish segment is expected to grow at the fastest rate in the market during the forecast period.
- By farming method type, the recirculating aquaculture systems segment dominated the market with 46.00% industry share in 2025.
- By farming method type, the cage culture segment is expected to grow at the fastest rate in the market during the forecast period.
- By feed type, the commercial feed segment dominated the market with 61.00% industry share in 2025.
- By feed type, the natural feed segment is expected to grow at the fastest rate in the market during the forecast period.
- By application type, the human consumption segment dominated the market with a 66.00% industry share in 2025.
- By application type, the pharmaceutical & nutraceutical segment is expected to grow at the fastest rate in the market during the forecast period.
Market Size and Volume Forecast
- Market Estimated Size (2025): USD 80.81 Billion | CAGR (2026–2035): 5.13%
- Market Projected Size (2035): USD 133.22 Billion
- Market Volume (2025): 480,000 Metric Tons | Volume CAGR (2026–2035): 5.11%
- Market Projected Volume (2035): 742,600 Metric Tons
- Market Pricing for 2025:
- Average Manufacturing Price: USD 168,878/MT
- Average Selling Price: USD 168,878/MT
- Pricing CAGR (2025–2035): 5.13%
From Ocean to Table: The Growth of America’s Aquaculture Industry
The U.S. aquaculture market involves the farming of fish, shellfish, and other aquatic organisms under controlled conditions for human consumption, recreational use, or commercial purposes. The sector aims to meet growing seafood demand, ensure sustainable production, and support food security while reducing pressure on wild fish stocks.
Market Outlook:
- Industry Growth Overview: Between 2025 and 2034, the local want fresh seafood and companies want a steady supply, the aquaculture industry has gained major prominence in the region United States. Also, the ongoing investment toward small coastal farms and indoor systems has raised awareness among venture and corporate backers in recent years.
- Sustainability Trends: the major aquaculture brands are actively seen adopting the modern farming practices that save water with lower waste generation in recent years. Also, several feed makers are testing the insect protein to avoid dependence on wild fish, which is anticipated to increase return on investment for manufacturers.
- Global Expansion: the aquaculture brands of the United States have seen under the export of seaweed ingredients, premium shellfish, and branded smoke products across the globe. Moreover, the foreign partners are also showing interest in the investment in the United States' aquaculture while creating strategic collaborations.
Report Scope
| Report Attributes | Details |
| Market Size and Volume in 2026 | USD 84.98 Billion / 504,000 Metric Tons |
| Expected Size and Volume by 2035 | USD 133.22 Billion/ 742,600 Metric Tons |
| Growth Rate from 2025 to 2035 | CAGR 5.13 % |
| Base Year of Estimation | 2025 |
| Forecast Period | 2025 - 2035 |
| Segment Covered | By Species, By Farming Method, By Feed Type, By Application |
| Key Companies Profiled | Atlantic Sapphire, Cargill Aqua Nutrition , Greensea Systems , Hendrix Genetics , Clearwater Seafoods , Tassal Group , Skretting USA , Blue Ridge Aquaculture , Ocean Spray Aquaculture , Zeigler Bros., Inc. |
From Nets to Networks: The Digital Transformation of Aquaculture
The technology has played a major role in the transformation of the aquaculture industry in the United States. The modern farmers are actively observed in the adoption of smart feeders, indoor recirculating systems, and other advanced products like water sensors and others. Furthermore, the increasing shift towards microbiome management has been widely discussed in technological forums and white papers in recent years.
Trade Analysis of the U.S. Aquaculture Market:
- Import, Export, Consumption, and Production Statistics : The United States aquaculture export touched $4.9 billion in 2024, as per the published report.(Source : www.ers.usda.gov)
- The sales of aquaculture products in the United States are approximately worth $1.964 billion in 2024.(Source: www.ers.usda.gov)
Value Chain Analysis of the U.S. Aquaculture Market:
- Distribution to Industrial Users : For the U.S. aquaculture market, industrial users primarily acquire products through wholesalers, large-scale distributors, direct sales from large producers, and specialized ingredient suppliers
- Chemical Synthesis and Processing : In the market, chemical synthesis and processing involve a broad array of specialized products and techniques used to ensure biosecurity, manage water quality, enhance nutrition, and control disease.
- Regulatory Compliance and Safety Monitoring : Federal and state agencies work together to regulate the market, with a focus on safety, environmental protection, and animal health.
U.S. Aquaculture Market Regulatory Landscape: Global Regulations
| Country / Region | Regulatory Body | Key Regulations | Focus Areas | Notable Notes |
| United States | Food and Drug Administration (FDA) | Food, Drug, and Cosmetic Act (FFDCA) | Food Safety | The agency governs the safety of food, drugs, and feed additives used in aquaculture. |
Segmental Insights
Species Insights
How did the Finfish Segment Dominate the U.S. Aquaculture Market in 2025?
The finfish segment dominated the market with 50.95% of industry share in 2025 due to it being considered the most farmed and traditional seafood. Moreover, species such as the catfish, trout, and salmon have gained greater local demand while establishing the farming system in the United States in recent years. Also, the farmers have gained advantages of the advanced hatchery technology and strong cold water farming infrastructure in the past few years.
The shellfish segment is expected to grow at a notable rate owing to it includes in the eco-friendly aquaculture initiatives. Moreover, having a high protein index, the shellfish have gained a sophisticated consumer base in recent years. Also, several farmers are shifting towards shellfish farming, aiming to improve water quality and meet the increasing food requirements in the region nowadays.
U.S. Aquaculture Market Share, By Species, 2025(%)
| By Species | Revenue Share, 2025 (%) |
| Finfish | 50.95% |
| Shellfish | 24.52% |
| Crustaceans | 24.53% |
- Finfish: Holding the largest share of 50.95%, finfish dominate the U.S. aquaculture market, including species like salmon, trout, and tilapia, which are widely farmed for both domestic consumption and export.
- Shellfish: Representing 24.52% of the market, shellfish such as oysters, clams, and mussels are a significant part of aquaculture, prized for their culinary value and ecological benefits in water filtration.
- Crustaceans: Accounting for 24.53% of the market, crustaceans like shrimp and lobsters are also crucial to the U.S. aquaculture industry, catering to both local and international demand in seafood markets.
Farming Method Insights
Why does the Recirculating Aquaculture Systems Segment Dominate the U.S. Aquaculture Market by Farming Method?
The recirculating aquaculture systems segment dominated the market with 46.00% industry share in 2025. By allowing farming in controlled indoor environments, the recirculating aquaculture system has gained major industry attention in the past few years. Moreover, the factors like minimal water use and high biosecurity are driving the growth of the segment in the current period as aqua farmers are seeking to small areas with greater income farming initiatives in the region.
The cage culture segment is expected to grow at a notable rate because it offers lower costs, easier scalability, and high production potential in open water areas. Advancements in durable cages, offshore farming, and feeding systems make this method more efficient and sustainable than before. As coastal regions explore ocean farming, cage culture allows large-scale fish production with less land and infrastructure. It also supports species diversification, including high-value fish like cobia and sea bass.
U.S. Aquaculture Market Share, By Farming Method, 2025(%)
| By Farming Method | Revenue Share, 2025 (%) |
| Recirculating Aquaculture Systems (RAS) | 46.00% |
| Cage Culture | 20.00% |
| Pond Culture | 18.00% |
| Flow-Through Systems | 16.00% |
- Recirculating Aquaculture Systems (RAS): Leading the market with 46% of the share, Recirculating Aquaculture Systems (RAS) are highly efficient, land-based systems that filter and reuse water, making them popular for sustainable fish farming in controlled environments.
- Cage Culture: Representing 20% of the market, cage culture involves farming fish in floating enclosures, typically in open water such as lakes or oceans, allowing for large-scale operations in natural water bodies.
- Pond Culture: Accounting for 18% of the market, pond culture is a traditional farming method that involves raising fish in controlled ponds, typically used for freshwater species like catfish and tilapia.
- Flow-Through Systems: Contributing 16% to the market, flow-through systems involve the continuous movement of water through fish tanks or raceways, providing a natural environment for fish while helping to maintain water quality.
Feed Type Insights
How did the Commercial Feed Segment Dominate the U.S. Aquaculture Market in 2025?
The commercial feed segment dominated the market with 61.00% of industry share in 2025 because it provides balanced nutrition, faster growth, and consistent product quality. Farmers rely on scientifically formulated pellets that include proteins, vitamins, and minerals for specific fish species. Commercial feeds save time, ensure uniform size, and help improve disease resistance. United States feed producers also focus on reducing waste and improving feed conversion rates.
The natural feed segment is expected to grow at a notable rate because consumers increasingly prefer organic and chemical-free seafood. Farmers are turning to eco-friendly feeding methods using algae, insects, and plant-based proteins. These natural feeds improve fish health and reduce pollution from uneaten pellets. As awareness about sustainable seafood rises, certification programs for "naturally fed fish" will become more popular in the United States market.
U.S. Aquaculture Market Share, By Feed Type, 2025(%)
| By Feed Type | Revenue Share, 2025 (%) |
| Commercial Feed | 61.00% |
| Natural Feed | 39.00% |
- Commercial Feed: Dominating the market with 61% of the share, commercial feed is the most commonly used type, consisting of specially formulated diets that provide the essential nutrients required for optimal growth and health of farmed aquatic species.
- Natural Feed: Accounting for 39% of the market, natural feed includes organic materials such as plankton, algae, or other naturally occurring organisms, often used in more sustainable or environmentally friendly aquaculture operations.
Application Insights
Why does the Human Consumption Segment Dominate the U.S. Aquaculture Market by Application Type?
The human consumption segment dominated the market with a 66.00 industry share in 2025 because seafood is a staple part of the American diet. People are eating more fish for its high protein and heart-healthy benefits. Restaurants, supermarkets, and meal delivery services all depend on a steady supply of farmed fish and shellfish. The push for locally grown, fresh, and traceable seafood also supports domestic aquaculture.
The pharmaceuticals and nutraceuticals segment is expected to grow at a notable rate as people look for natural health supplements from marine sources. Fish oils, collagen, and shellfish extracts are now used in medicines, beauty products, and dietary supplements. These products have high profit margins and growing demand in health-conscious markets.
U.S. Aquaculture Market Share,By Application, 2025(%)
| By Application | Revenue Share, 2025 (%) |
| Human Consumption | 66.00% |
| Pharmaceuticals & Nutraceuticals | 18.00% |
| Ornamental & Recreational | 16.00% |
- Human Consumption: Holding the largest share of 66%, the human consumption segment dominates the U.S. aquaculture market, with farmed aquatic species like fish, shellfish, and crustaceans being harvested for food products.
- Pharmaceuticals & Nutraceuticals: Representing 18% of the market, aquaculture products are increasingly used in the pharmaceutical and nutraceutical industries for their health benefits, such as omega-3 fatty acids and other bioactive compounds.
- Ornamental & Recreational: Accounting for 16% of the market, ornamental and recreational aquaculture includes the farming of fish and other aquatic species for the pet and aquarium industries, as well as for recreational purposes.
Recent Development
- In September 2025, Innovasea established a collaboration with the Andrew J Young Foundation. The main motive of the collaboration is to launch RAS facilities in the United States region, as per the published report.(Source: www.seafoodsource.com)
Top U.S. Aquaculture Market companies
Mowi ASA
Corporate Information
- Headquarters: Sandviksboder 77 AB, 5035 Bergen, Norway.
- Year Founded: 1964 (original company)
- Ownership Type: Public company
History and Background
- The company traces its roots back to 1964 when a small pioneering fish-farming operation started near Bergen in Norway.
- Over the decades, multiple mergers and acquisitions reshaped the business: for example the merging of Pan Fish ASA, Marine Harvest N.V. and Fjord Seafood around 2006-2007 created a large salmon-farming group.
- In December 2018 the company changed its name from Marine Harvest ASA to Mowi ASA, with the new ticker “MOWI” becoming effective 2 January 2019.
Key Developments and Strategic Initiatives
Mergers & Acquisitions
- In January 2025 Mowi announced it would increase its ownership of Nova Sea AS (Norway) from 49% to 95% by acquiring Vigner Olaisen’s 46% stake for ~NOK 7.4 billion (~EUR 625 m).
- In October 2025 Mowi’s acquisition of Nova Sea received full regulatory approval (EU Commission + Norwegian competition authority).
Partnerships & Collaborations
- Mowi collaborated with X (company) (Alphabet’s moonshot / innovation engine) via its “Tidal” ocean tech unit, to deploy an underwater sensing and software analysis platform for salmon farming (tracking fish behaviour, lice counts, feeding optimisation).
- Mowi extended/renewed a global framework agreement with Innovasea to become the preferred supplier of environmental monitoring systems and software across all Mowi sites, as part of its “Smart Farming / 4.0” initiative.
Product Launches / Innovations
- In the U.S. food-service market Mowi launched the MOWI Signature program (May 2025) a line of premium Atlantic salmon tailored for foodservice operators/chefs, with fixed-price programs, ready-to-prep fillets, pre-cut portions sourced from Norway/Scotland.
- In retail/consumer markets, Mowi launched new items such as “Fjord Salmon Burgers” (frozen ready-to-cook) in May 2025 and expanded its pre-packed fresh portion range (pre-seasoned, flavoured butter pucks, etc).
Key Technology Focus Areas
Smart Farming & Digitalization
- Mowi has launched its “Mowi 4.0 Smart Farming” initiative: implementation of remote operations centres, real-time monitoring of biomass, automatic feeding, advanced sensors in seawater pens.
- Their MOWInsight data platform integrates multiple data streams (farm, feed, processing) enabling data-driven decisions across the value chain.
Notable Technological Collaborations & Deployments
- Collaboration with X (company) (Alphabet’s “moonshot” division) via its “Tidal” project: sensors, cameras, machine-learning for growth, lice counting, fish behaviour monitoring.
- Renewed global framework with Innovasea for environmental monitoring systems across Mowi farms.
R&D Organisation & Investment
- Mowi maintains a dedicated Global R&D & Technical Department of ~17 full-time experts covering marine biology, fish health, nutrition, data science, engineering, veterinary medicine supporting innovation across the entire value chain.
- R&D expenditure in 2023 was €35.3 million, essentially flat vs 2022 (~€35.0m).
Mowi ASA SWOT Analysis
Strengths
- Global Leadership in Salmon Farming
- One of the largest salmon producers worldwide with operations in Norway, Scotland, Canada, Chile, and the U.S.
- Vertically integrated across the value chain (hatcheries → farming → processing → distribution).
- Technological and R&D Capabilities
- Strong focus on Smart Farming (Mowi 4.0), digitalisation, sensors, AI-based monitoring.
- Advanced R&D in genetics, fish health, and sustainable feed.
Weaknesses
- High Operational Costs
- Vertical integration and global operations increase fixed costs.
- High capital expenditure for R&D, post-smolt facilities, and technological upgrades.
- Exposure to Biological Risks
- Disease outbreaks (e.g., sea lice, ISA) can impact production.
- Dependence on Atlantic salmon species limits diversification.
Opportunities
- Expansion in the U.S. and Asia-Pacific Markets
- Growing seafood demand, especially premium salmon in foodservice and retail.
- Technological Innovation & Smart Farming
- Digital monitoring, RAS systems, AI, and precision farming can improve efficiency and reduce environmental impact.
Threats
- Environmental and Climate Risks
- Ocean warming, algal blooms, and extreme weather events threaten fish farms.
- Rising water temperatures may affect salmon growth and health.
- Competition
- Other major players like Cooke Aquaculture, Atlantic Sapphire, and Benchmark and Holdings increase competitive pressure.
Recent News & Strategic Updates
- Record Financial Performance in 2024 :Mowi concluded 2024 with record-high operating revenues of €5.62 billion and a harvest volume of 502,000 tonnes of salmon. The fourth quarter alone saw revenues of €1.50 billion and an operational profit of €226 million, marking a significant achievement for the company.
- Acquisition of Nova Sea Approved : On October 21, 2025, Mowi received final approval from both the EU Commission and the Norwegian competition authority to acquire a controlling 95% stake in Nova Sea AS. This move is expected to increase Mowi's global harvest to 597,000 tonnes in 2025, with 161,000 tonnes coming from Northern Norway, a prime region for Atlantic salmon farming.
- Strategic Review of Feed Division :In March 2025, Mowi initiated a strategic review of its integrated Feed division, which generated €1.12 billion in operating revenues in 2024. The review will assess all available options, including a potential sale, to streamline operations and optimize capital allocation.
Top Vendors in the U.S. Aquaculture Market & Their Offerings:
- Cooke Aquaculture Inc: A vertically integrated, family-owned Canadian multinational that is a global leader in salmon farming and has diverse seafood operations.
- Benchmark Holdings PLC: A UK-based aquaculture biotechnology company that provides technical services.
- American Aquafarms: An American-based company that plans to build a large-scale, closed-pen salmon farm in coastal Maine.
- Regal Springs Tilapia: The world's largest producer of responsibly farmed premium tilapia, known for its sustainable practices and vertically integrated operations.
Other Key Players
- Atlantic Sapphire
- Cargill Aqua Nutrition
- Greensea Systems
- Hendrix Genetics
- Clearwater Seafoods
- Tassal Group
- Skretting USA
- Blue Ridge Aquaculture
- Ocean Spray Aquaculture
- Zeigler Bros., Inc.
Segments Covered in the Report
By Species
- Finfish
-
- Salmon
- Trout
- Catfish
-
- Shellfish
-
- Shrimp
- Oysters
- Mussels
-
- Crustaceans
-
- Lobster
- Crabs
-
By Farming Method
- Recirculating Aquaculture Systems (RAS)
- Cage Culture
- Pond Culture
- Flow-Through Systems
By Feed Type
- Commercial Feed
- Natural Feed
By Application
- Human Consumption
- Pharmaceuticals & Nutraceuticals
- Ornamental & Recreational
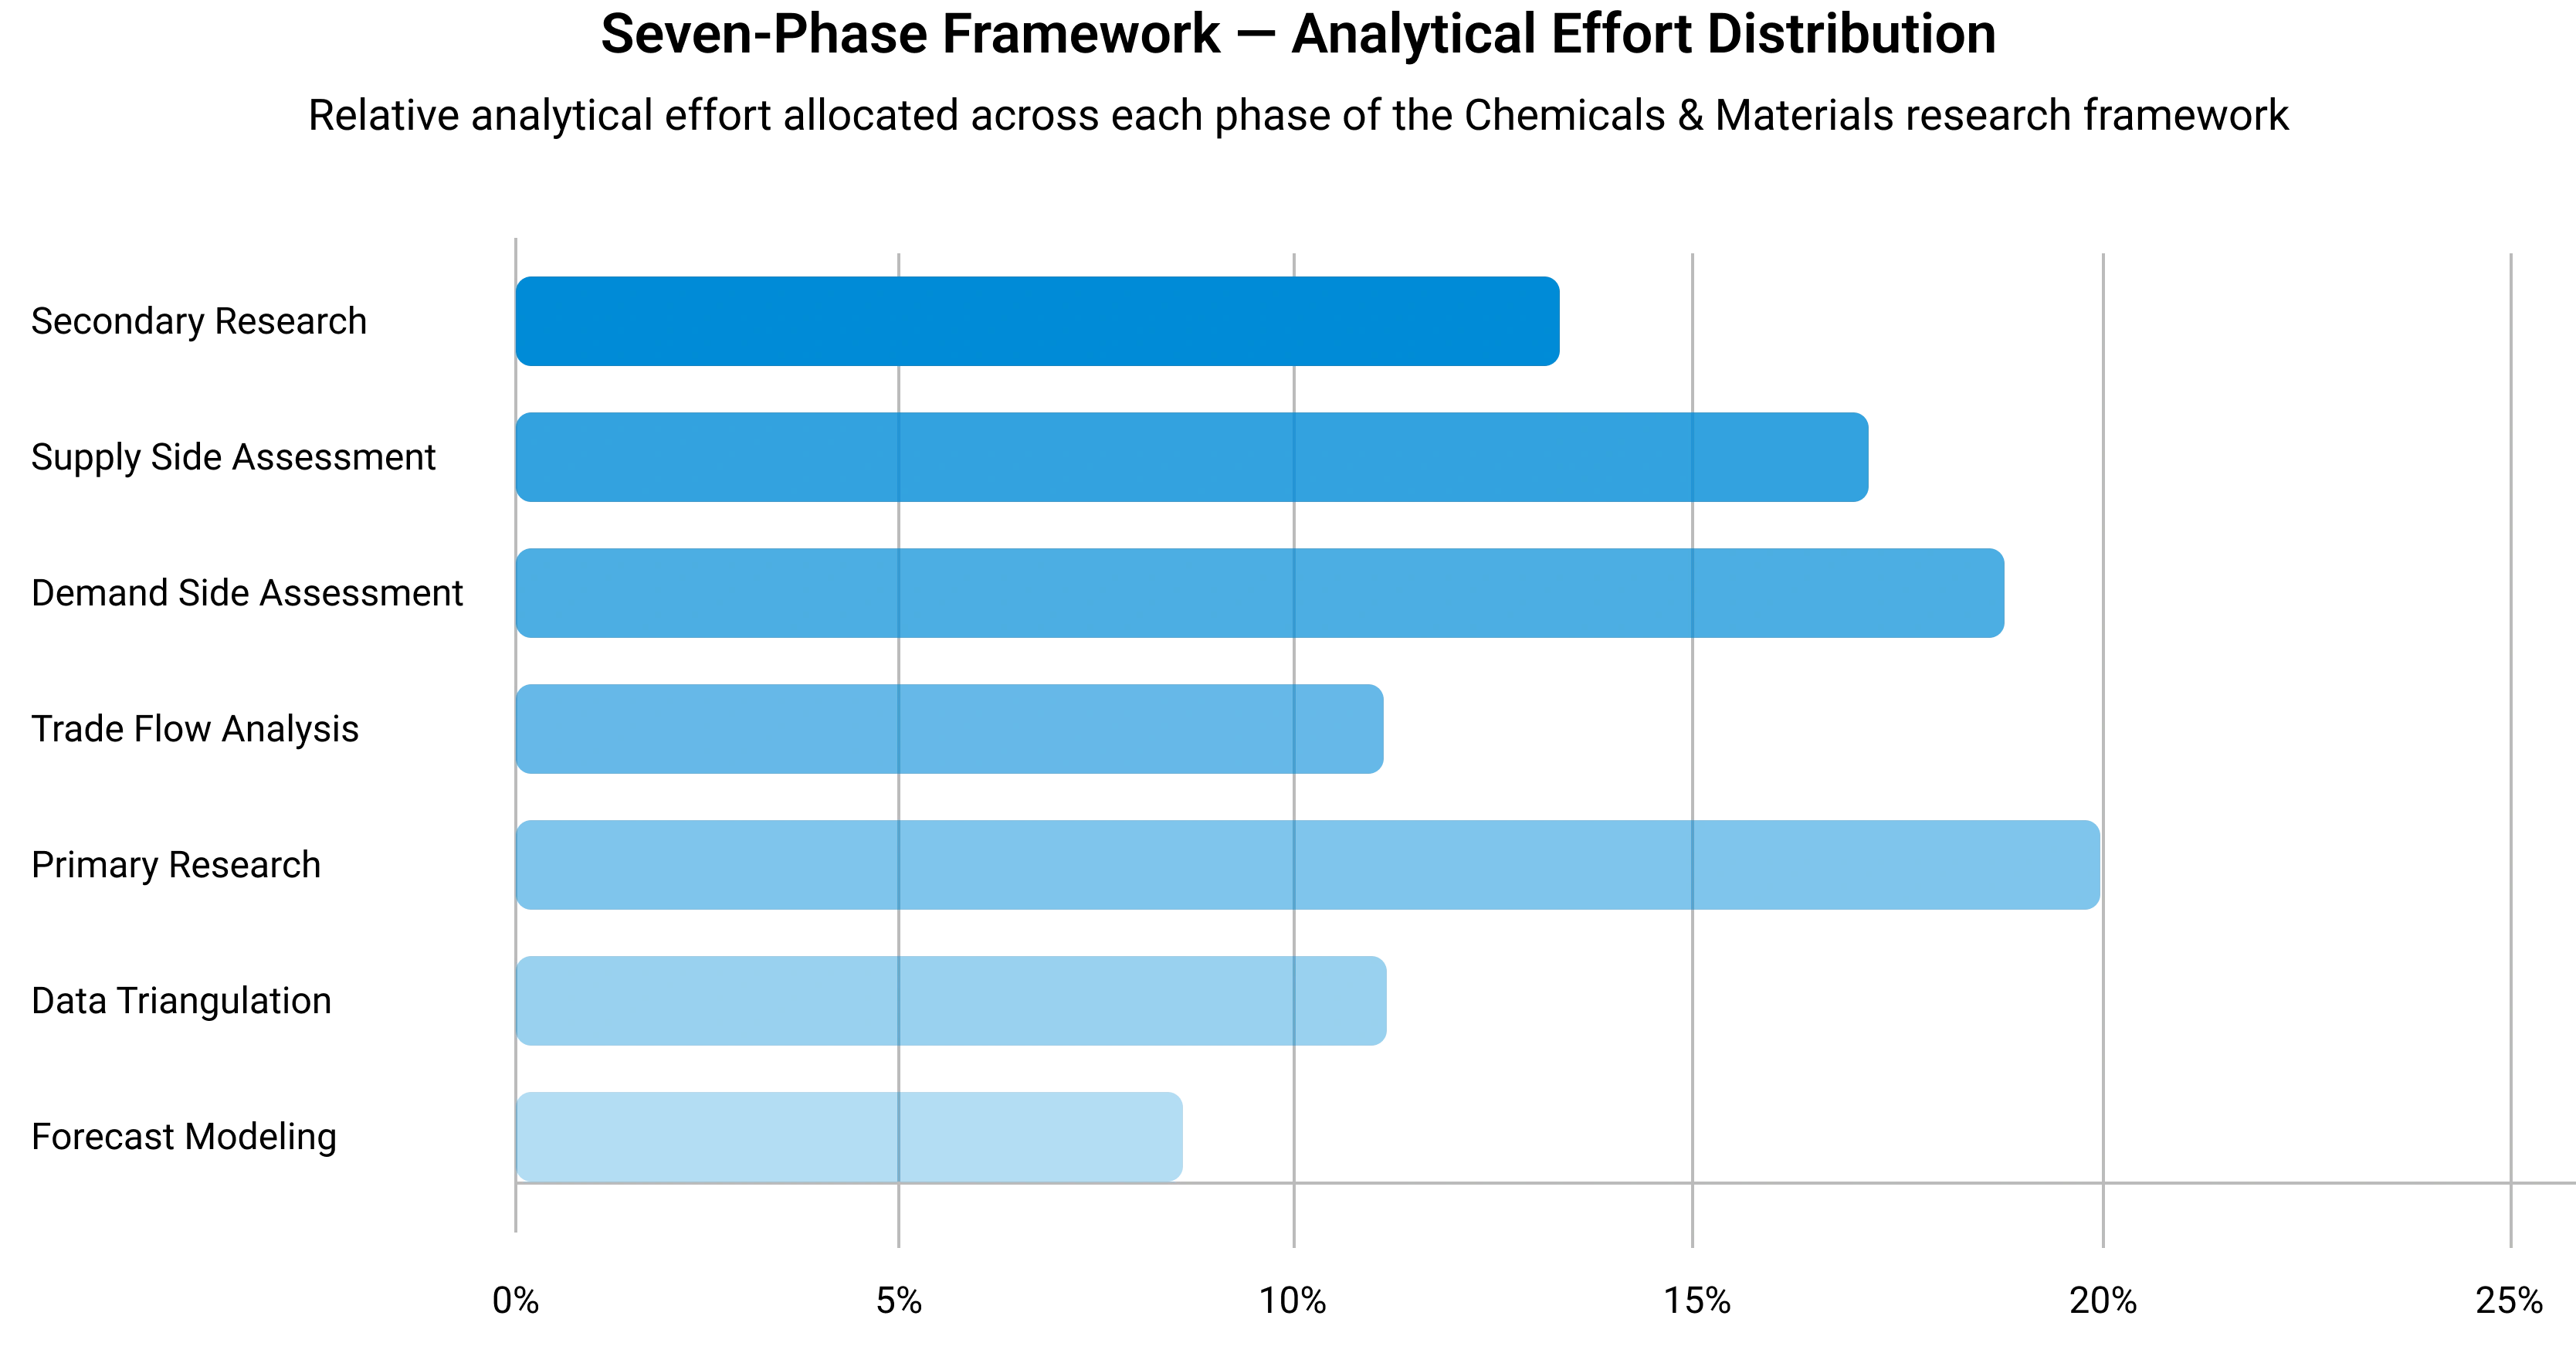
A Seven-Phase Framework
Our methodology is designed to be universally applicable across commodity chemicals, specialty chemicals, petrochemicals, construction chemicals, coatings, electronic chemicals, industrial gases, agrochemicals, water treatment chemicals, and performance materials. Each phase builds upon the last, creating a layered validation structure that minimizes estimation error and maximizes analytical confidence.
The framework ensures comprehensive market coverage, robust cross-validation, and reliable long-term forecasting — producing market estimates that withstand scrutiny from investors, regulators, and corporate strategy teams.

Seven-Phase Framework — Analytical Effort Distribution
Relative analytical effort allocated across each phase of the Chemicals & Materials research framework
Phase 1 - Secondary Research: Establishing the Foundation
Secondary research collects and evaluates publicly available information from authoritative sources, establishing the foundational understanding of market structure, value chain dynamics, competitive landscape, and end-use demand patterns. Every source is evaluated for credibility, recency, geographic relevance, and methodological soundness before inclusion.
Industry Associations
Sources include ACC, CEFIC, ICCA, JCIA, CPCIF, and SOCMA providing production volumes, consumption trends, capacity developments, and sustainability initiatives.
Company Disclosures
Annual reports, investor presentations, earnings transcripts, and regulatory filings reveal product portfolios, manufacturing footprints, capacity expansions, and revenue segmentation.
Government Databases
National statistical offices, customs authorities, environmental agencies, and industrial production databases provide verified statistics on output, trade flows, and regulatory compliance.
Trade Databases
UN Comtrade, ITC, Eurostat, and national customs authorities enable assessment of global product movement, import dependency, and export competitiveness across regions.
Our Secondary Research Sources
- Ministry of Chemicals and Fertilizers
- European Chemicals Agency
- United States Department of Energy
- Ministry of Industry and Information Technology
- Ministry of Economy Trade and Industry
- Ministry of Trade Industry and Energy
- National Institute of Standards and Technology
- Council of Scientific and Industrial Research
- Fraunhofer Society
- National Institute for Materials Science
Phase 2 — Supply-Side Assessment: Mapping Production Capabilities
Production Capacity Analysis
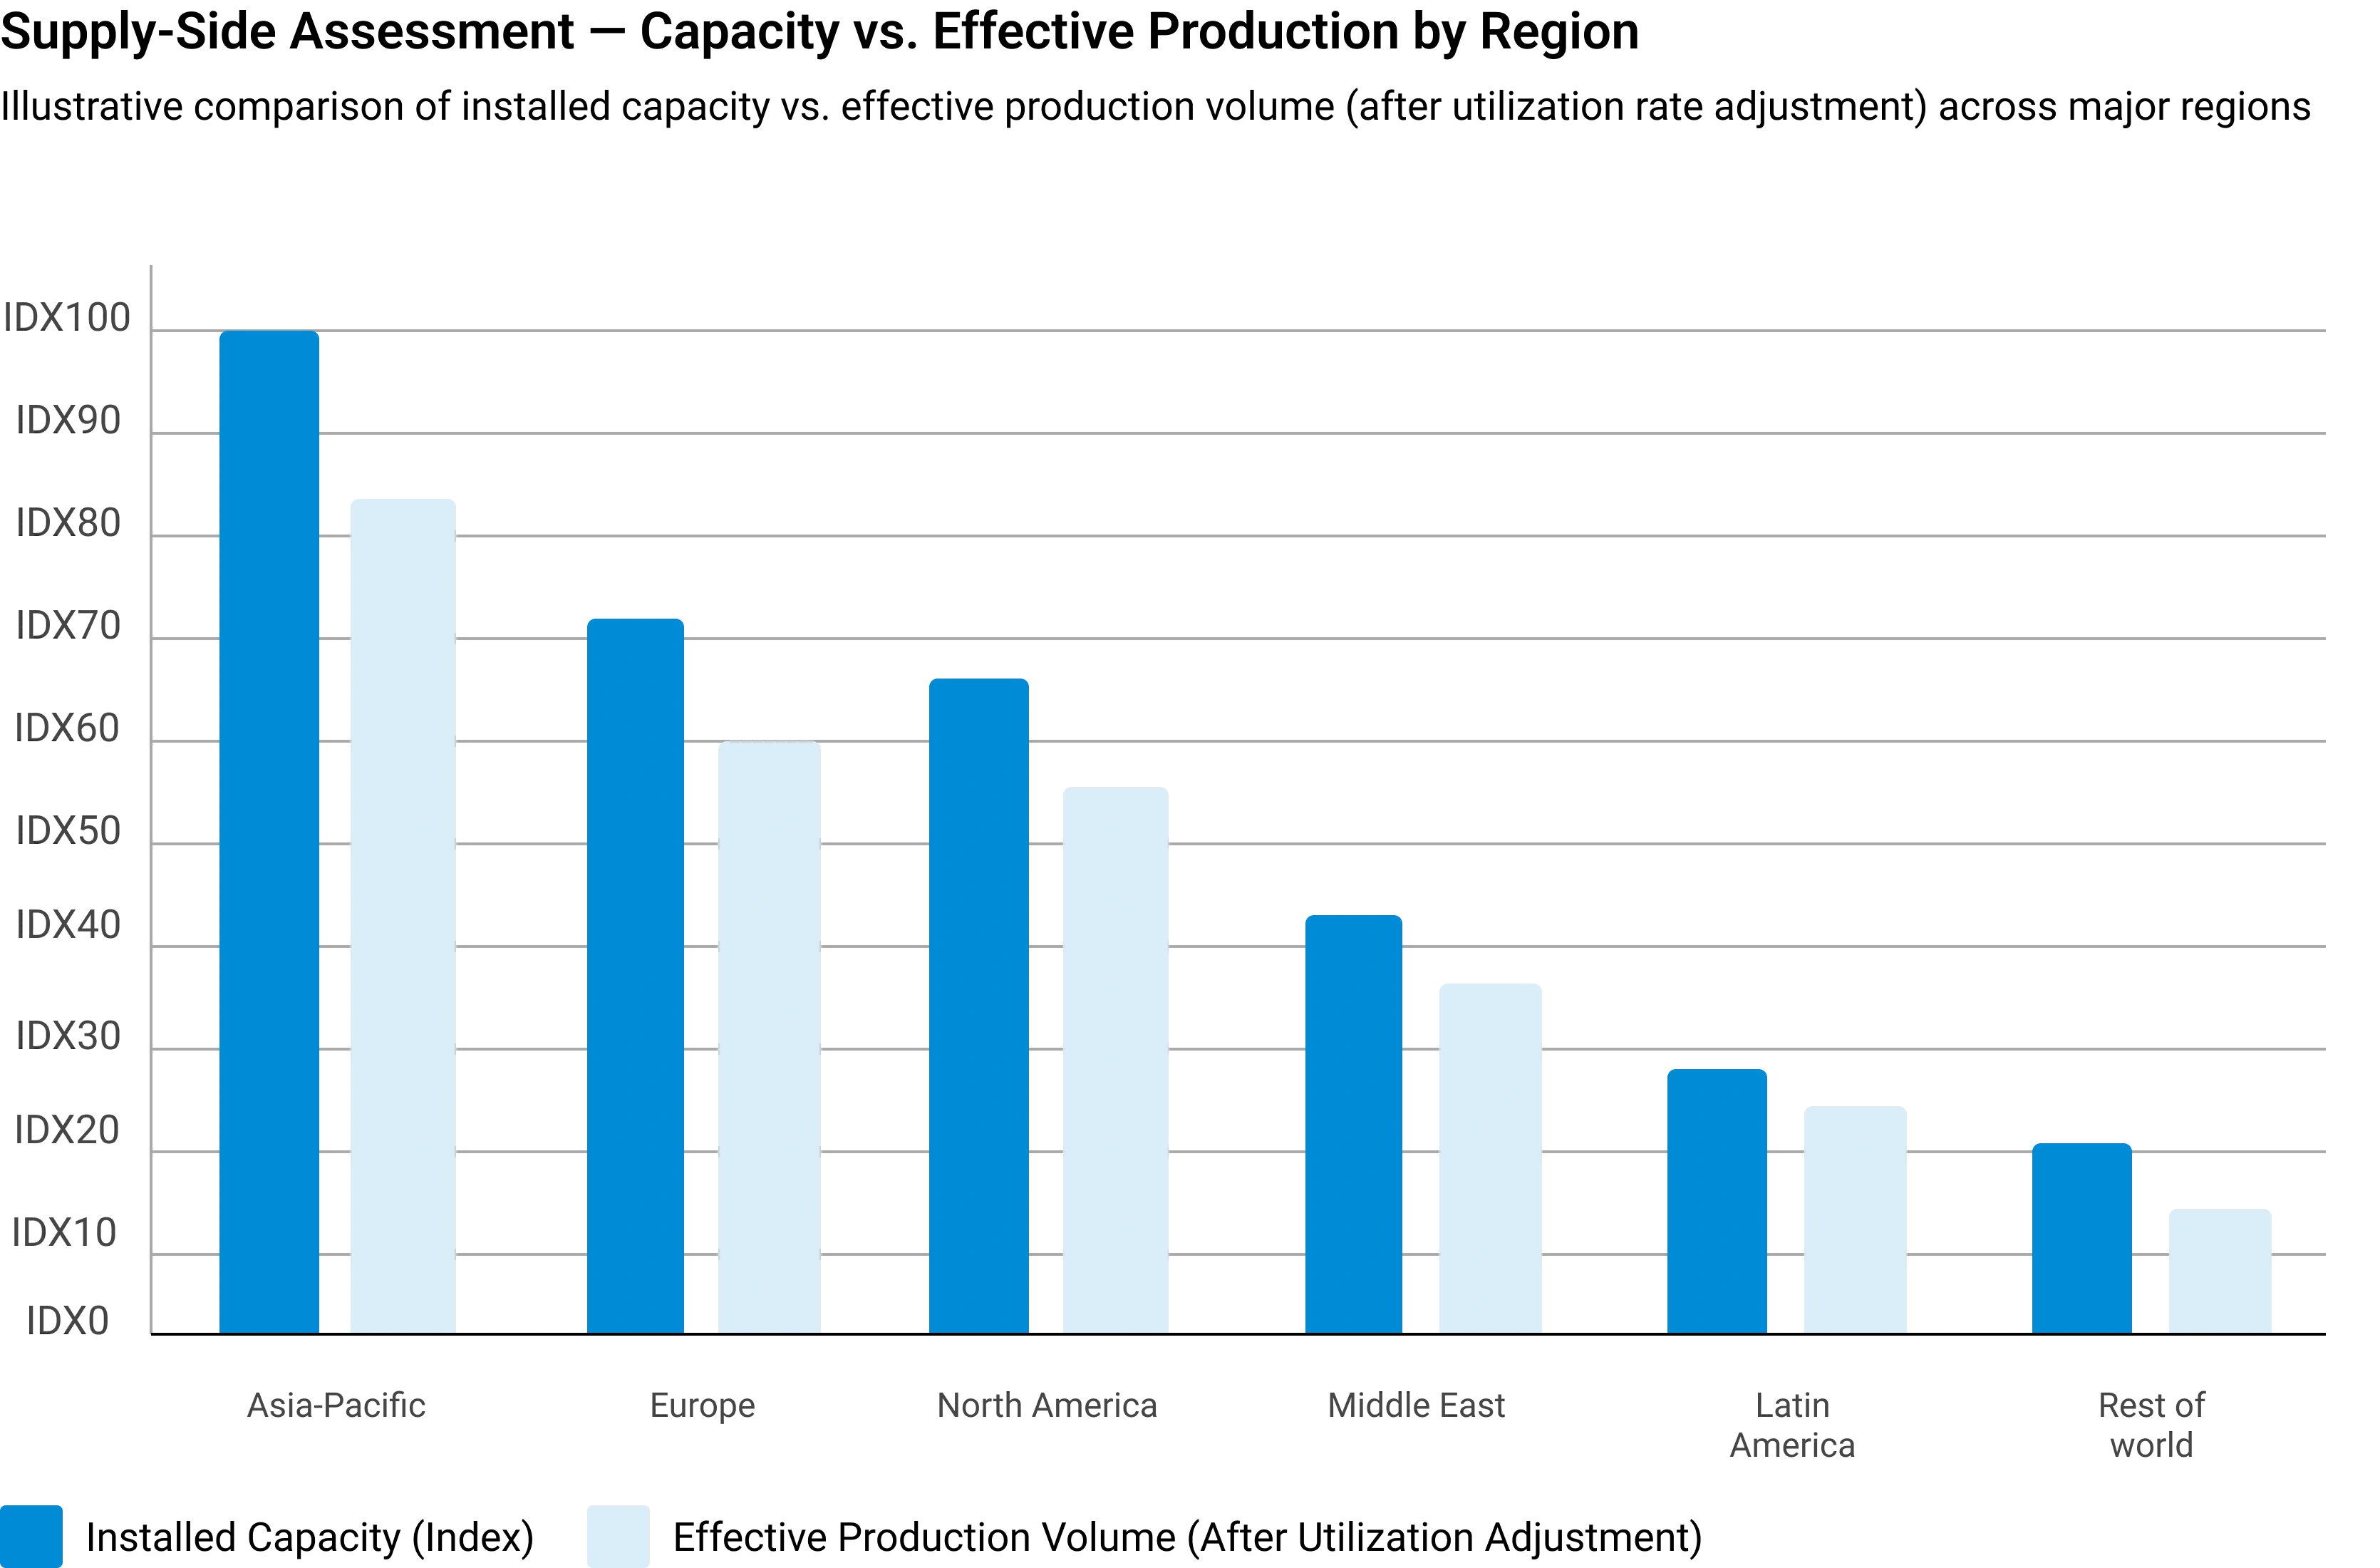
All major manufacturers are assessed for existing installed capacity, planned additions, expansions, new plant announcements, and technology adoption — mapped at global, regional, and country levels.
Capacity Utilization Adjustment
Installed capacity is adjusted using utilization rates based on demand conditions, feedstock availability, plant operating rates, maintenance schedules, and regulatory restrictions.
Manufacturer Revenue Analysis
Product-specific revenues, segment-level performance, regional distribution, average selling prices, and margin trends are evaluated to establish market value estimates.
Supply-Side Assessment — Capacity vs. Effective Production by Region
Illustrative comparison of installed capacity vs. effective production volume (after utilization rate adjustment) across major regions
Phase 3 — Demand-Side Assessment: Quantifying Chemical Consumption
Demand-side analysis quantifies chemical consumption across industries, applications, and geographies — identifying where and how chemicals are consumed throughout the value chain with precision.
End-Use Industry Analysis
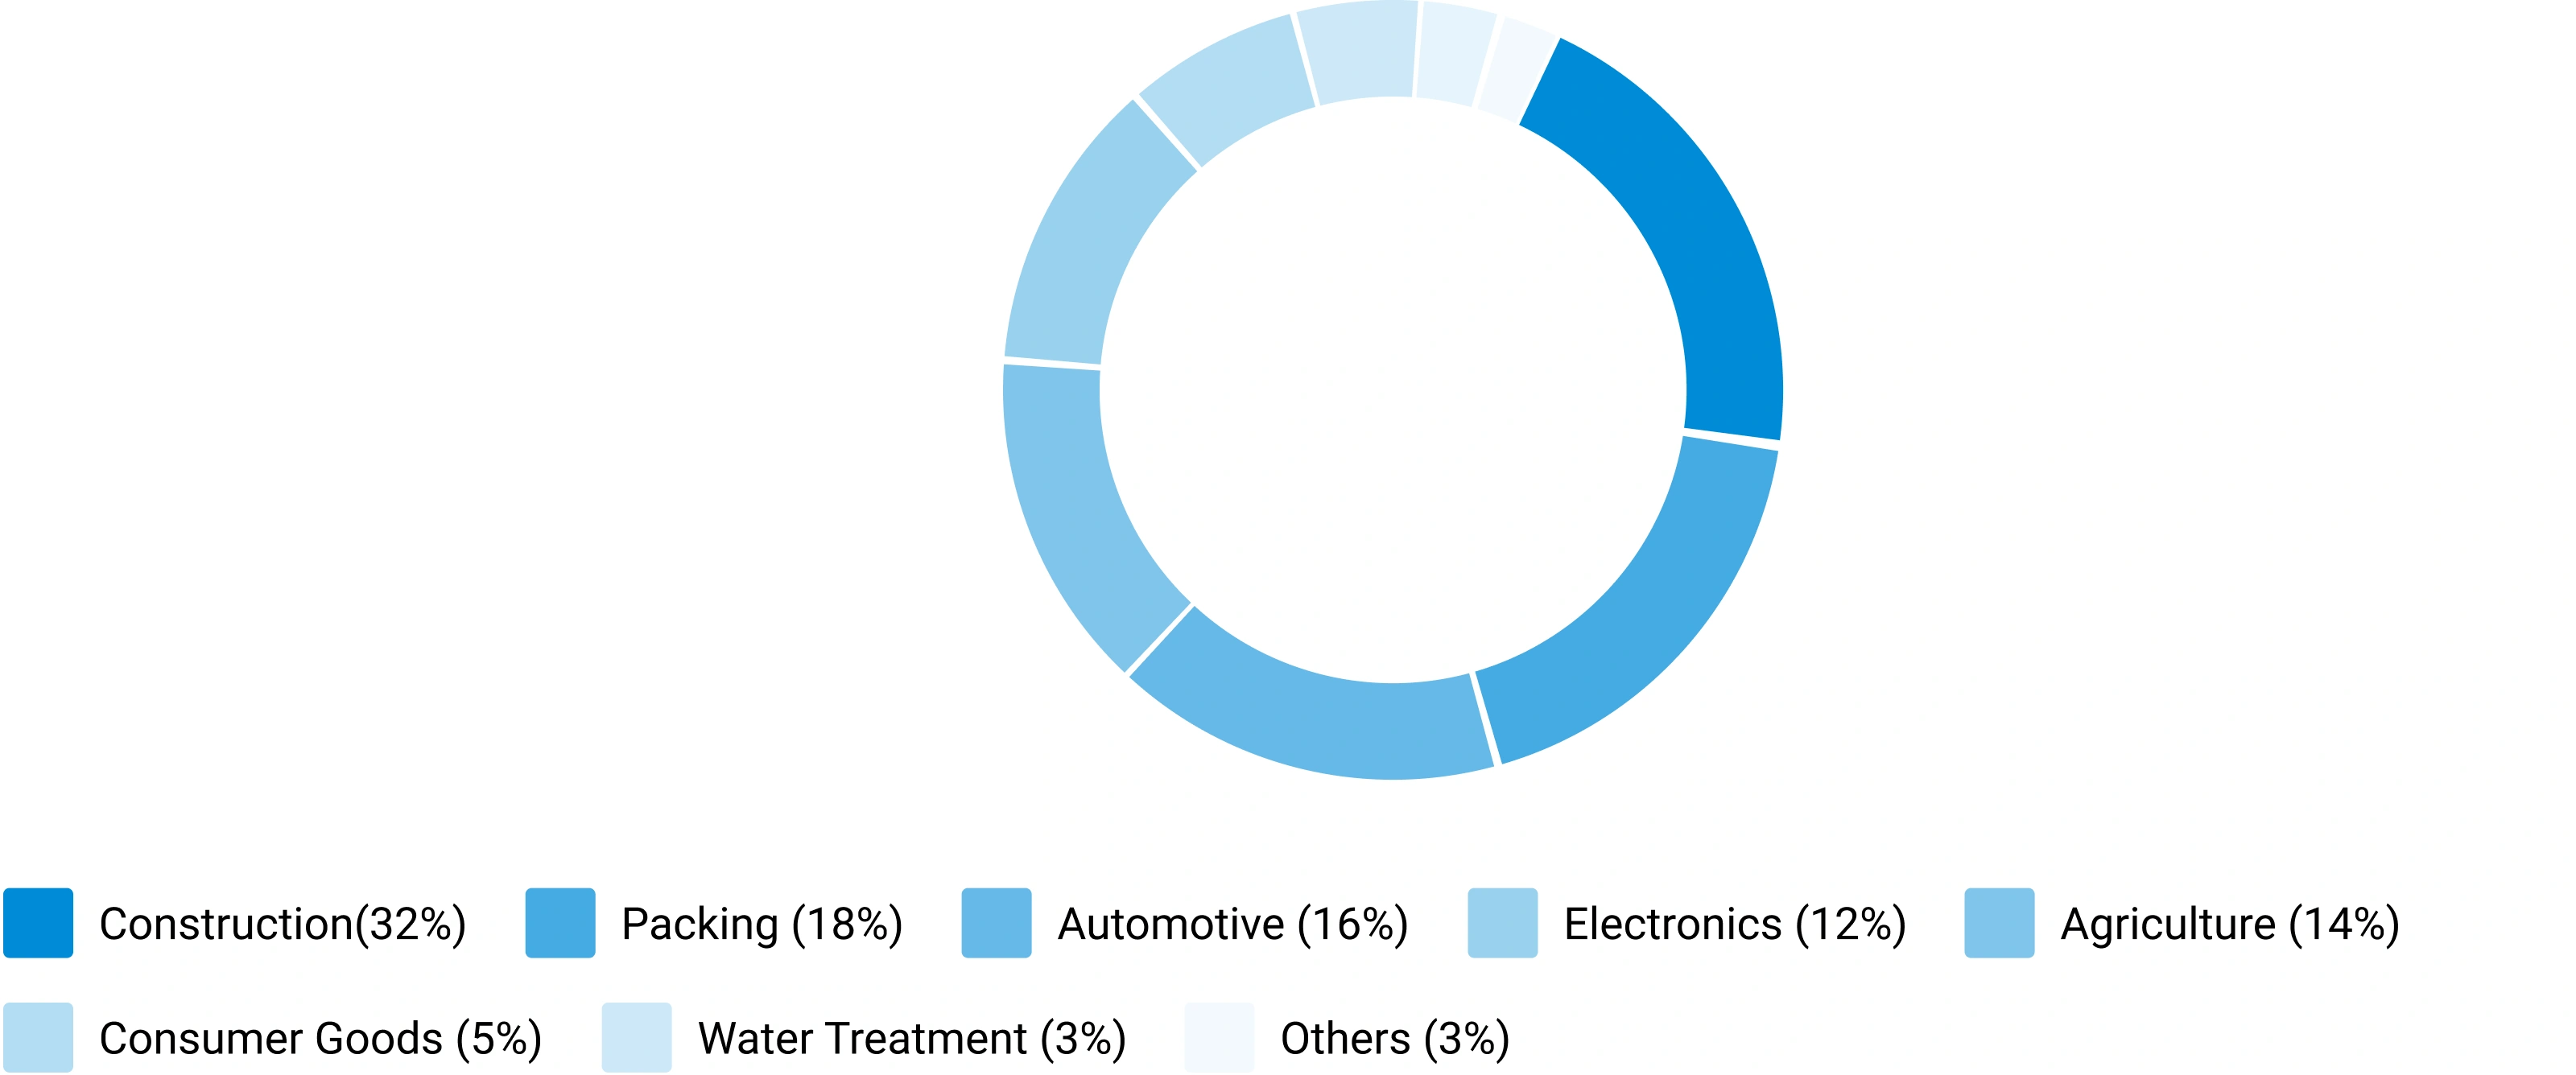
Chemical demand is evaluated across automotive, construction, packaging, electronics, agriculture, healthcare, consumer goods, industrial manufacturing, energy and utilities, and water treatment. Industry output, production trends, and consumption intensity are analyzed to determine demand patterns.
Consumption Modeling
Demand is estimated using measurable indicators: kilograms per vehicle, kilograms per square meter of construction, dosage per cubic meter of water treated, kilograms per hectare of agricultural land, and kilograms per ton of manufactured products. Consumption factors are validated through industry publications and primary interviews.
Application Analysis
The market is segmented by application area to understand product performance requirements, formulation trends, technology adoption, customer preferences, and regulatory requirements improving demand accuracy and segmentation granularity.
Demand-Side Assessment — End-Use Industry Demand Distribution
Illustrative distribution of chemical & materials demand across key end-use industries
Phase 4 - Trade Flow Analysis: Balancing Regional Supply and Demand
Trade flow analysis reconciles regional supply and demand estimates through import and export data, identifying net supply positions, regional dependencies, and market imbalances. It serves as an independent validation layer that tests the consistency of supply-side and demand-side estimates.
Import Analysis
Import data is evaluated to determine volumes, source countries, product dependency, regional supply gaps, and pricing trends — identifying markets that rely heavily on external supply and where domestic production is insufficient to meet demand.
Export Analysis
Export assessments reveal production surplus, export competitiveness, regional manufacturing strength, and global market participation. Export patterns also help validate domestic production estimates and identify net exporting regions.
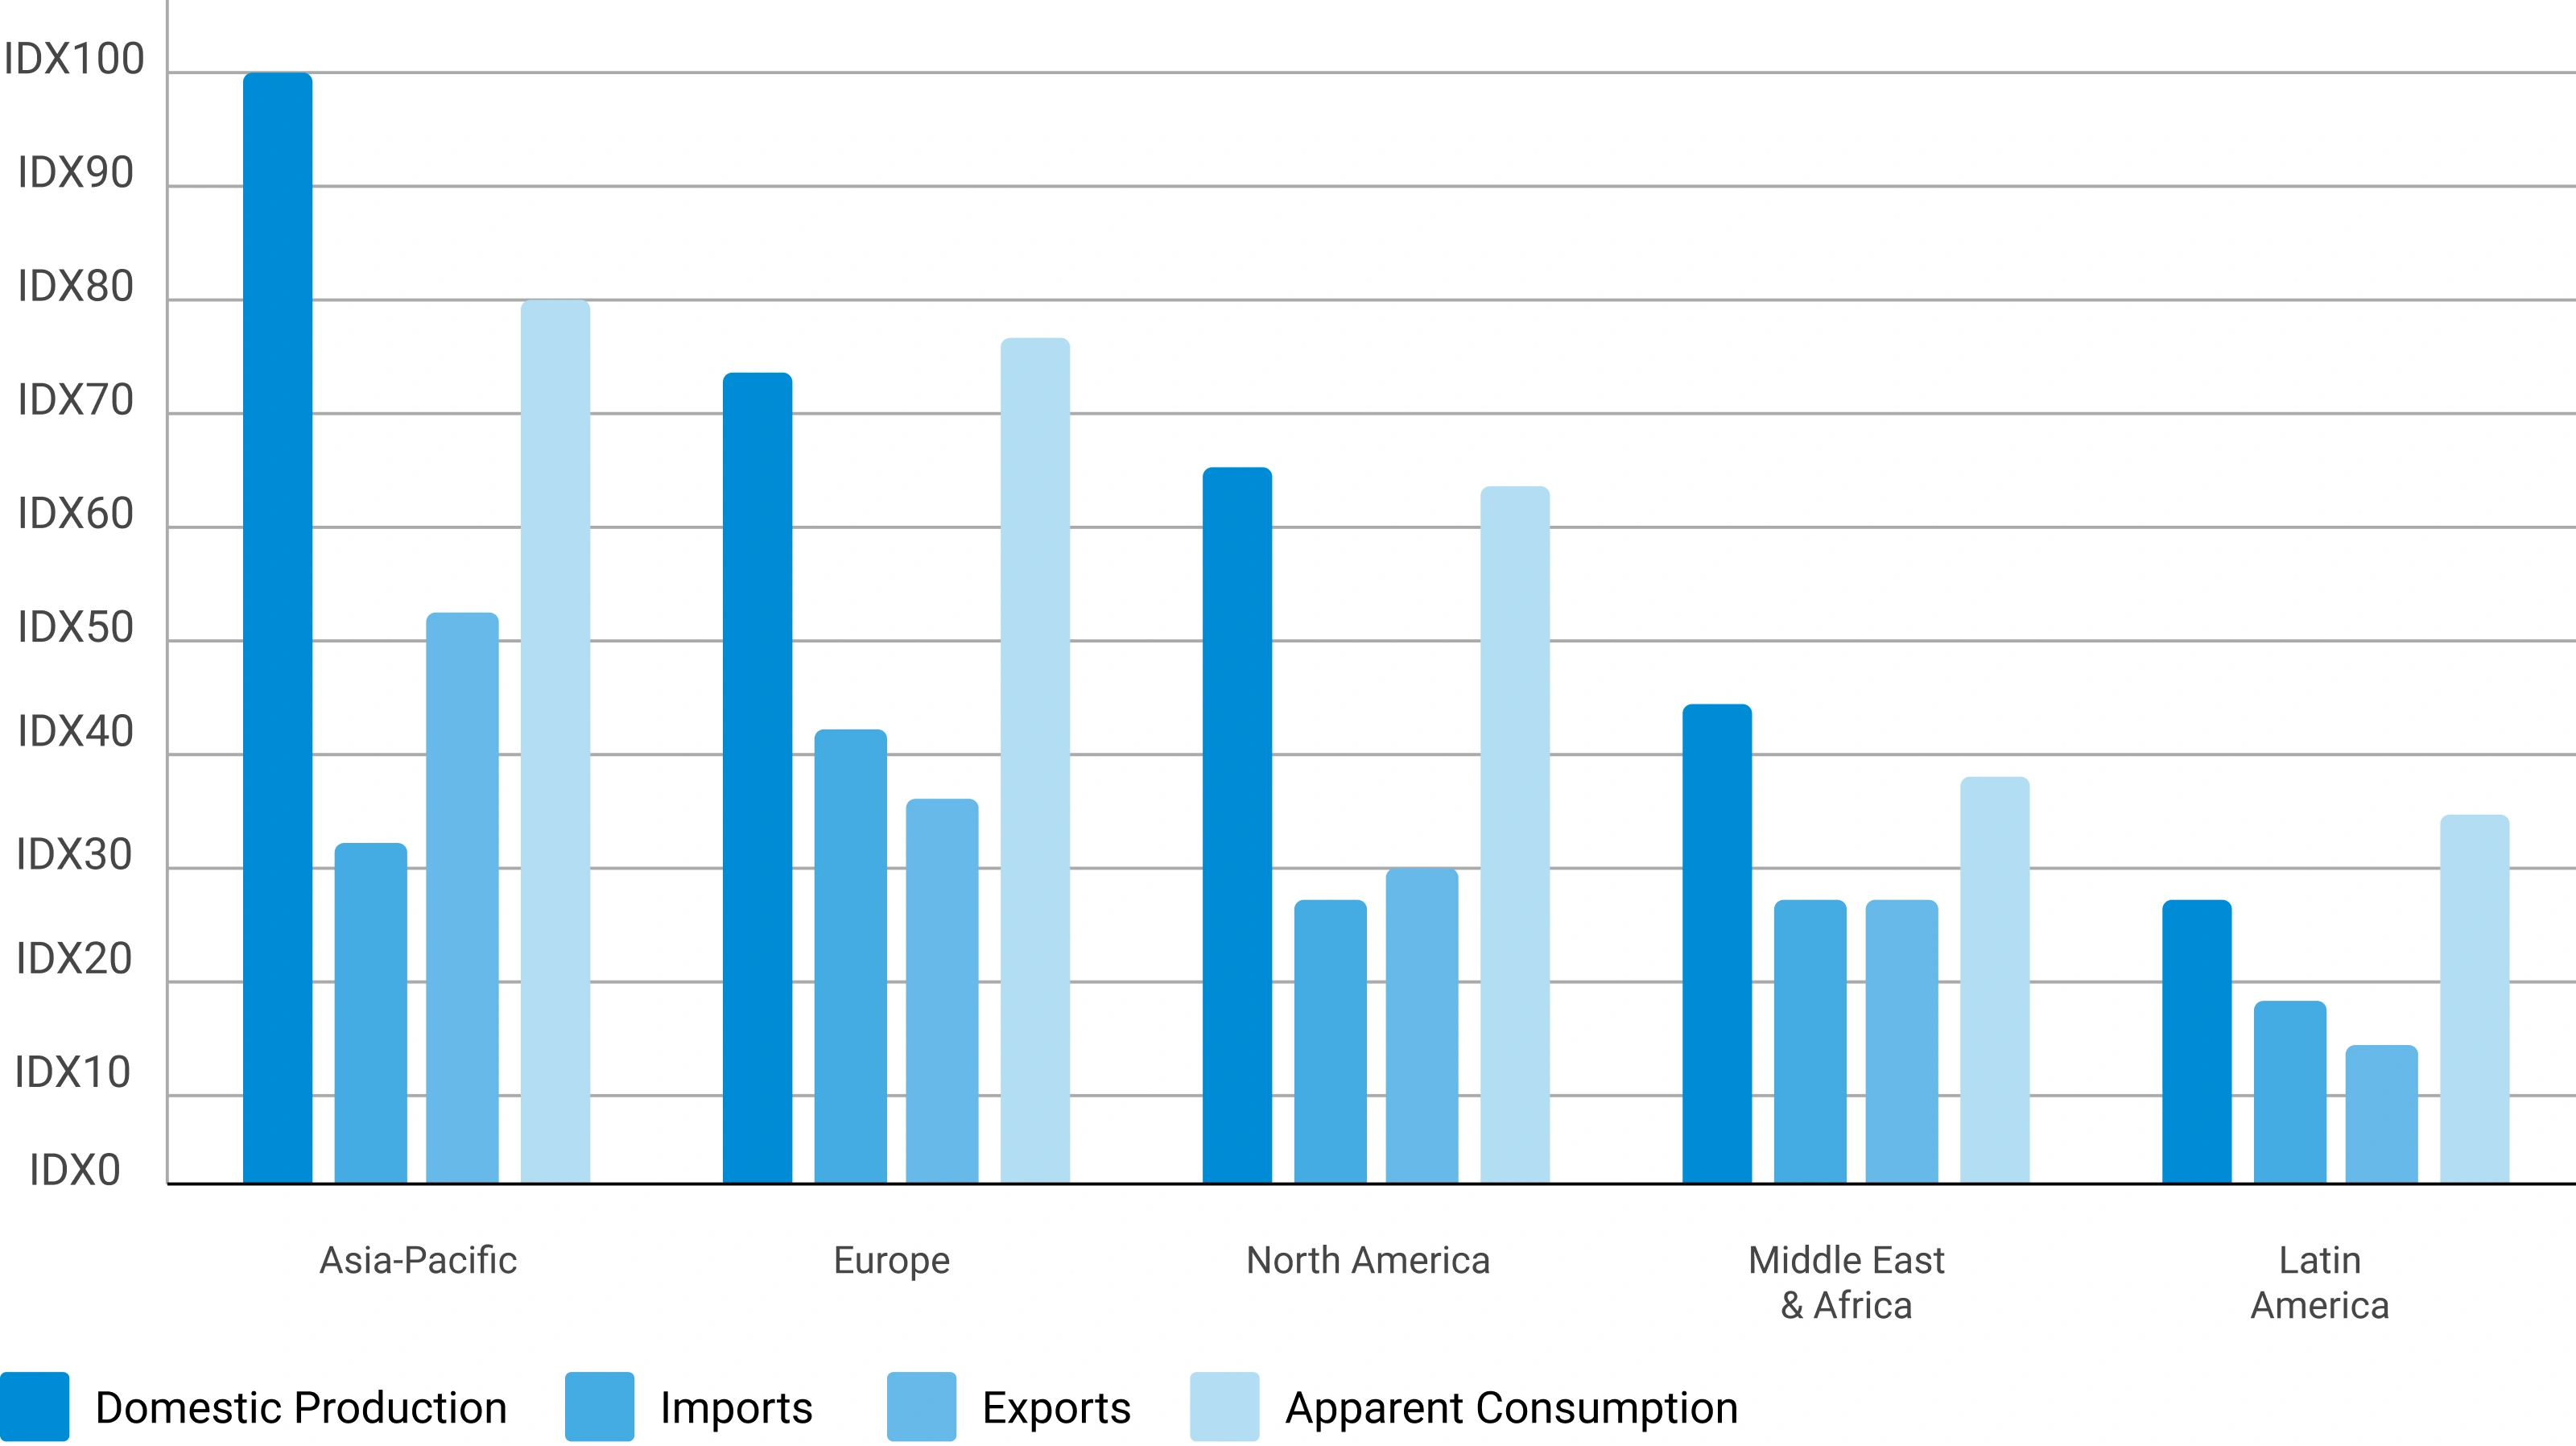
Apparent Consumption Model
Regional consumption is assessed using the standard apparent consumption formula:
Results identify net importing regions, net exporting regions, regional deficits, and surpluses — serving as an independent validation of supply and demand estimates.
Trade Flow Analysis — Net Supply Position by Region
Illustrative apparent consumption vs. domestic production across major regions — positive gap indicates net import dependency
Phase 5 — Primary Research: The Critical Validation Layer
Primary research tests and refines findings from secondary research through direct engagement with industry participants across the supply chain, demand side, and expert community. It captures intelligence that no database or published report can provide — the real-world experience of manufacturers, buyers, and specialists operating in the market.

Supply-Side Interviews
Conversations with chemical manufacturers, raw material suppliers, contract manufacturers, technology providers, and plant operators cover production trends, capacity utilization, pricing developments, technology shifts, and competitive dynamics.

Demand-Side Interviews
Engagement with OEMs, industrial consumers, procurement managers, distributors, formulators, and end-use manufacturers focuses on consumption trends, purchasing behavior, product substitution, demand outlook, and emerging applications.

Industry Expert Consultations
Additional interviews with industry consultants, independent experts, regulatory specialists, technical professionals, and research institutions provide deeper market context and validate key analytical assumptions.
Focus Areas of Primary Research:
Market Size & Forecast Validation
Revenue estimates, volume consumption, growth rates, forecast assumptions, regional demand.Supply Chain & Value Chain Assessment
Raw material sourcing, supply chain challenges, distribution networks, procurement practices.Production & Capacity Analysis
Manufacturing capacity, utilization rates, expansion projects, plant investments.Pricing & Cost Structure Analysis
Product pricing trends, feedstock costs, energy costs, margin pressures, pricing outlook.Competitive Landscape Assessment
Volume and value estimates confirmed to be fully consistent with one another before publicationInterview Volume by Market Scope
| Study Scope | Number of Interviews |
|---|---|
| Niche Market | 20 – 30 |
| Mid-Sized Market | 30 – 50 |
| Global Market | 50 – 80 |
| Highly Fragmented Market | 80 – 120 |
Interview Details:
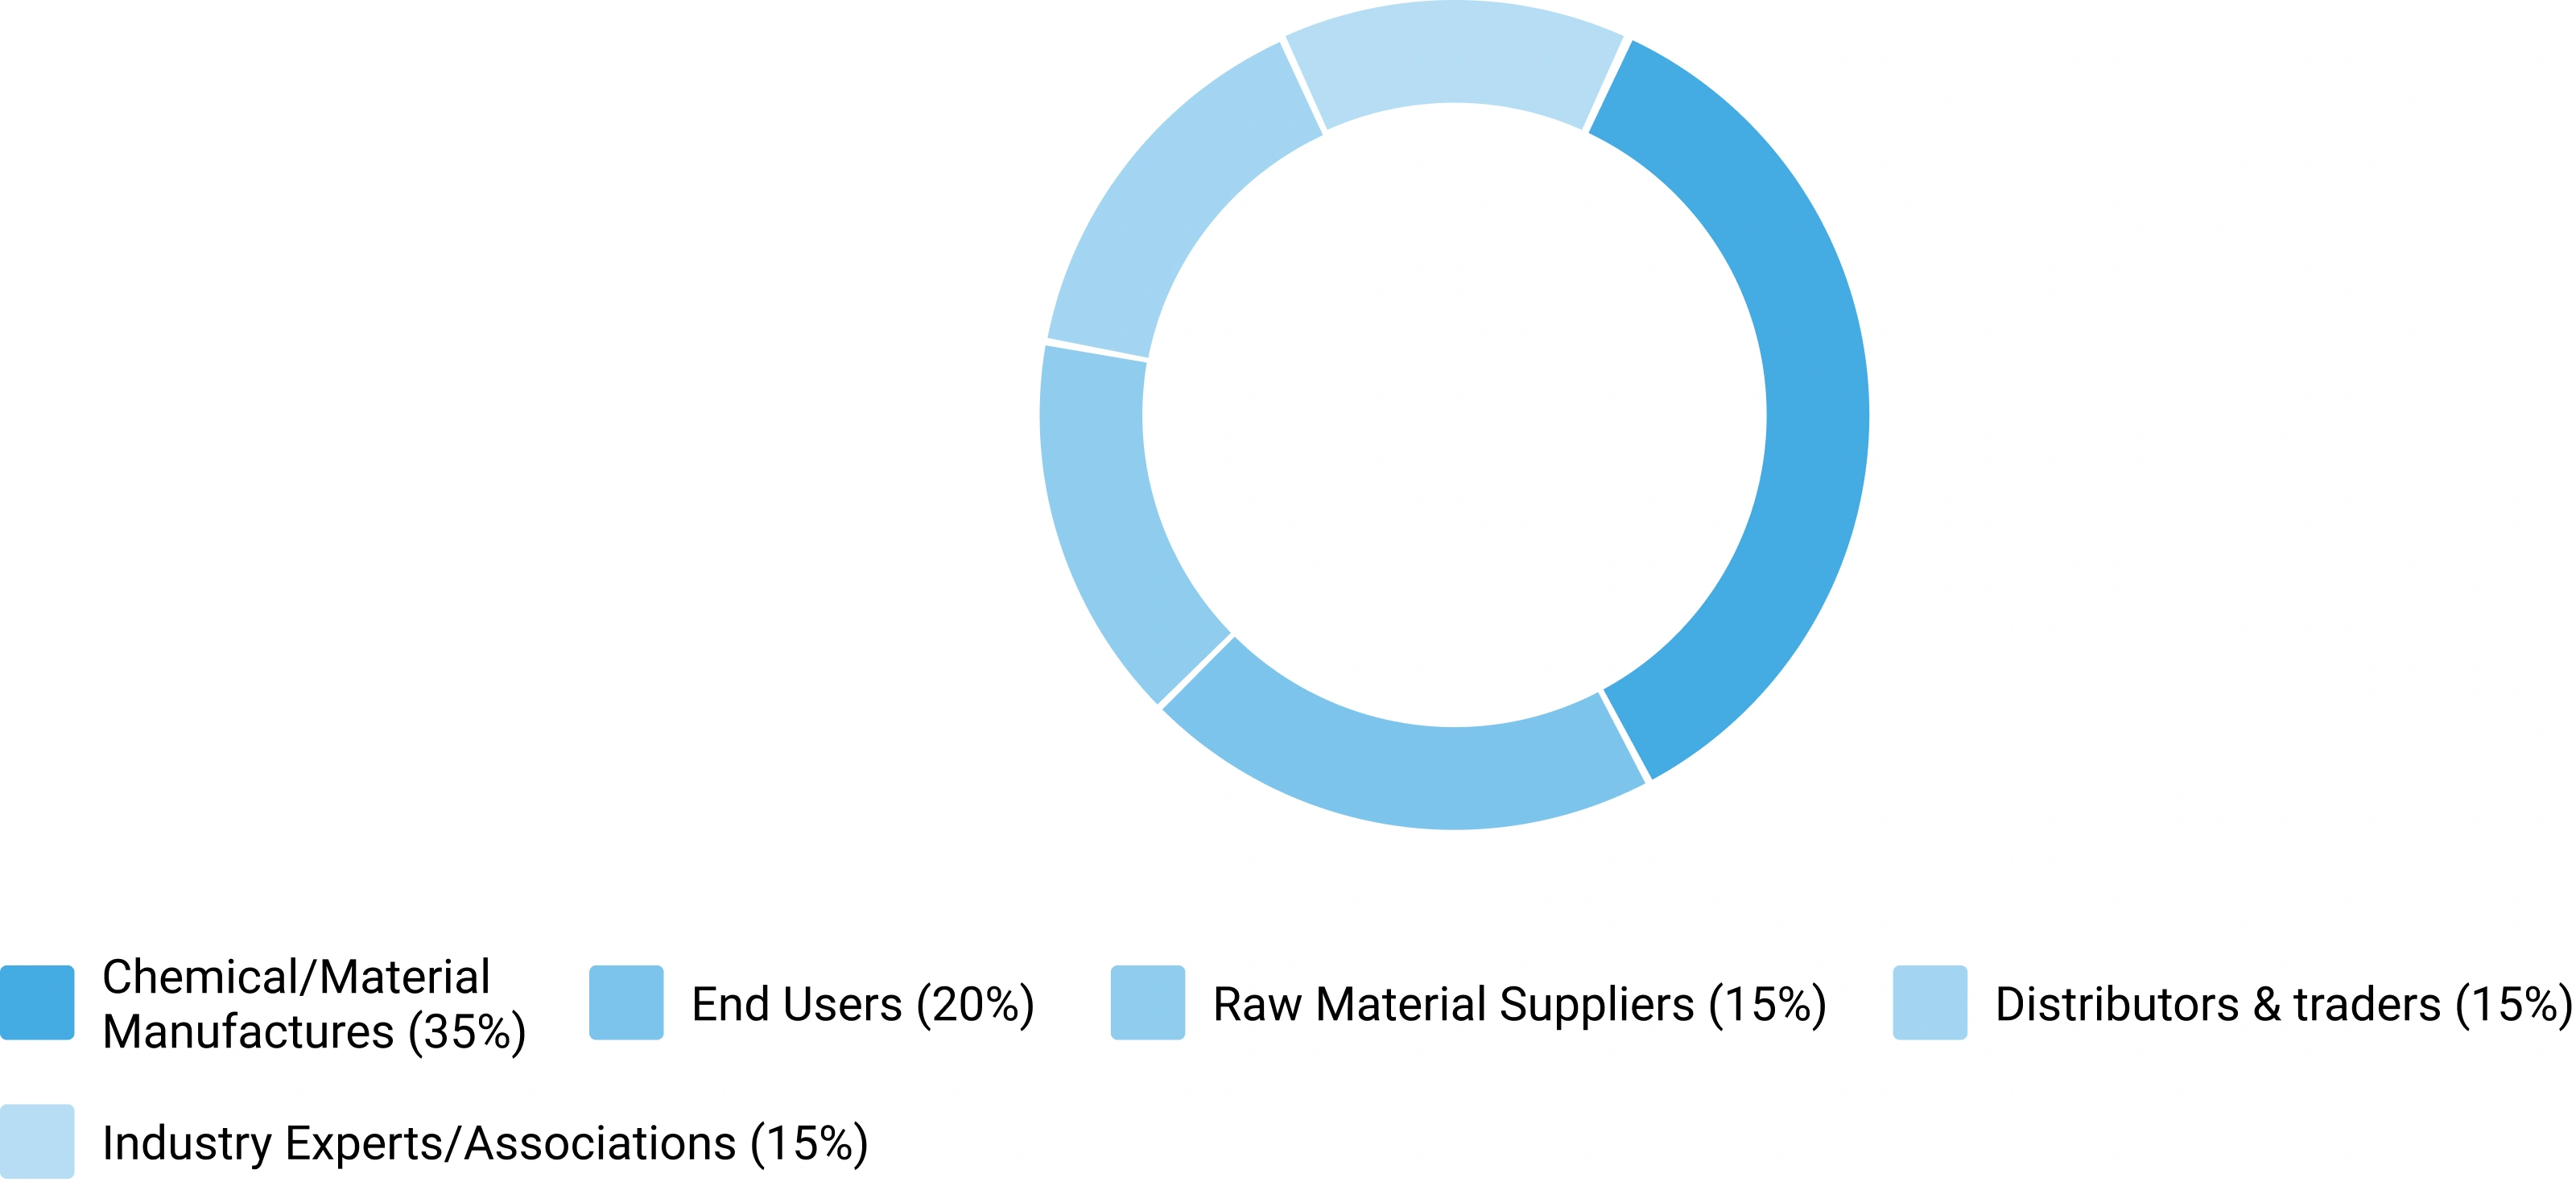
Category : Manufacturers, Suppliers, Distributors, End Users, Experts/Associations
Average Duration : 30–60 Minutes
Interview Mode : Video calls, telephonic interviews, expert consultations
Interview Format : Structured / Semi-Structured questionnaire
Focus Areas of Primary Research:
Market Size & Forecast Validation :
Revenue estimates, volume consumption, growth rates, forecast assumptions, regional demand.
Supply Chain & Value Chain Assessment :
Raw material sourcing, supply chain challenges, distribution networks, procurement practices.
Production & Capacity Analysis :
Manufacturing capacity, utilization rates, expansion projects, plant investments.
Pricing & Cost Structure Analysis :
Product pricing trends, feedstock costs, energy costs, margin pressures, pricing outlook.
Competitive Landscape Assessment :
Market share, competitor positioning, strategic initiatives, partnerships, acquisitions.
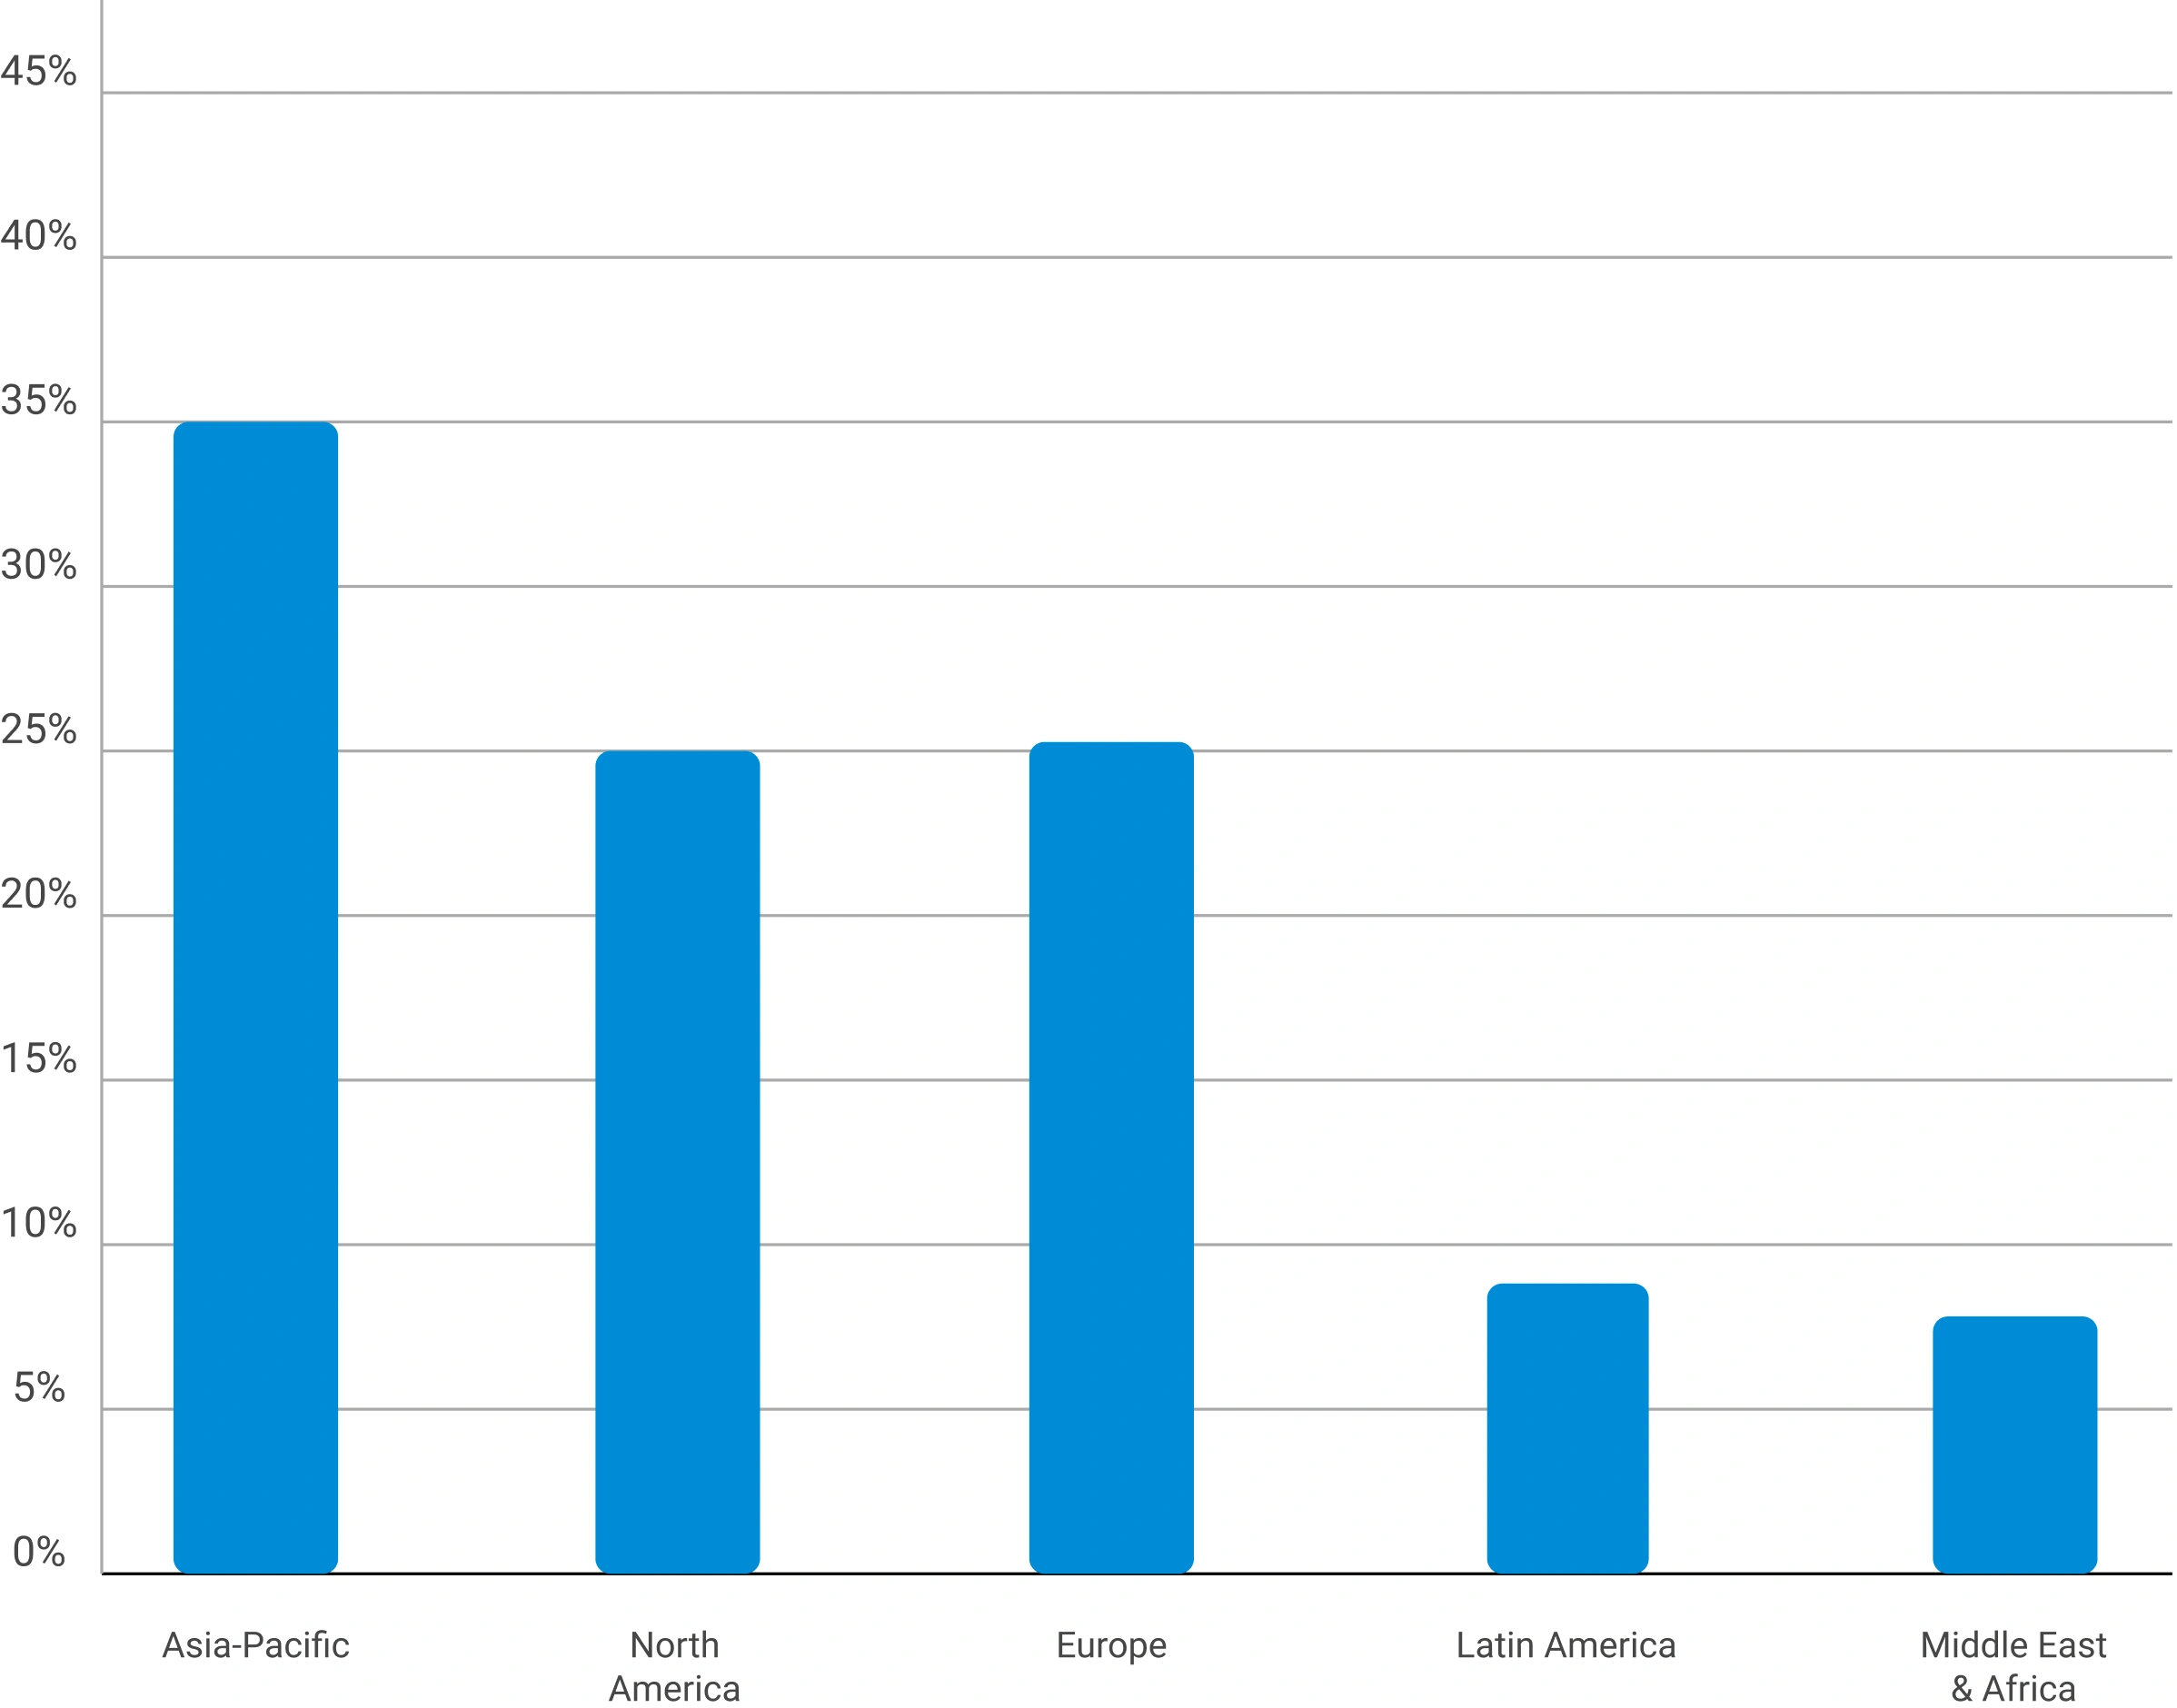
Primary Research — Stakeholder Coverage by Category
Distribution of interview respondents across stakeholder categories (% share from PPT data)
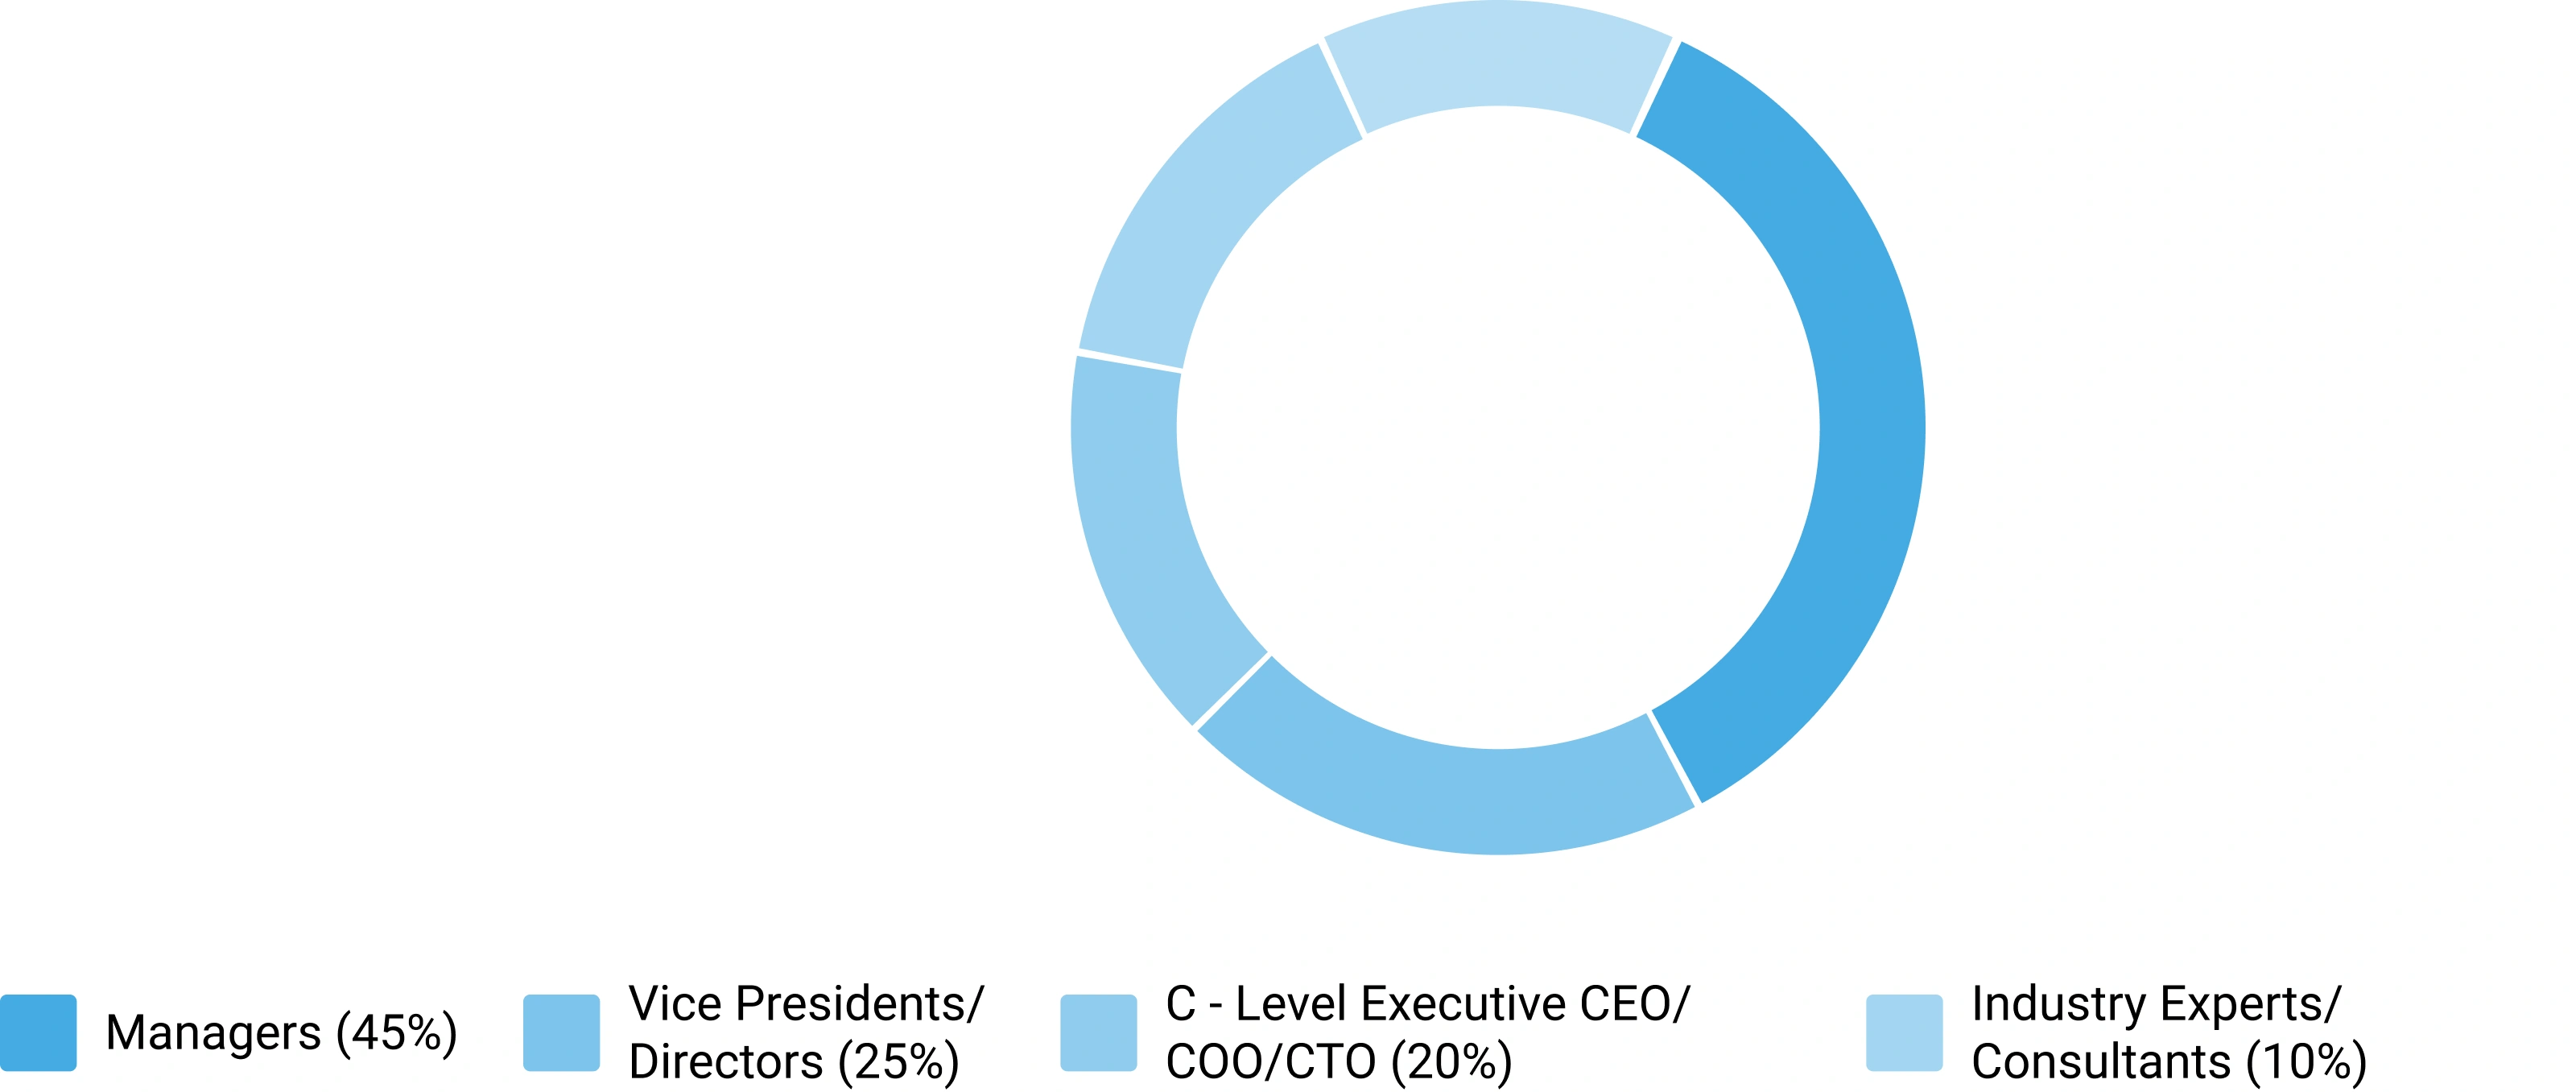
Primary Research — Respondent Designation Profile
Seniority breakdown of interview respondents (% share from PPT data)
Primary Research — Geographic Coverage of Interviews
Regional distribution of primary research engagement (% share from PPT data)
Phase 6 — Data Triangulation and Market Validation
No single methodology is relied upon in isolation. Multiple independent estimation approaches are combined and reconciled to ensure consistency, accuracy, and analytical defensibility. Any material deviations between approaches are investigated and adjusted through additional validation cycles.
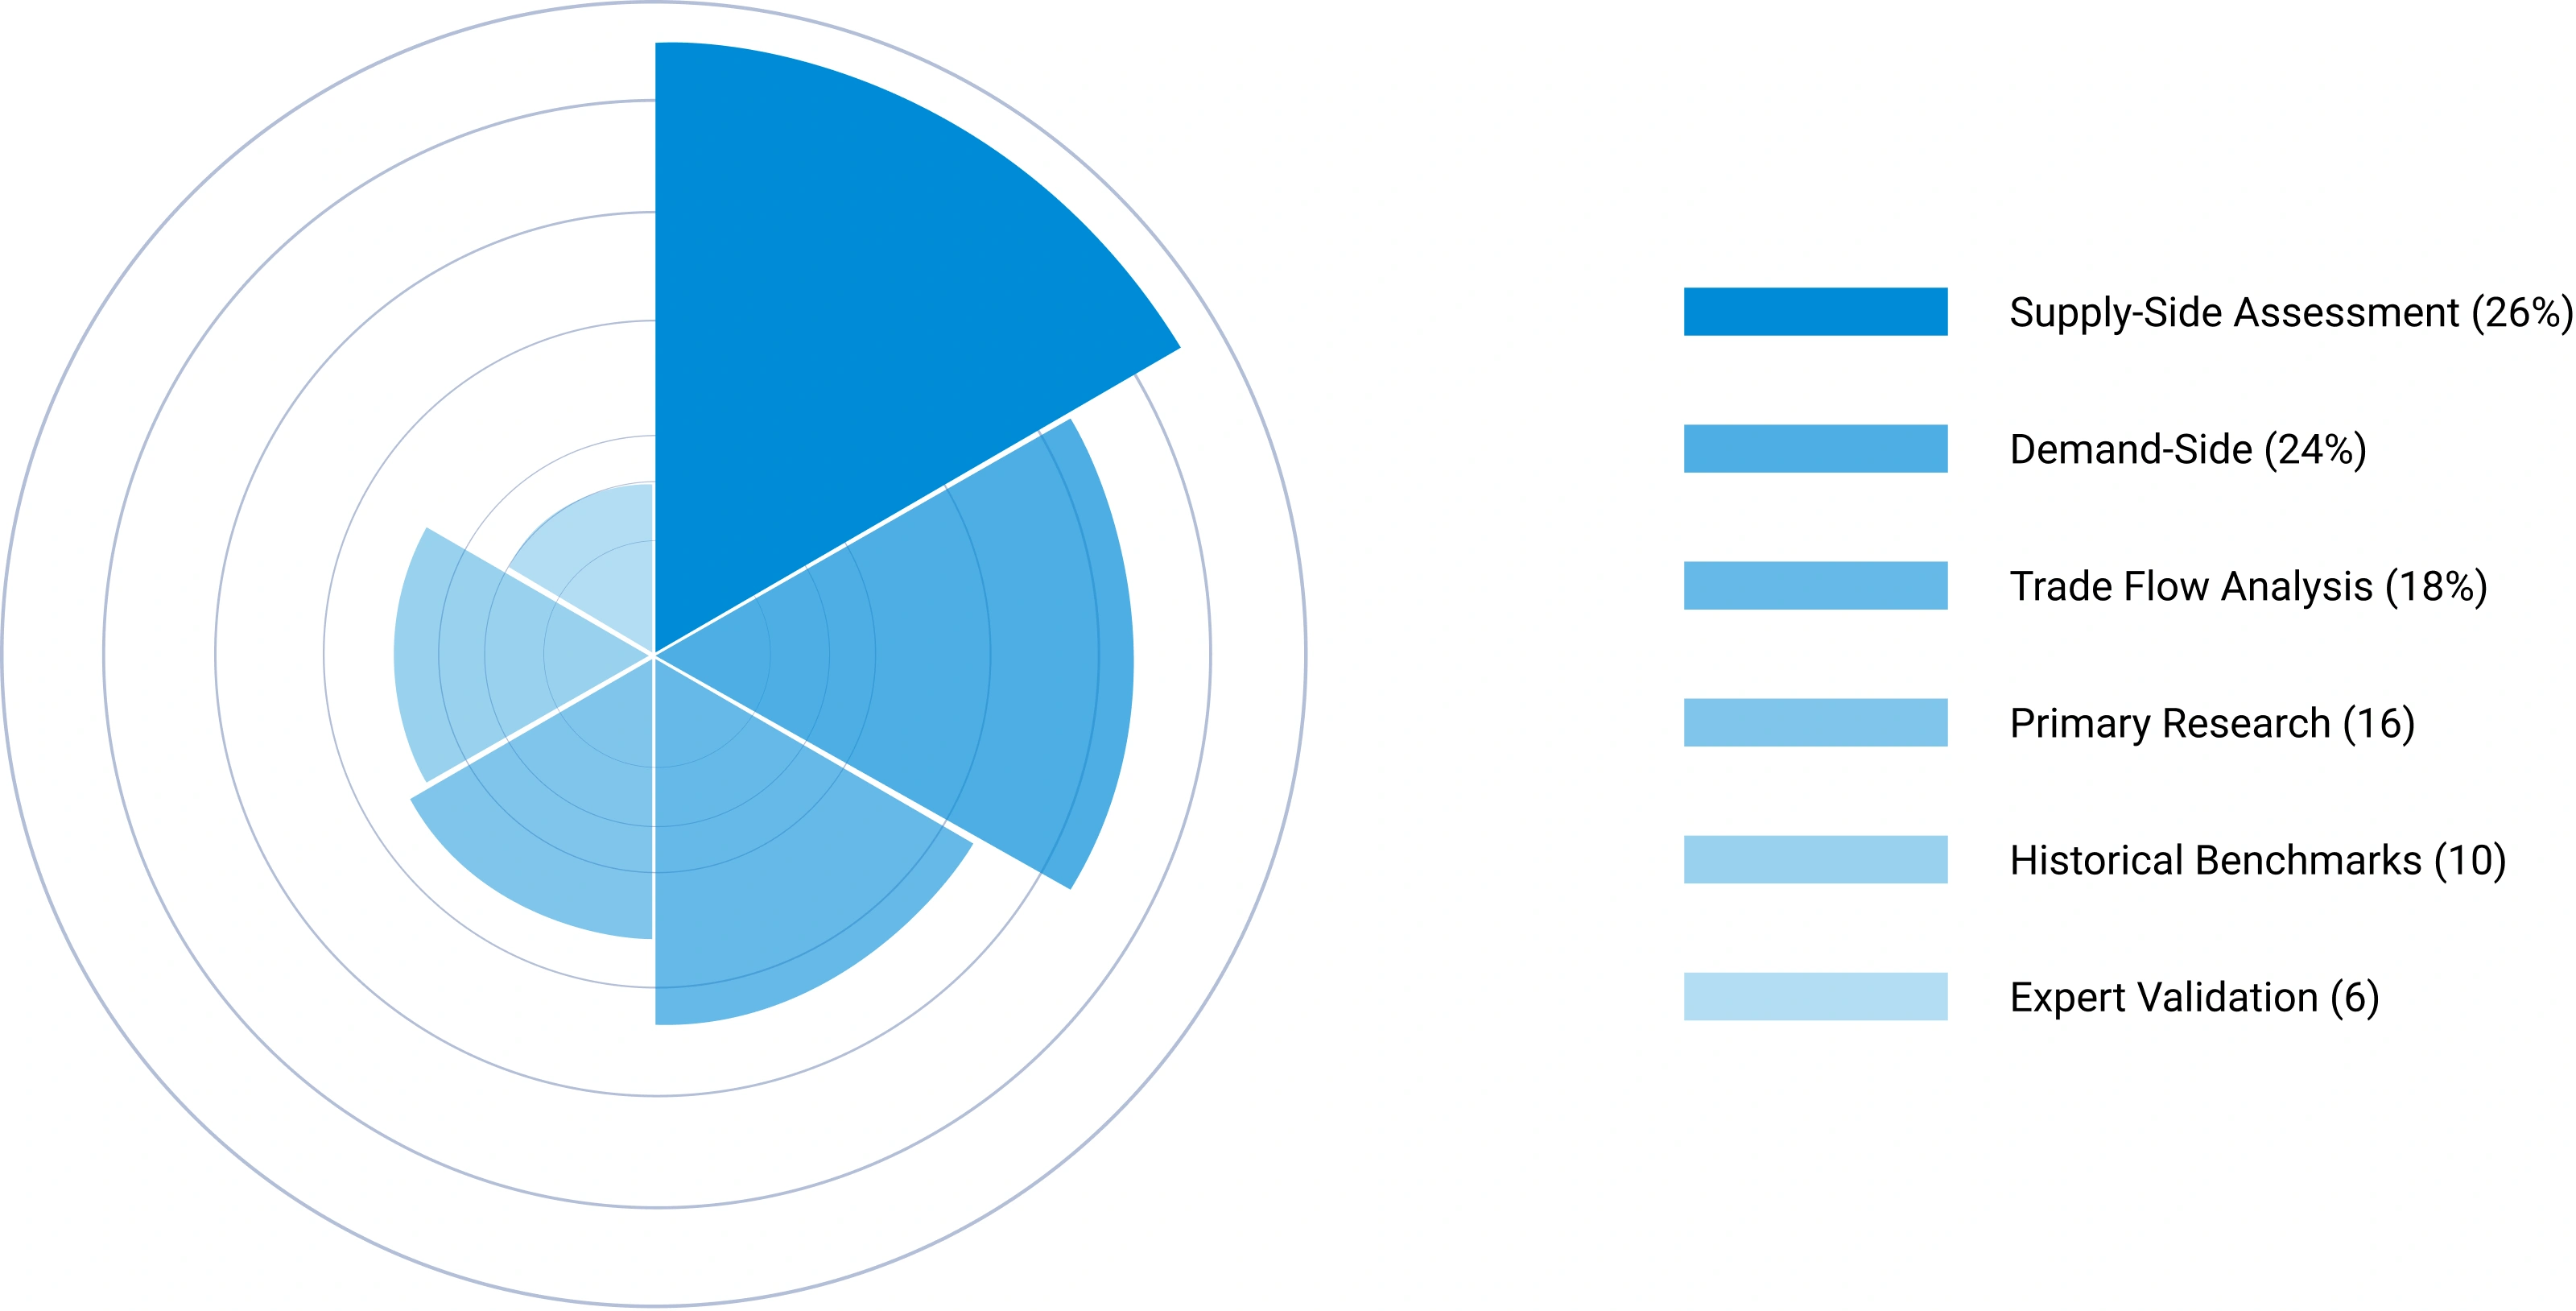
The final market size is derived through weighted triangulation of all validated methodologies. Any material deviations between approaches are investigated and adjusted through additional validation cycles. The outcome represents the most realistic assessment of the market based on available evidence and expert confirmation ensuring that volume and value estimates are fully consistent with one another.
Triangulation Framework — Input Contribution Weight
Relative weight each sizing input contributes to the final reconciled market estimate
Phase 7 — Forecast Modeling: Projecting Future Market Evolution
Forecasting evaluates the future trajectory of the market using a combination of quantitative indicators and qualitative assessments across economic, industry, and regulatory dimensions. Rather than simple extrapolation, each driver is independently modeled and integrated into a composite forecast.
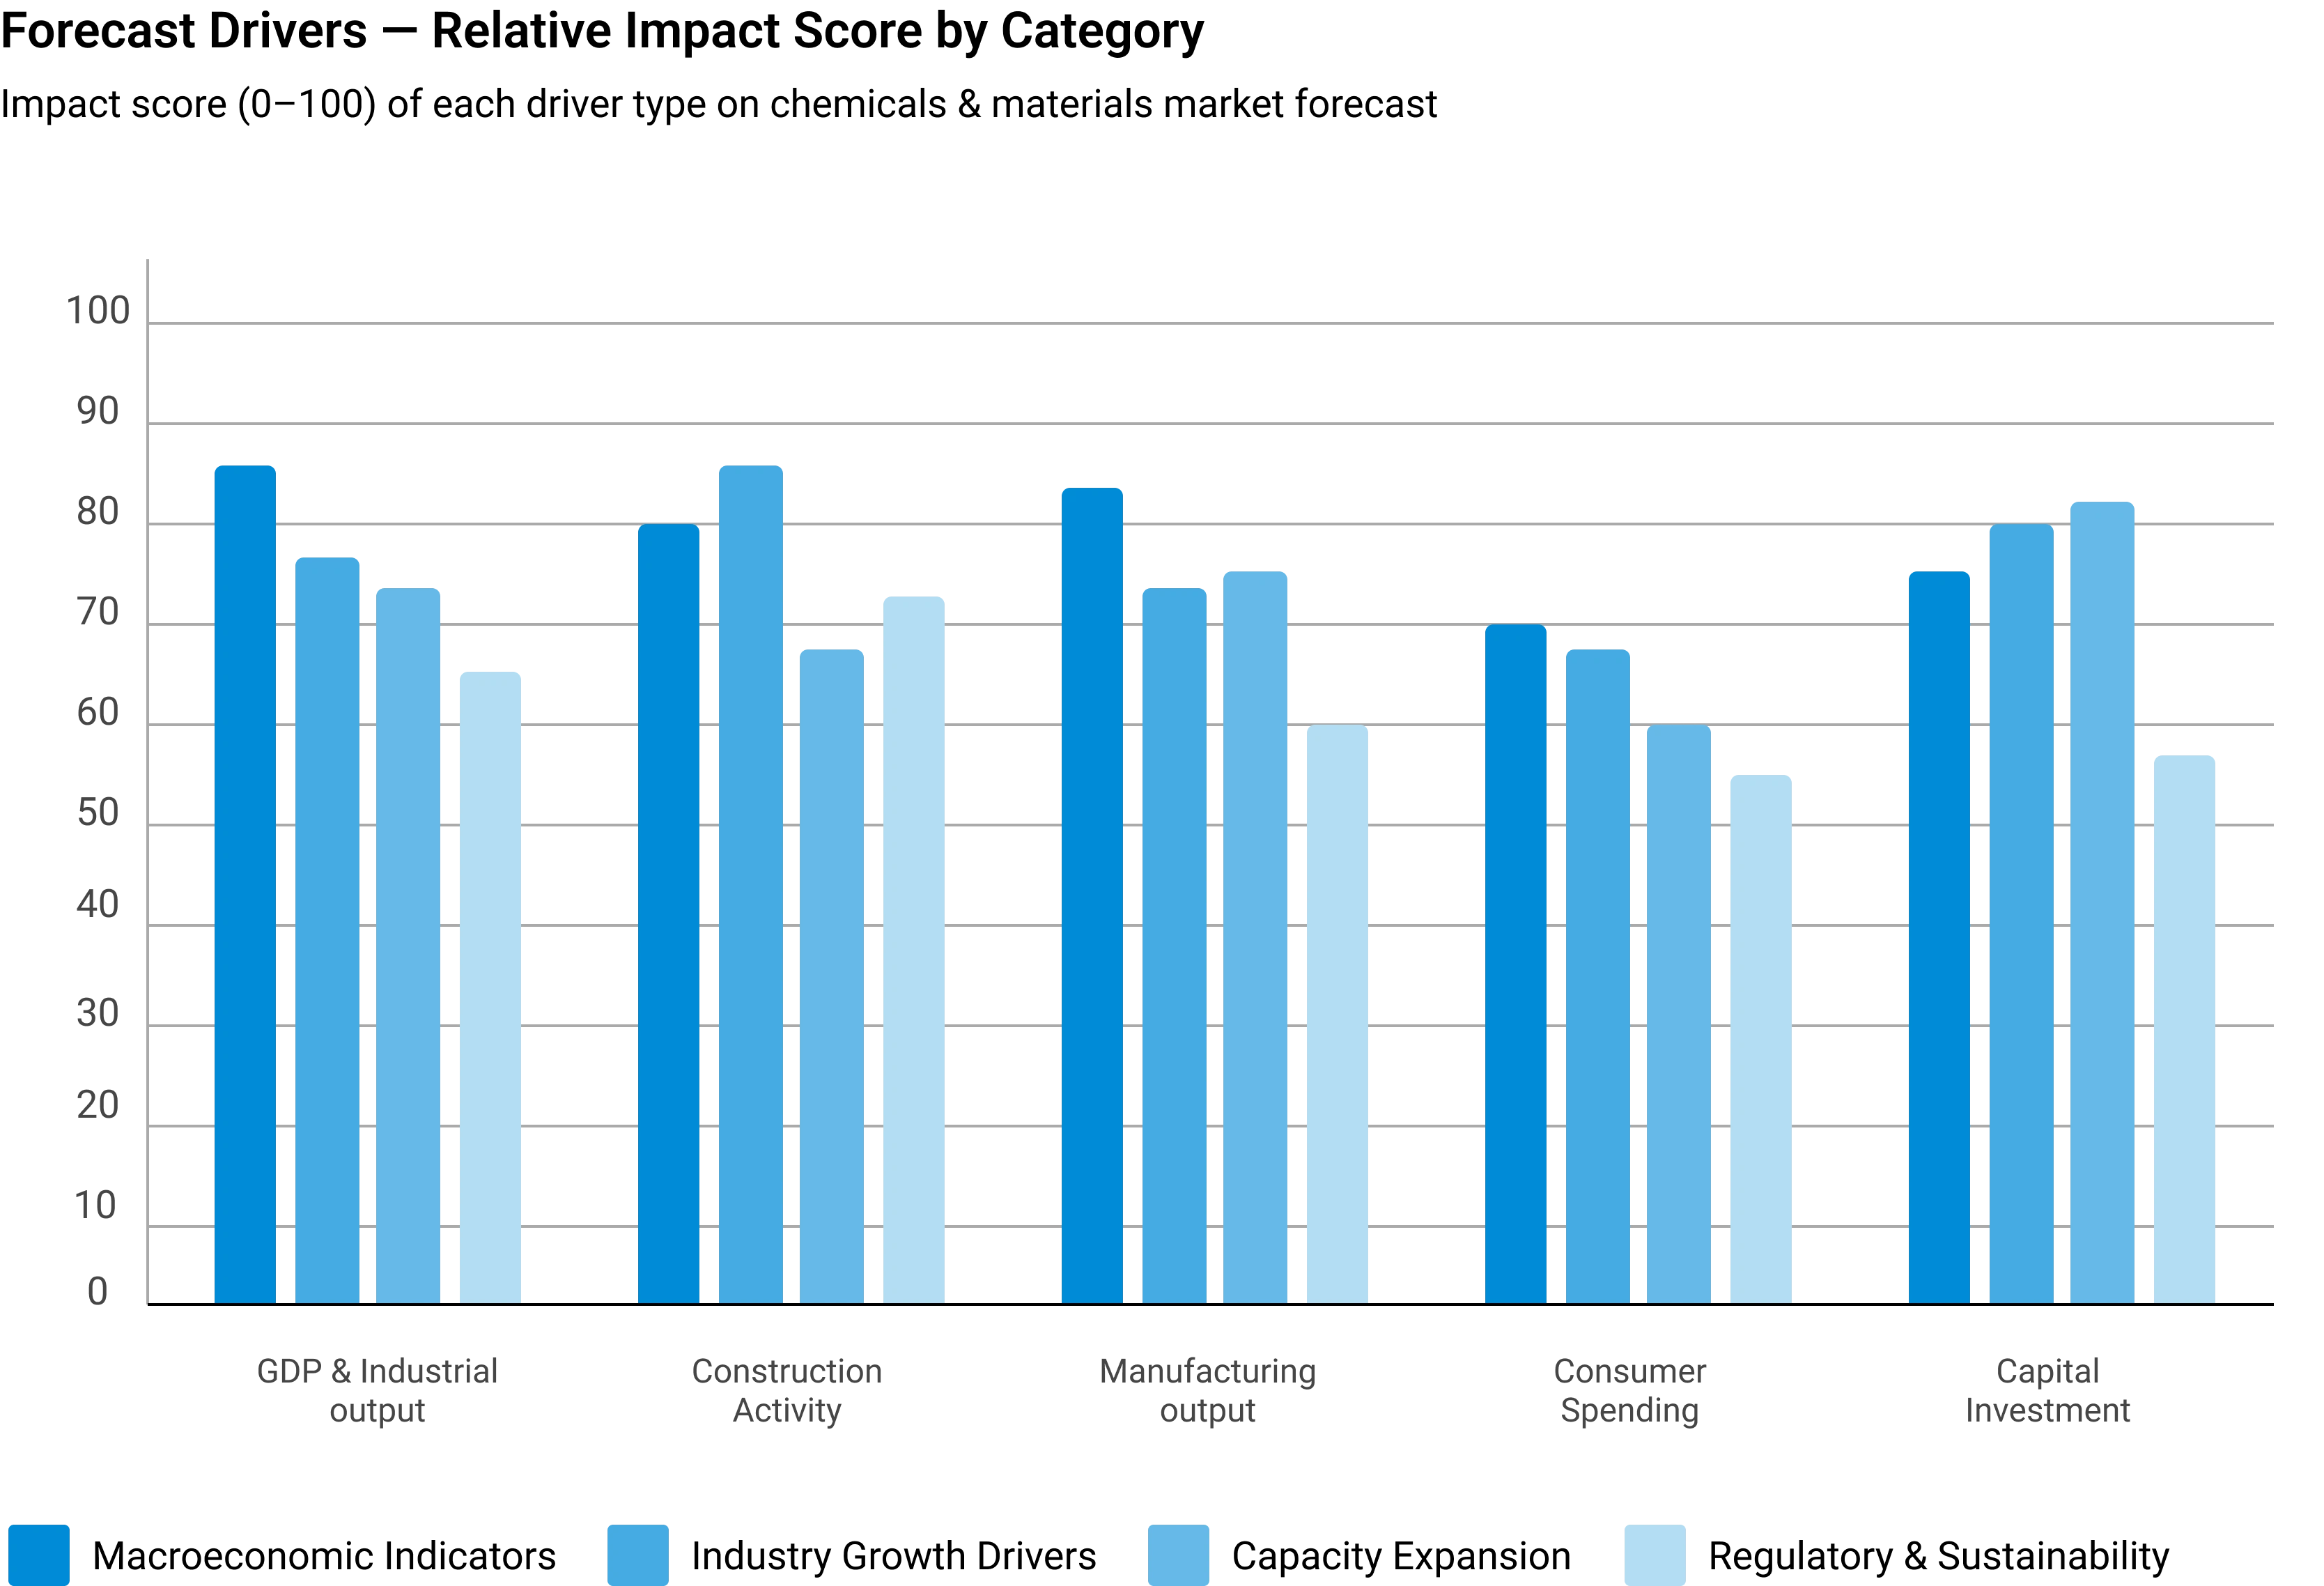
Macroeconomic Indicators
GDP growth, industrial production, manufacturing output, construction activity, consumer spending, and capital investment form the quantitative foundation of long-term demand projections. These are applied at country, regional, and global levels.
Industry Growth Drivers
Urbanization, infrastructure development, industrialization, technological innovation, sustainability initiatives, and evolving product performance requirements are assessed at regional and industry levels — capturing both structural and cyclical demand drivers.
Capacity Expansion Analysis
Announced plant expansions, new manufacturing facilities, technology upgrades, and strategic investments are evaluated to determine future supply-demand dynamics and potential market tightness or oversupply situations.
Regulatory & Sustainability
Environmental regulations, chemical safety standards, emission reduction targets, circular economy initiatives, and sustainability requirements are incorporated as they often influence product adoption rates and market growth trajectories.
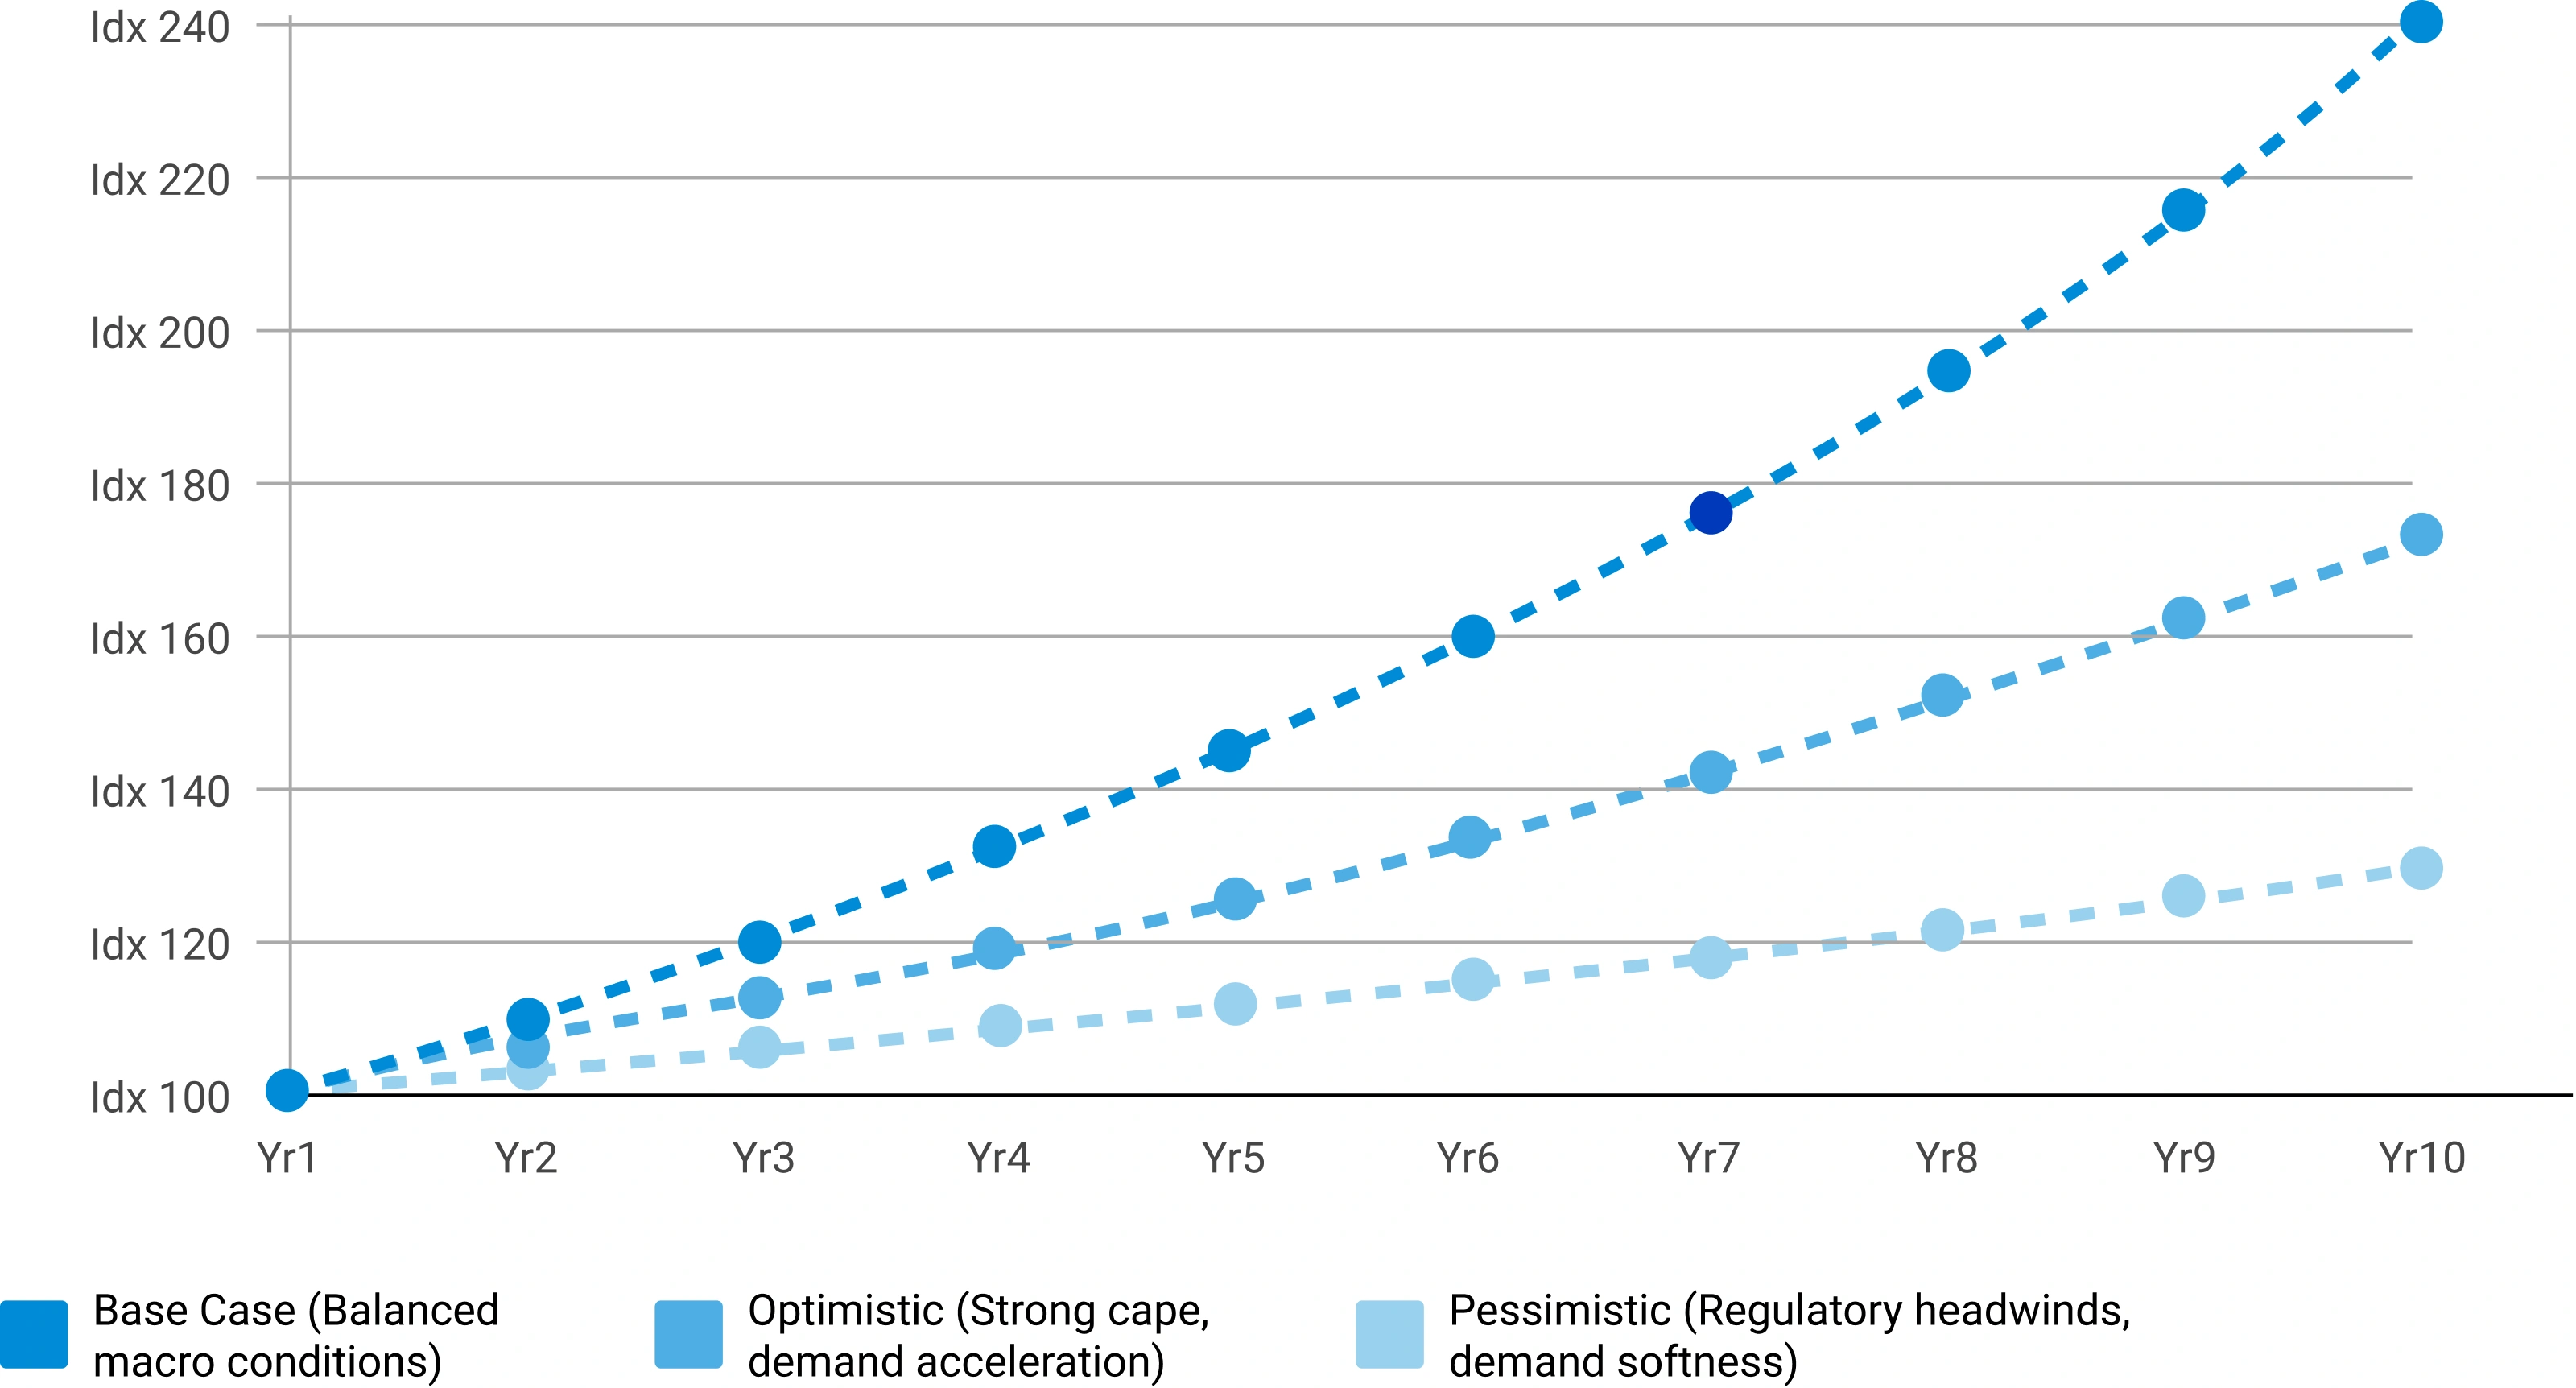
Scenario Forecast Range — Indexed Market Growth (Year 1–10)
Illustrative indexed growth trajectories across Base, Optimistic, and Pessimistic scenarios over a 10-year forecast horizon
Forecast Drivers — Relative Impact Score by Category
Impact score (0–100) of each driver type on chemicals & materials market forecast



Comments
Share your thoughts, ask a question, or provide feedback about this report.