
North America Cosmetic Chemicals Market Size Analysis Report 2035
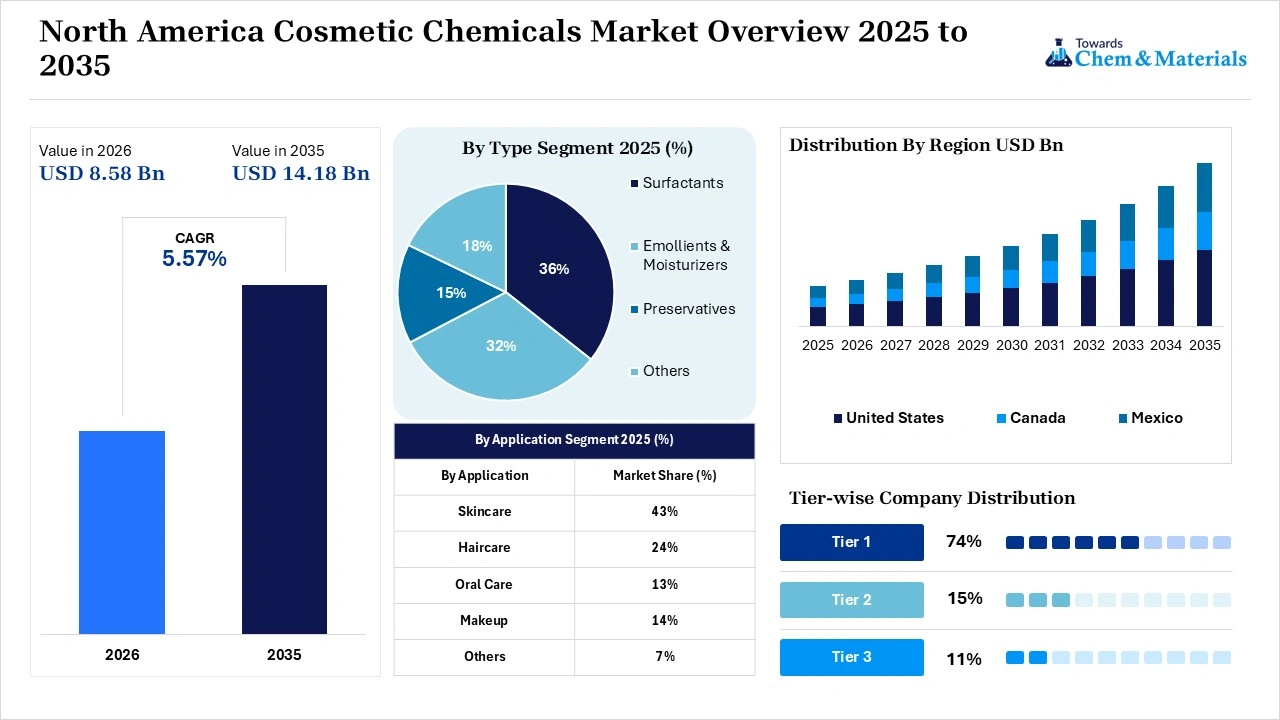
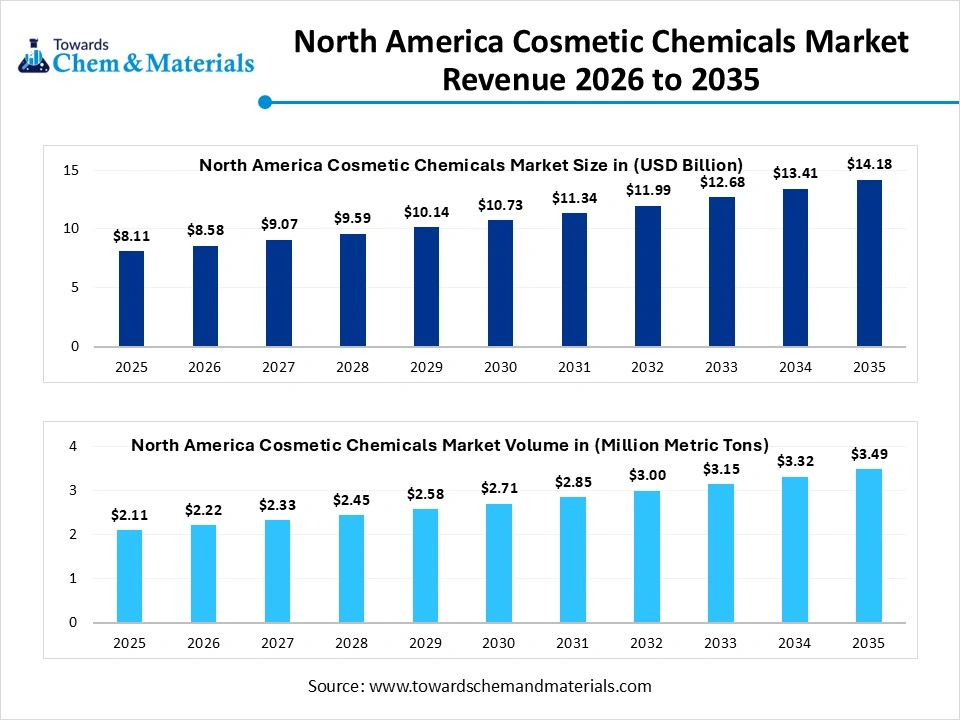
The global North American cosmetic chemicals market size was estimated at USD 8.11 billion in 2025 and is predicted to increase from USD 8.58 billion in 2026 to approximately USD 14.18 billion by 2035 and is expected to grow at a CAGR of 5.75% during 2025-2035, driven by the demand for clean label cosmetics and natural preservatives over synthetic alternatives as consumers prefer plant-based oils and herbal extracts. Products fuel the demand. The high demand for advanced formulations for different skin types with multifunctional properties, aligning with manufacturing standards, supports growth. Key player collaboration to scale sustainable surfactants and next-generation ingredient technologies, like Unilever and Galaxy Surfactants and BASF and IFF collaboration, strengthens the growth of the market.
Market Highlights
- By country, the United States dominated the North America cosmetic chemicals market with a share of 82.55% in 2025.
- By type, the surfactants segment dominated the market with a 35.8% share in 2025 and is expected to grow at a CAGR of 4.70% over the forecast period.
- By type, the emollients and moisturizers segment held a 32.1% market share in 2025 and is expected to have the fastest growth with a CAGR of 5.60% in the forecast period.
- By application, the skincare segment dominated the market with a 42.8% share in 2025 and is expected to grow at a CAGR of 5.40% over the forecast period.
- By application, the makeup segment held 13.5% market share in 2025 and is expected to have the fastest growth with a CAGR of 5.80% in the forecast period.
Market Overview
North American Cosmetics Chemicals: Clean Beauty Demand
According to Towards Chemicals and Materials Analytics and Consulting, the global North American cosmetic chemicals market volume was valued at 2.11 million metric tons in 2025 and is expected to surpass around 3.49 million metric tons by 2035, accelerating a compound annual growth rate (CAGR) of 5.15% over the forecast period from 2026 to 2035.
The North American cosmetics chemicals market is experiencing growth due to growing consumer preference for clean beauty products, which use natural, sustainable, and organic products and core ingredients. The high demand for multifunctional products, which are blended in makeup and skincare for essential properties like moisturizing and serum essence, is a major growth factor. The use of niacinamide and hyaluronic acids is a major revenue generator for the market due to growing demand aligning with incredible production.
The strategic collaborations between key players like BASF SE, Dow Chemical Company, Evonik Industries AG, Clariant International Ltd., Ashland Global Holdings Inc., and Croda International Plc for supply chain optimization, animal-free safety assessments, regulatory compliance through outsourcing, and sustainable research and development through joint ventures between academic institutions and private research and development hubs for the supply of raw materials, clean label alternatives, and functional anti-aging peptides.
- For instance, in August 2026, FULLY enters Sephora US via OLIVE YOUNG K-Beauty Edit. Brand to launch six skincare products, including Green Tomato Deep Purifying Clay Mask Cleanser, Rice-Dough Hydrating Mask Cleanser, Rice Ceramide Moisture Essence Toner, Rice Ceramide Moisture Capsule Cream, Rice Ceramide Moisture Barrier Sunscreen, and the Rice PDRN Glow Barrier Boosting Serum line. US expansion follows Sephora launches in six Asia-Pacific markets. (Source: biz.chosun.com)
Global Investment Flow for North America Cosmetic Chemicals Market 2026
The major key players invest in research and development and portfolio investment to encourage advanced product production and manufacturing through companies like BASF SE, Dow Chemical Company, Evonik Industries, and Givaudan.
Companies are investing in regional consolidation and localized manufacturing assets across the U.S., Canada, and Mexico to mitigate global logistics risks and support indie beauty brands.
The U.S. FDAs Modernization of Cosmetics Regulation Act has raised compliance standards, favoring companies that invest robustly in advanced quality management systems and transparent raw material sourcing. Investors are heavily funding startups focusing on circular economy solutions, upcycled raw materials, and biodegradable polymers that replace traditional microplastics.
Report Scope
| Report Attributes | Details |
| Market Size in 2026 | USD 8.58 Billion / 2.22 Million Metric Tons |
| Expected Size in 2035 | USD 14.18 billion / 3.49 Million Metric Tons |
| Growth Rate | CAGR of 5.75% |
| Base Year of Estimation | 2025 |
| Forecast Period | 2025-2035 |
| Segment Covered | By Type, By Application |
| Key Companies Profiled | Clariant International Ltd., Lubrizol Corporation, Solvay S.A., Symrise AG, dsm-firmenich, Givaudan Active Beauty, Lonza Group AG, AkzoNobel N.V., Elementis plc, Innospec Inc., Wacker Chemie AG, Seppic, Brenntag North America, Momentive Performance Materials, Kobo Products |
Market Growth Trends:
- The consumers increasing demand for organic, cruelty-free products; vegan products; and brands growing adoption of clean label and natural preferences through green chemistry adoption and bio-based alternatives are growing trends in the growth of the market.
- Consumers, such as younger generations, are increasingly demanding premium and high-quality skincare and anti-pollution routines, increasing the demand for production supporting the market growth.
- A growing shift towards the use of sustainable sourcing and upcycled components, which helps in reducing waste and manufacturers’ focus on lifecycle, is a major growth factor.
North America Cosmetic Chemicals Market: Hyper-Personalization and Custom Formulations
The North American cosmetic chemicals market is experiencing growth through the integration of AI, which is a core technological shift through hyperpersonalization and custom formulations. Through advanced diagnostic analysis of an individuals skin, environmental exposure, and genetics, formulators use AI to tailor cosmetic products according to specific consumer needs. The other major technical shifts are AI-driven ingredient discovery and modeling; sustainable and upcycled chemistry integration; and real-time process and supply chain optimization, which help in the advancement of the product.
Supply Chain Analysis of North America Cosmetic Chemicals Market:
Cosmetic Chemical Production & Processing
- Cosmetic chemicals include active ingredients, emollients, moisturizers, surfactants, preservatives, emulsifiers, conditioning agents, fragrances, and UV absorbers used in skincare, haircare, makeup, and other personal care formulations. North America is a major market, supported by strong demand for premium, multifunctional, natural, and science-backed cosmetic formulations.
- Key Players: BASF, Evonik Industries, Ashland, and Lubrizol.
- Ashland develops specialty ingredients for skincare, haircare, sun care, and other personal care formulations, including polymers, film formers, rheology modifiers, and active ingredients designed to improve formulation performance.
Quality Testing & Certification
- Cosmetic chemicals must meet requirements related to ingredient safety, purity, formulation stability, labeling, contamination control, and environmental compliance. In the U.S., the regulatory framework has also been strengthened through the Modernization of Cosmetics Regulation Act, increasing responsibilities related to cosmetic product safety and facility oversight.
- Key Authorities & Standards: U.S. Food and Drug Administration, Health Canada, International Organization for Standardization, ASTM International.
- BASF supplies cosmetic ingredients and formulation solutions that undergo safety, quality, and performance evaluation for use in personal care products, supporting manufacturers in meeting regulatory and formulation requirements.
Distribution to End-Use Industries
- Cosmetic chemicals are supplied to skincare, haircare, color cosmetics, fragrance, sun care, and personal hygiene manufacturers. Growing consumer interest in clean-label, naturally derived, multifunctional, and biotechnology-based ingredients is encouraging North American manufacturers to expand specialty ingredient development.
- Key Suppliers: Evonik Industries, Ashland, Lubrizol.
- Evonik Industries provides active ingredients, functional ingredients, emulsifiers, surfactants, and specialty cosmetic chemicals for skincare, haircare, and other personal care applications, supporting formulators in developing high-performance and sustainable products.
Sustainability Analysis in North American Cosmetic Chemicals
North Americas natural personal care and cosmetic chemicals market is expanding rapidly. The increased demand for clean labels is due to growing consumer awareness regarding health and environmental risks of synthetic chemicals, which drives preference for bio-based formulations. Advanced biotechnology and green chemistry innovations to replace petroleum-derived components with microbial and botanical components are a major driver of sustainability growth.
What are the cosmetic chemicals?
Cosmetic chemicals are the natural and synthetic raw materials and active ingredients that are used for the formulation of skincare products, including haircare, makeup, and personal care products. The key types of cosmetic chemicals used are surfactants, emollients, moisturizers, preservatives, active ingredients, colorants, and pigments, which are used to formulate cosmetic products with advanced properties.
What are the key uses of North American cosmetic chemicals
North American cosmetic chemicals are primarily used to formulate, preserve, stabilize, and enhance personal care and beauty products.
Key Uses by Chemical Type
- Surfactants: They are used in the formulation of shampoos, body washes, and facial cleansers to clean skin and hair by creating foam and removing dirt and oils.
- Preservatives: They are added to lotions, sunscreens, and shampoos to prevent microbial growth, stop spoilage, and extend shelf life.
- Emollients: They are used in creams and lotions to soften and smooth the skin while improving product texture and feel.
- Active Ingredients: They are included in targeted treatments for anti-aging, hydration, acne control, and skin repair.
- Colorants and Pigments: They are used in foundations, lipsticks, and eyeshadows to provide visual appeal, matching shades, and UV protection, such as mineral pigments.
North America Cosmetic Chemicals Premium Pricing Analysis
The premium cosmetic chemicals price depends completely on the demand for the product by consumers. Premium ingredients like specialty additives, organic-grade components, and anti-aging active ingredients drive growth over basic commodities. Regulatory impacts like compliance with frameworks like the FDA’s Modernization of Cosmetics Regulation Act increase operational costs for smaller providers, favoring major suppliers. Suppliers of clean and dermatologist-backed active ingredients command high margins due to specialized research and documentation requirements. The increased use and production of clean-label ingredients and production will eventually help in lowering the costs of the product in coming decades.
North America Cosmetic Chemicals Market Carbon Tax Analysis
The North American cosmetic chemicals market faces growing economic pressure from carbon pricing and sustainability mandates. The rising carbon compliance costs rapidly accelerate manufacturers to shift towards bio-based and organically sourced ingredients and green production methods to lower the carbon tax costs, which add to the cost of the product and penalties. The manufacturers shift towards adoption and investment in low-carbon manufacturing technologies for chemical synthesis will help in lowering the carbon tax on products.
North America Cosmetic Chemicals Market Regulatory Landscape
| Country / Region | Regulatory Body | Key Regulations | Focus Areas | Notable Notes |
| United States | Food and Drug Administration, Environmental Protection Agency | Federal Food, Drug, and Cosmetic Act, Modernization of Cosmetics Regulation Act, Toxic Substances Control Act | Ingredient safety, product safety, labeling, facility compliance | The U.S. cosmetic chemicals market is supported by strong demand for skincare, haircare, color cosmetics, fragrances, and personal-care products. MoCRA has expanded FDA oversight through facility registration, product listing, adverse-event reporting, and safety substantiation requirements. |
| Canada | Health Canada | Food and Drugs Act, Cosmetic Regulations, Cosmetic Ingredient Hotlist | Ingredient restrictions, product safety, labeling | Canada requires cosmetics to meet safety requirements, with prohibited and restricted ingredients addressed through the Cosmetic Ingredient Hotlist. Manufacturers and importers must submit a Cosmetic Notification Form after the first sale. |
| Mexico | Federal Commission for the Protection against Sanitary Risks, Ministry of Economy | Federal Health Law, Mexican Official Standards | Cosmetic safety, labeling, quality standards | Mexico is an important North American market for cosmetic chemicals, supported by growing personal-care manufacturing and demand for specialty ingredients. |
Market Dynamics
Drivers
North America Cosmetic Chemicals Market: Regulatory Shifts and Compliance
The growth of the North American cosmetic chemicals market is driven by the growing shift in regulation and compliance through strict rules from agencies like the U.S. FDA and Health Canada and also through modernization of the Cosmetics Regulation Act in the region, which pushes manufacturers to formulate safe and compliant products, which is a key growth driver of the market. Other major growth drivers are clean label and natural ingredient preferences, eco-friendly ingredient shifts, and high demand for premium and functional skincare products, supporting the growth of the market.
Challenges
North America Cosmetic Chemicals Market: Health and Safety Concerns
The key growth challenges in the North American cosmetic chemicals market are the health and safety concerns associated with the chemicals in cosmetic formulations, as long-term use can cause skin irritation and health risks, which is a major challenge in the market. Strict regulations limit the chemical in personal care items due to tough rules. Other major challenges are high costs, supply pressure, strict regulations, and transparency and traceability, which hinder the growth of the market.
Opportunities
North America Cosmetic Chemicals Market: Clean Beauty and Sustainability
The key growth opportunities that support the North America cosmetic chemicals market are the high demand for clean beauty and sustainability initiatives due to increased demand for bio-based ingredients, as buyers demand natural, plant-based, and biodegradable compounds. Green chemistry initiatives, such as labs, use new biotechnology methods and sustainable cosmetic ingredients, supporting growth. The other major growth opportunities are high-growth products like niacinamide and hyaluronic acid demand, advanced and protective skincare, and regional growth opportunities, especially in the US and Mexico, propelling growth.
Segmental Insights
Type Insights
The surfactants segment dominated the market with a 35.8% share in 2025 and is expected to grow at a CAGR of 4.70% over the forecast period, driven by the growing consumer demand for sulfate-free, mild, and clean beauty formulations and by non-ionic and bio-based natural surfactants fueling the growth of the market. Surfactants are extensively used, as they play key roles as active cleansing, foaming, and emulsifying agents in the formulation of personal care products. Key application areas of surfactants are skincare and haircare, which further increases production.
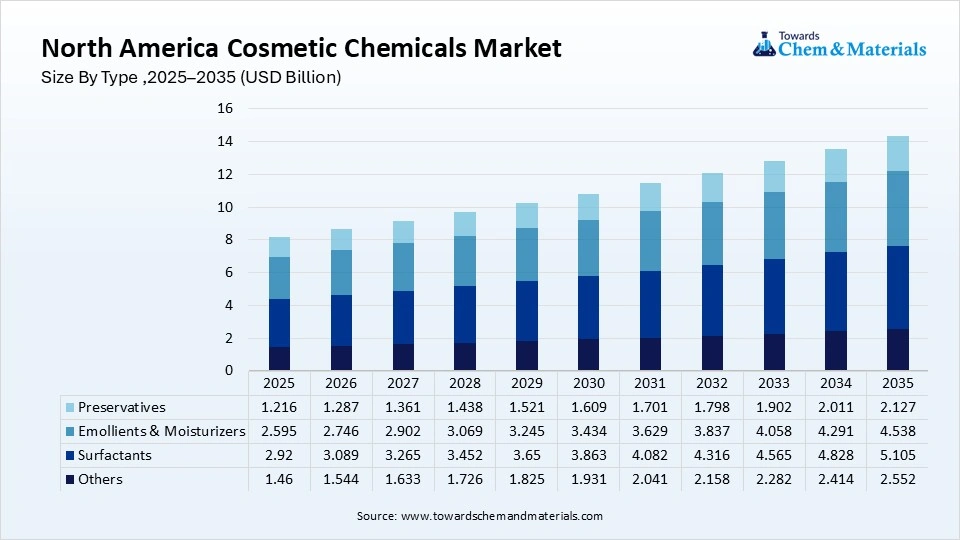
The emollients and moisturizers segment held a 32.1% market share in 2025 and is expected to have the fastest growth with a CAGR of 5.60% in the forecast period, driven by the growing demand for skincare for skin barrier repair and multifunctional property products. The growing preventive skincare habits and shift towards consumer focus on hydration, skin health, and anti-aging support this segment, holding the property made out of plant-based and natural components following the expansion of the market. The emollients work by smoothing and softening the skin by effectively filling the gaps between skin cells and forming a protective layer, which reduces water loss.
North America Cosmetic Chemicals Market Share, By Type, 2025 (%)
| By Type | Market Share (%) |
| Surfactants | 36% |
| Emollients & Moisturizers | 32% |
| Preservatives | 15% |
| Others | 18% |
Application Insights
The skincare segment dominated the market with a 42.8% share in 2025 and is expected to grow at a CAGR of 5.40% over the forecast period, driven by heavy consumer spending on anti-aging creams, moisturizers, and serums due to rising consumer focus on formulations according to consumer demand. Consumers are actively adopting clean label and clean beauty skincare products, actively avoiding synthetic components, which pushes brands and labels towards bio-based and organic alternatives, supporting growth. High demand for anti-pollution, UV defense, and hydration products for enhancing skincare propels the growth of the market.
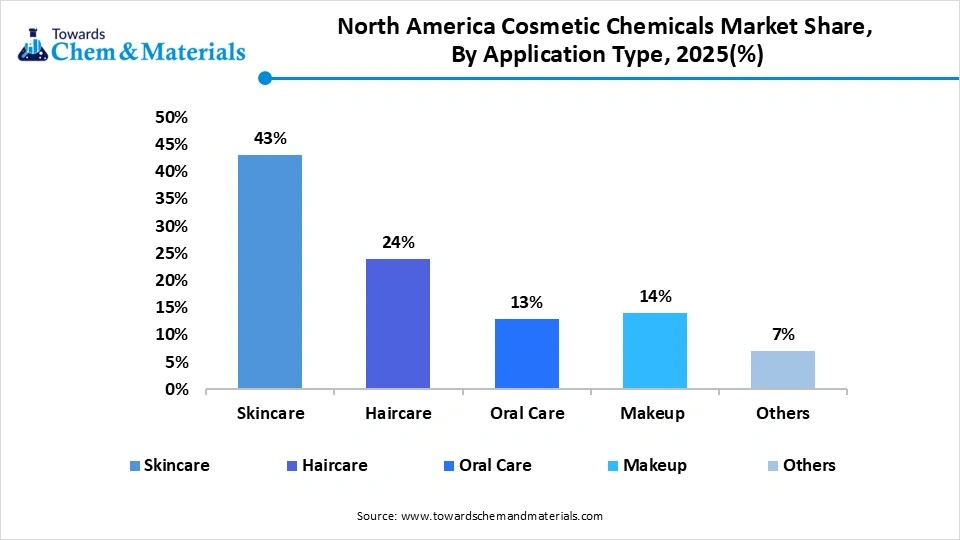
The makeup segment held a 13.5% market share in 2025 and is expected to have the fastest growth with a CAGR of 5.80% in the forecast period, driven by consumers increasing demand for makeup products that are free from synthetic chemicals in the formulation of foundations, lipsticks, and concealers, supporting growth of the market. North America is a dominant hub for cosmetic chemical consumption and higher consumer spending on premium DNA specialty beauty products through hybrid formulations, for which formulators use active chemical ingredients while providing skin-positive benefits.
North America Cosmetic Chemicals Market Share, By Product, 2025 (%)
| By Product | Market Share (%) |
| Skincare | 43% |
| Haircare | 24% |
| Oral Care | 13% |
| Makeup | 14% |
| Others | 7% |
Regional Analysis
How Did the United States Dominate the North American Cosmetic Chemicals Market in 2025?
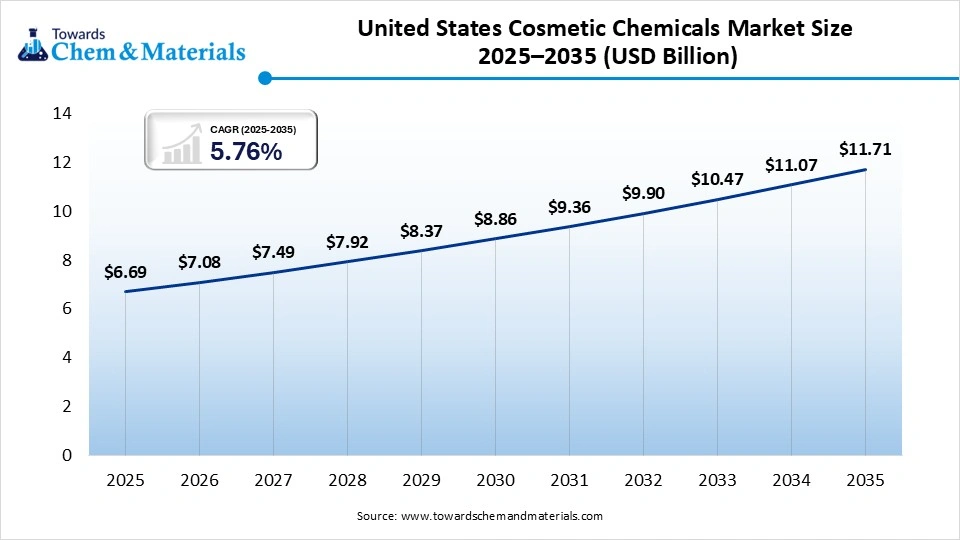
The United States cosmetic chemicals market size was estimated at USD 6.69 billion in 2025 and is projected to reach USD 11.71 billion by 2035, growing at a CAGR of 5.76% from 2026 to 2035. The United States dominated the market with a share of 82.55% in 2025, driven by the growing demand for products that are needed for combination skincare and products that provide protection from the sun or anti-pollution by formulating multifunctional formulations, which drives growth. The growing aging demographic and preventative skincare habits of consumers. Increased demand for clean label products and demand for the use of natural and organic ingredients for clean beauty shifts product demand in the country. The presence of domestic key players in the country, like Dow, DuPont, and Procter & Gamble, plays a major role in the expansion of the market through new and innovative product launches and key collaborations.
Canada Cosmetic Chemicals Market: E-Commerce Expansion
Canadas cosmetic chemicals market size was estimated at USD 0.89 billion in 2025 and is projected to reach USD 1.63 billion by 2035, growing at a CAGR of 6.24% from 2026 to 2035. Canada held a 10.95% market share in the market in 2025, driven by the expanding growth from strong consumer shifts towards clean beauty and natural formulations and ingredient transparency supporting the growth of the market. Strict compliance guidelines by Health Canada push manufacturers to adopt high-purity and safe chemical alternatives for the production of cosmetics according to demand and consumer preferences, expanding the growth of the market. There is growing e-commerce expansion through online retail channels across major urban hubs like Toronto, Vancouver, and Montreal, making specialized and indie cosmetic formulations more accessible to buyers and further supporting growth of the market.
Mexico Cosmetic Chemicals Market: Manufacturing Hub Status
Mexicos cosmetic chemicals market size was estimated at USD 0.57 billion in 2025 and is projected to reach USD 1.06 billion by 2035, growing at a CAGR of 6.40% from 2026 to 2035. Mexico held a 6.50% market share in the market in 2025, driven by increased consumer awareness and rapid urbanization, lifestyle changes, and higher disposable income in the country, which boosts the need and demand for high-performance beauty and personal care products, which fuels the growth. An increasing shift towards natural and organic products, demand, and eco-friendly cosmetic ingredients supports the growth of the market. Major multinational investments such as Unilevers $400 million facility investment in Nuevo León position Mexico as a crucial manufacturing center for North American markets.
Recent Developments
- In October 2025, P2 Science, Inc., launched CitroComplex Nourish, which is designed for next-generation skin and hair care formulations and is a fusion of natural oils and green chemistry. This formulation offers skin barrier and moisture retention by offering a high-performance solution. (Source: www.lbbspecialties.com)
- In February 2026, Savor, a US startup, launched a beauty and personal care range for climate issues caused by other cosmetic topical oils, reducing emissions by 90% compared to tropical oils. (Source: www.lbbspecialties.com)
- In May 2025, Clariant launched Clariant Beauty, which is a milestone in sustainable and high-performance cosmetic solutions featuring sustainable ingredients such as Plantasens Emulsifier HP 49 and Nipaguard SCE VITA. (Source: www.chemicaltoday.in)
Competitive Analysis
The key players in cosmetic chemicals and personal care, like Unilever and Galaxy Surfactants, BASF and IFF, and LBB Specialties and VIZOR, are forming strategic collaborations and joint ventures in North America to scale the production of sustainable surfactants and next-generation ingredient technologies, which supports the growth of the market.
- Unilever and Galaxy Surfactants signed a partnership growth charter to combine Galaxys surfactant science with Unilevers formulation expertise, joining forces in North America to create shared capacity closer to consumers. (Source: www.personalcareinsights.com)
- BASF and IFF formed a strategic partnership to accelerate next-generation enzyme and polymer technologies tailored for personal care and home markets. The collaboration aims to combine both companies expertise to strengthen the growing consumer demand for eco-friendly products. (Source: www.cosmeticsandtoiletries.com)
- Lucas Meyer Cosmetics by Clariant unveiled a dedicated beauty collaboration house near Los Angeles to connect directly with local indie brands, consultants, and contract manufacturers. The collaboration emphasizes consumer demand for innovation in the beauty and personal care sector. (Source: www.indianchemicalnews.com)
- LBB Specialties and VIZOR established an exclusive channel partnership in the United States to supply patented zinc oxide powders and dispersions for personal and sun care markets. This partnership is for the product portfolio, including the Super Zinc, Super Sperse, and Sheer Sperse lines. (Source: www.lbbspecialties.com)
Top players in the North American Cosmetic Chemicals Market & Their Offerings
| Company | Company Type/Position | Major Headquarters | Geographic Presence | Cosmetic Chemicals Offerings | Key Offering/Strength |
| BASF SE | Global specialty chemicals and cosmetic ingredients manufacturer | Ludwigshafen, Germany | North America, Europe, Asia Pacific, Latin America | Surfactants, emollients, UV filters, polymers, active ingredients, and functional ingredients | Broad personal care portfolio with strong formulation expertise and sustainable ingredient development |
| Dow Inc. | Specialty materials and personal care ingredients supplier | Midland, Michigan, USA | North America, Europe, Asia Pacific, Latin America | Silicone-based ingredients, conditioning agents, film formers, polymers, emulsifiers, and texturizers | Strong polymer and silicone technology for skincare, haircare, and color cosmetics |
| Ashland Inc. | Specialty chemicals and functional ingredients manufacturer | Wilmington, Delaware, USA | North America, Europe, Asia Pacific | Rheology modifiers, preservatives, film formers, conditioning agents, emulsifiers, and biofunctional ingredients | Strong personal care portfolio with emphasis on functional and nature-derived ingredients |
| Evonik Industries AG | Specialty chemicals and cosmetic ingredients producer | Essen, Germany | North America, Europe, Asia Pacific, Latin America | Emollients, emulsifiers, ceramides, peptides, surfactants, and active ingredients | Advanced cosmetic actives and functional ingredients supported by biotechnology and formulation expertise |
| Croda International Plc | Specialty chemicals and beauty ingredients manufacturer | Snaith, United Kingdom | North America, Europe, Asia Pacific, Latin America | Emollients, emulsifiers, surfactants, active ingredients, specialty lipids, and conditioning agents | Strong expertise in high-performance, sustainable, and naturally derived cosmetic ingredients |
Other Top Players Are
- Clariant International Ltd.
- Lubrizol Corporation
- Solvay S.A.
- Symrise AG
- dsm-firmenich
- Givaudan Active Beauty
- Lonza Group AG
- AkzoNobel N.V.
- Elementis plc
- Innospec Inc.
- Wacker Chemie AG
- Seppic
- Brenntag North America
- Momentive Performance Materials
- Kobo Products
Segments Covered:
By Type
- Surfactants
- Anionic
- Cationic
- Nonionic
- Amphoteric
- Emollients & Moisturizers
- Plant-based oils
- Esters
- Silicones
- Humectants
- Preservatives
- Organic acids
- Parabens
- Phenolic preservatives
- Multifunctional preservatives
- Others
- Emulsifiers
- Conditioning agents
- UV filters
- Colorants
- Fragrance ingredients
- Rheology modifiers
By Application
- Skincare
- Facial care
- Body care
- Sun care
- Anti-aging products
- Haircare
- Shampoo
- Conditioner
- Hair styling
- Hair color
- Oral Care
- Toothpaste
- Mouthwash
- Oral gels
- Makeup
- Foundation
- Lip products
- Eye makeup
- Face powders
By Regions
- U.S.
- Canada
- Mexico
- Rest of North America
A Seven-Phase Framework
Our methodology is designed to be universally applicable across commodity chemicals, specialty chemicals, petrochemicals, construction chemicals, coatings, electronic chemicals, industrial gases, agrochemicals, water treatment chemicals, and performance materials. Each phase builds upon the last, creating a layered validation structure that minimizes estimation error and maximizes analytical confidence.
The framework ensures comprehensive market coverage, robust cross-validation, and reliable long-term forecasting — producing market estimates that withstand scrutiny from investors, regulators, and corporate strategy teams.

Seven-Phase Framework — Analytical Effort Distribution
Relative analytical effort allocated across each phase of the Chemicals & Materials research framework

Phase 1 - Secondary Research: Establishing the Foundation
Secondary research collects and evaluates publicly available information from authoritative sources, establishing the foundational understanding of market structure, value chain dynamics, competitive landscape, and end-use demand patterns. Every source is evaluated for credibility, recency, geographic relevance, and methodological soundness before inclusion.
Industry Associations
Sources include ACC, CEFIC, ICCA, JCIA, CPCIF, and SOCMA providing production volumes, consumption trends, capacity developments, and sustainability initiatives.
Company Disclosures
Annual reports, investor presentations, earnings transcripts, and regulatory filings reveal product portfolios, manufacturing footprints, capacity expansions, and revenue segmentation.
Government Databases
National statistical offices, customs authorities, environmental agencies, and industrial production databases provide verified statistics on output, trade flows, and regulatory compliance.
Trade Databases
UN Comtrade, ITC, Eurostat, and national customs authorities enable assessment of global product movement, import dependency, and export competitiveness across regions.
Our Secondary Research Sources
- Ministry of Chemicals and Fertilizers
- European Chemicals Agency
- United States Department of Energy
- Ministry of Industry and Information Technology
- Ministry of Economy Trade and Industry
- Ministry of Trade Industry and Energy
- National Institute of Standards and Technology
- Council of Scientific and Industrial Research
- Fraunhofer Society
- National Institute for Materials Science
Phase 2 — Supply-Side Assessment: Mapping Production Capabilities
Production Capacity Analysis
All major manufacturers are assessed for existing installed capacity, planned additions, expansions, new plant announcements, and technology adoption — mapped at global, regional, and country levels.
Capacity Utilization Adjustment
Installed capacity is adjusted using utilization rates based on demand conditions, feedstock availability, plant operating rates, maintenance schedules, and regulatory restrictions.
Manufacturer Revenue Analysis
Product-specific revenues, segment-level performance, regional distribution, average selling prices, and margin trends are evaluated to establish market value estimates.
Supply-Side Assessment — Capacity vs. Effective Production by Region
Illustrative comparison of installed capacity vs. effective production volume (after utilization rate adjustment) across major regions

Phase 3 — Demand-Side Assessment: Quantifying Chemical Consumption
Demand-side analysis quantifies chemical consumption across industries, applications, and geographies — identifying where and how chemicals are consumed throughout the value chain with precision.
End-Use Industry Analysis
Chemical demand is evaluated across automotive, construction, packaging, electronics, agriculture, healthcare, consumer goods, industrial manufacturing, energy and utilities, and water treatment. Industry output, production trends, and consumption intensity are analyzed to determine demand patterns.
Consumption Modeling
Demand is estimated using measurable indicators: kilograms per vehicle, kilograms per square meter of construction, dosage per cubic meter of water treated, kilograms per hectare of agricultural land, and kilograms per ton of manufactured products. Consumption factors are validated through industry publications and primary interviews.
Application Analysis
The market is segmented by application area to understand product performance requirements, formulation trends, technology adoption, customer preferences, and regulatory requirements improving demand accuracy and segmentation granularity.
Demand-Side Assessment — End-Use Industry Demand Distribution
Illustrative distribution of chemical & materials demand across key end-use industries

Phase 4 - Trade Flow Analysis: Balancing Regional Supply and Demand
Trade flow analysis reconciles regional supply and demand estimates through import and export data, identifying net supply positions, regional dependencies, and market imbalances. It serves as an independent validation layer that tests the consistency of supply-side and demand-side estimates.
Import Analysis
Import data is evaluated to determine volumes, source countries, product dependency, regional supply gaps, and pricing trends — identifying markets that rely heavily on external supply and where domestic production is insufficient to meet demand.
Export Analysis
Export assessments reveal production surplus, export competitiveness, regional manufacturing strength, and global market participation. Export patterns also help validate domestic production estimates and identify net exporting regions.
Apparent Consumption Model
Regional consumption is assessed using the standard apparent consumption formula:
Results identify net importing regions, net exporting regions, regional deficits, and surpluses — serving as an independent validation of supply and demand estimates.
Trade Flow Analysis — Net Supply Position by Region
Illustrative apparent consumption vs. domestic production across major regions — positive gap indicates net import dependency

Phase 5 — Primary Research: The Critical Validation Layer
Primary research tests and refines findings from secondary research through direct engagement with industry participants across the supply chain, demand side, and expert community. It captures intelligence that no database or published report can provide — the real-world experience of manufacturers, buyers, and specialists operating in the market.

Supply-Side Interviews
Conversations with chemical manufacturers, raw material suppliers, contract manufacturers, technology providers, and plant operators cover production trends, capacity utilization, pricing developments, technology shifts, and competitive dynamics.

Demand-Side Interviews
Engagement with OEMs, industrial consumers, procurement managers, distributors, formulators, and end-use manufacturers focuses on consumption trends, purchasing behavior, product substitution, demand outlook, and emerging applications.

Industry Expert Consultations
Additional interviews with industry consultants, independent experts, regulatory specialists, technical professionals, and research institutions provide deeper market context and validate key analytical assumptions.
Focus Areas of Primary Research:
Market Size & Forecast Validation
Revenue estimates, volume consumption, growth rates, forecast assumptions, regional demand.Supply Chain & Value Chain Assessment
Raw material sourcing, supply chain challenges, distribution networks, procurement practices.Production & Capacity Analysis
Manufacturing capacity, utilization rates, expansion projects, plant investments.Pricing & Cost Structure Analysis
Product pricing trends, feedstock costs, energy costs, margin pressures, pricing outlook.Competitive Landscape Assessment
Volume and value estimates confirmed to be fully consistent with one another before publicationInterview Volume by Market Scope
| Study Scope | Number of Interviews |
|---|---|
| Niche Market | 20 – 30 |
| Mid-Sized Market | 30 – 50 |
| Global Market | 50 – 80 |
| Highly Fragmented Market | 80 – 120 |
Interview Details:
Category : Manufacturers, Suppliers, Distributors, End Users, Experts/Associations
Average Duration : 30–60 Minutes
Interview Mode : Video calls, telephonic interviews, expert consultations
Interview Format : Structured / Semi-Structured questionnaire
Focus Areas of Primary Research:
Market Size & Forecast Validation :
Revenue estimates, volume consumption, growth rates, forecast assumptions, regional demand.
Supply Chain & Value Chain Assessment :
Raw material sourcing, supply chain challenges, distribution networks, procurement practices.
Production & Capacity Analysis :
Manufacturing capacity, utilization rates, expansion projects, plant investments.
Pricing & Cost Structure Analysis :
Product pricing trends, feedstock costs, energy costs, margin pressures, pricing outlook.
Competitive Landscape Assessment :
Market share, competitor positioning, strategic initiatives, partnerships, acquisitions.
Primary Research — Stakeholder Coverage by Category
Distribution of interview respondents across stakeholder categories (% share from PPT data)

Primary Research — Respondent Designation Profile
Seniority breakdown of interview respondents (% share from PPT data)

Primary Research — Geographic Coverage of Interviews
Regional distribution of primary research engagement (% share from PPT data)

Phase 6 — Data Triangulation and Market Validation
No single methodology is relied upon in isolation. Multiple independent estimation approaches are combined and reconciled to ensure consistency, accuracy, and analytical defensibility. Any material deviations between approaches are investigated and adjusted through additional validation cycles.
The final market size is derived through weighted triangulation of all validated methodologies. Any material deviations between approaches are investigated and adjusted through additional validation cycles. The outcome represents the most realistic assessment of the market based on available evidence and expert confirmation ensuring that volume and value estimates are fully consistent with one another.
Triangulation Framework — Input Contribution Weight
Relative weight each sizing input contributes to the final reconciled market estimate

Phase 7 — Forecast Modeling: Projecting Future Market Evolution
Forecasting evaluates the future trajectory of the market using a combination of quantitative indicators and qualitative assessments across economic, industry, and regulatory dimensions. Rather than simple extrapolation, each driver is independently modeled and integrated into a composite forecast.
Macroeconomic Indicators
GDP growth, industrial production, manufacturing output, construction activity, consumer spending, and capital investment form the quantitative foundation of long-term demand projections. These are applied at country, regional, and global levels.
Industry Growth Drivers
Urbanization, infrastructure development, industrialization, technological innovation, sustainability initiatives, and evolving product performance requirements are assessed at regional and industry levels — capturing both structural and cyclical demand drivers.
Capacity Expansion Analysis
Announced plant expansions, new manufacturing facilities, technology upgrades, and strategic investments are evaluated to determine future supply-demand dynamics and potential market tightness or oversupply situations.
Regulatory & Sustainability
Environmental regulations, chemical safety standards, emission reduction targets, circular economy initiatives, and sustainability requirements are incorporated as they often influence product adoption rates and market growth trajectories.
Scenario Forecast Range — Indexed Market Growth (Year 1–10)
Illustrative indexed growth trajectories across Base, Optimistic, and Pessimistic scenarios over a 10-year forecast horizon

Forecast Drivers — Relative Impact Score by Category
Impact score (0–100) of each driver type on chemicals & materials market forecast




Comments
Share your thoughts, ask a question, or provide feedback about this report.