
What is the Explosives & Pyrotechnics Market Size and Share?
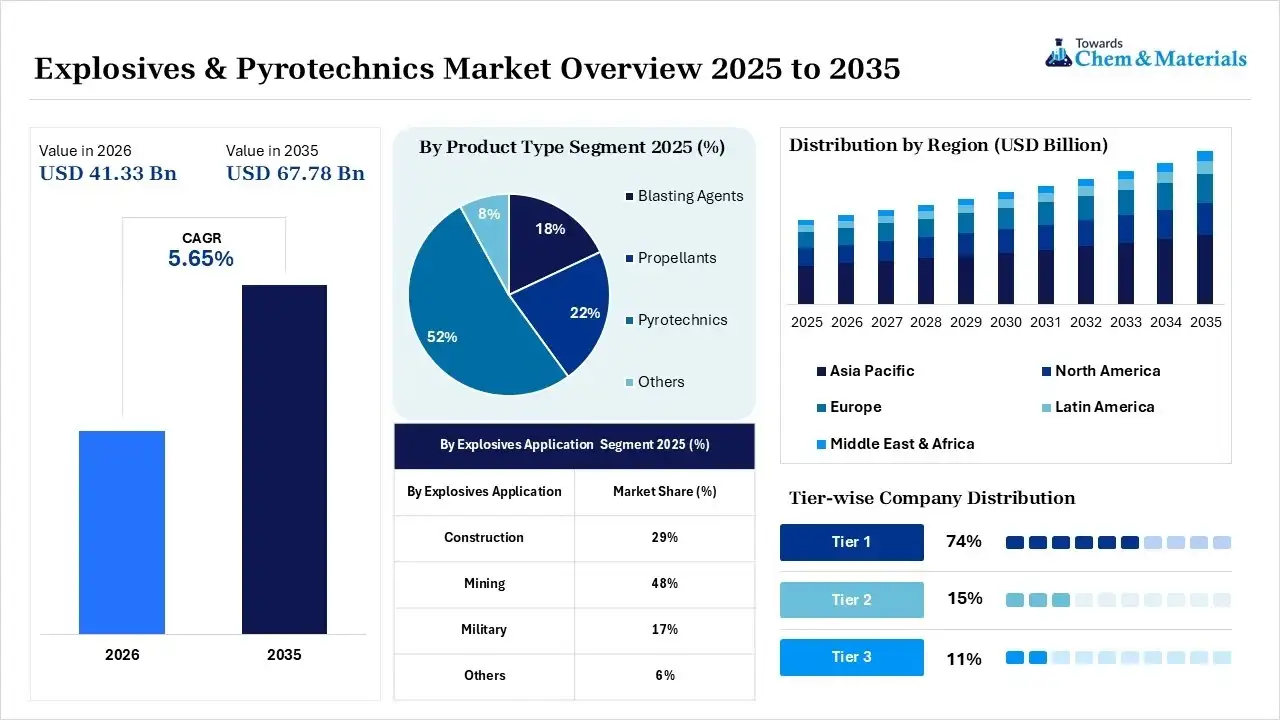
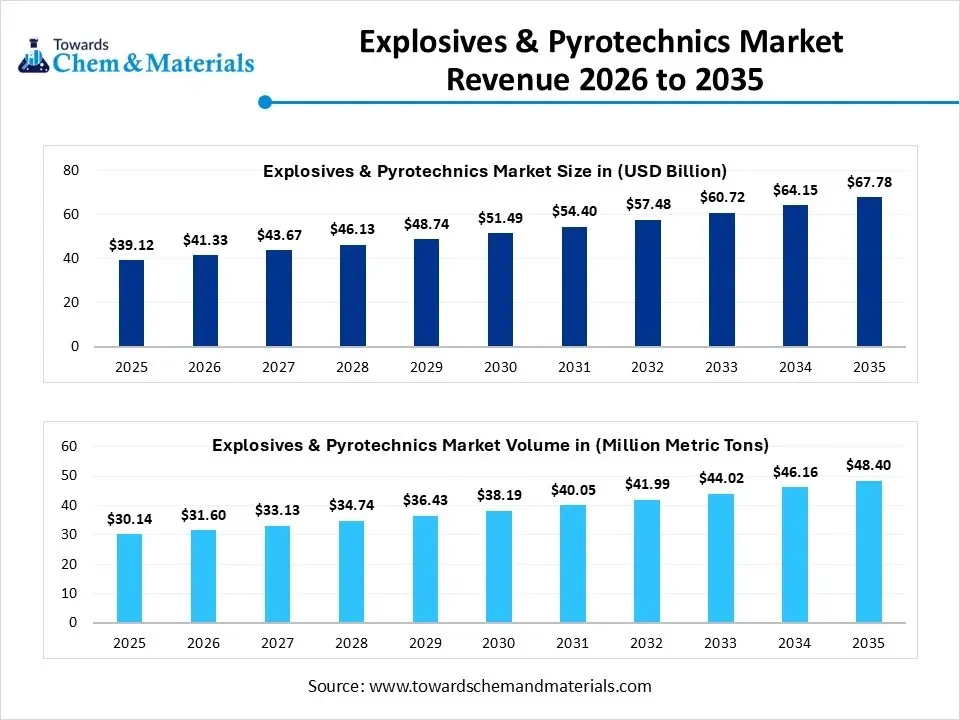
The global explosives & pyrotechnics market size was valued at USD 39.12 billion in 2025, is estimated to reach USD 41.33 billion in 2026, and is projected to reach USD 67.78 billion by 2035, exhibiting a compound annual growth rate (CAGR) of 5.65% over the forecast period from 2026 to 2035.Asia Pacific dominated the explosives & pyrotechnics market with the largest revenue share of 41% in 2025 and is expected to grow at the fastest CAGR of 5.78% during the forecast period. Increasing product demand from the mining sector is the key factor driving market growth. Also, ongoing infrastructure development and military modernization coupled with the technological innovations in the production process can fuel market growth further.
 Market Highlights
- By region, Asia Pacific dominated the market with the largest share of 41% in 2025. The dominance of the region can be attributed to the extensive coal and mineral extraction.
- By region, North America held the market share of 24% in 2025 and was expected to grow at the fastest CAGR of 6.4% over the forecast period. The growth of the region can be linked to the rapid growth of mining operations.
- By product, the pyrotechnics segment dominated the market with the largest share of 52% in 2025. The dominance of the segment can be attributed to the growing fireworks demand for entertainment purposes.
- By product, the blasting agents segment held a market share of 18% in 2025 and is expected to grow at the fastest CAGR of 6.4% over the forecast period. The growth of the segment can be credited to the government investment supporting market growth.
- By explosive application, the mining segment dominated the market with the largest share of 48% in 2025. The dominance of the segment can be linked to the rapid surge in mineral expansion.
- By explosive application, the construction segment held a market share of 29% in 2025 and is expected to grow at the fastest CAGR of 6.7% over the forecast period. The growth of the segment can be driven by a rise in infrastructure expansion.
- By pyrotechnics application, the consumer pyrotechnics segment dominated the market with the largest share of 46% in 2025. The dominance of the segment is due to expanding seasonal celebrations across the globe.
- By pyrotechnics application, the proximate pyrotechnics segment held the market share of 18.00% in 2025 and is expected to grow at the fastest CAGR of 6.5% during the forecast period. The growth of the segment is owing to the increasing demand from the concert and entertainment industries.
According to Towards Chemicals and Materials Analytics and Consulting, the global explosives & pyrotechnics market volume was valued at 30.14 million metric tons in 2025 and is expected to surpass around 48.40 million metric tons by 2035, accelerating a compound annual growth rate (CAGR) of 4.85% over the forecast period from 2026 to 2035.
 Growth of Mining and Infrastructure Projects Supports Market Growth
The market benefits from the ongoing growth of mining and infrastructure development across the globe, presenting lucrative opportunities in the market. Infrastructure projects like tunnels, highways, dams, and railways need controlled operational efficiency.
- In November 2025, the UK Ministry of Defense has identified 13 potential sites for new munitions and energetics factories, marking a significant £1.5bn strategic investment. This initiative aims to establish an "always on" domestic supply chain for military explosives, creating at least 1,000 skilled jobs.(Source: www.gov.uk)
Government and major market players heavily investing in resource development and construction, sustaining persistent demand for commercial explosives.
Market Trends
- Technological advancements: The growing technological advancements to create an environment-friendly, safer, and efficient solution help in the market growth. The advancements, like digital blasting systems, smart explosives, integration of AI electronic detonators, and nano-explosives, enhance safety.
- The growing mining sector: The growing demand for underground and open-pit mining operations for geological surveys, rock fragmentation, and mineral extraction increases demand for explosives.
- The growing spending on the military and defense sector: The increasing spending on military applications increases demand for explosives and pyrotechnics. The growing tactical operations, ammunition bombs, signaling, weapon systems, and demolition fuel demand for explosives & pyrotechnics.
Report Scope
| Report Attributes | Details |
| Market Size in 2026 | USD 41.33 Billion/ 31.60 Million Metric Tons |
| Expected Size by 2035 | USD 67.78 Billion/ 48.40 Million Metric Tons |
| Growth Rate from 2025 to 2035 | CAGR 5.65% |
| Base Year of Estimation | 2025 |
| Forecast Period | 2025 - 2035 |
| High Impact Region | Asia Pacific |
| Segment Covered | By Product, By Explosives Application, By Pyrotechnics Application, By Region |
| Key Companies Profiled | Dyno Nobel (Incitec Pivot), EPC Groupe, Sasol Limited, Hanwha Corporation, Austin Powder Company, Orica Limited, MAXAM Corp., AEL Mining Services, ENAEX, Solar Industries India |
Supply Chain Analysis of the Explosives & Pyrotechnics Market
Production & Processing
- It involves the chemical synthesis, mixing, and packaging of essential materials into finished blasting agents or pyrotechnic compositions. These are crucial for construction, mining, defense, and commercial entertainment. The industry also features heavy chemical manufacturing and strict regulatory compliance.
- Chemring Group: Leading global producer of advanced energetic materials and pyrotechnics.
- Other Key Players: Melrose Pyrotechnics, Zambelli Fireworks
Quality Testing and Certification
- The procedure ensures that hazardous energetic formulations, including propellants, explosives, and commercial fireworks, comply with stringent UN and global defense handling and transportation mandates before they are deployed for commercial use. It also determines how energetic materials degrade at high temperatures.
- Orica Mining Services: Headquartered in Australia, it is the worlds largest provider of commercial explosives and advanced blasting systems for mining and construction.
- Other Key Players: Titanobel SAS, Chemring Group
Distribution to Industrial Users
- It manages the logistics, handling, and delivery of explosives, blasting agents, and pyrotechnics for major industrial end-users. The highly regulated environment mandates absolute compliance with safety protocols, strict adherence to delivery timelines, and maximized logistical efficiency.
- Dyno Nobel (Incitec Pivot Limited): A major supplier of commercial explosives and blasting services, with a strong foothold in North America and the Asia-Pacific region.
- Other Key Players: Sasol Limited, Austin Powder Company
Market Opportunity
The Growing Demand From the Entertainment Industry
The growing demand for entertainment increases the adoption of explosives and pyrotechnics. The pyrotechnics are widely used in entertainment events like cultural events, shows, and concerts. The growing celebrations of various festivals and events increase demand for fireworks, which increases demand for pyrotechnics. The growing live shows like concerts, theatre, and comedy shows increase demand for visually impressive displays, fueling the adoption of specialized pyrotechnics products. The growing entertainment events in hotels fuels the adoption of fireworks to entertain customers.
The various sports events like IPL, football, WWE, and kabaddi have opening ceremonies which increase demand for smoke, explosions, and flames. The growing demand for special effects in television series and film fuels the adoption of various pyrotechnic products like fires, explosions, and other products. The launch event of various shows fuels demand for pyrotechnics to gain media attention. Events like outdoor shows, award ceremonies, festivals, and film festivals increase demand for pyrotechnics. Celebrations like New Year’s Eve and Diwali increase the adoption of pyrotechnics. The growing entertainment industry creates opportunities for the explosives & pyrotechnics market.
Market Challenge
Environmental Concerns Limit the Adoption of Explosives & Pyrotechnics
Despite several advantages of explosives and pyrotechnics, the growing environmental concerns restrict the market growth. Environmental concerns like noise pollution, water pollution, wildlife impacts, soil contamination, and air pollution are growing. Fireworks release various pollutants like nitrogen, carbon dioxide, sulfur dioxide, and carbon monoxide into the atmosphere, and this causes adverse effects on the environment and human health. In the mining process, blasting releases toxic gases. Explosives & pyrotechnics contaminate water & soil and cause harm to aquatic life.
The oxidizing agents, like perchlorate, used in explosives, cause water pollution and harm to aquatic life. Explosive releases various metals like iron, lead, and copper, which pose harm to the soil and lower its fertility of soil. The high noise of explosives and fireworks can cause noise pollution and harm wildlife. The growing environmental concerns hamper the growth of the explosives & pyrotechnics market.
Regional Insights
How Did Asia Pacific dominate the Explosives & Pyrotechnics Market in 2025?
The Asia Pacific explosives & pyrotechnics market size was estimated at USD 16.04 billion in 2025 and is projected to reach USD 28.13 billion by 2035, growing at a CAGR of 5.78% from 2026 to 2035.Asia Pacific dominated the market with the largest share of 41% in 2025. The dominance of the region can be attributed to the extensive coal and mineral extraction, substantial infrastructure development, and escalating defense budgets in emerging economies. In addition, robust infrastructure development drives the demand for raw materials like iron ore and limestone, which in turn boosts the adoption of industrial explosives to increase extraction, hence fueling overall market growth soon.

China
- Chinas massive coal, copper, iron ore, and precious metals extraction sectors need bulk and cartridge explosives for continuous rock and mineral excavation.
- The countrys infrastructure investments and the Belt and Road Initiative (BRI) encourage exports of industrial explosives and related technical services across Asia and Africa.
North America held the market share of 24% in 2025 and was expected to grow at the fastest CAGR of 6.4% over the forecast period. The growth of the region can be linked to the rapid growth of mining operations, infrastructure development, and defense procurement, along with the entertainment events. Continuous procurement investments by North American defense departments in advanced propellants, munitions, and high-yield compounds such as RDX fuel steady market growth further.
United States
- Ongoing federal investments in highways, bridges, and tunnels require aggressive rock blasting and commercial demolition operations, leading to market growth.
- Stringent compliance requirements enforced by the ATF and OSHA compel manufacturers to develop safer, more precise digital detonation technologies.
Canada
- Canada’s unique geographic challenges create niche demands, such as pyrotechnic devices used in avalanche control in mountainous regions.
- Ongoing government contracts for tactical operations, weapon systems, and ammunition drive steady demand for high-grade explosives.
Europe held the market share of 20% in 2025. The growth of the region can be credited to the ongoing growth of infrastructure projects, such as road construction, building projects, and tunneling, which increases demand for explosives. Also, elevated geopolitical tensions and the implementation of extensive NATO armament initiatives have driven a significant escalation in the global demand for advanced high-performance explosives, such as RDX.
Germany
- European defense budget expansions fuel strong demand for high-performance explosives utilized in advanced weapons systems.
- Pyrotechnic demand is significantly propelled by Germanys robust schedule of international fairs, sports events, and cultural festivals.
France
- Strict EU environmental mandates force market players to innovate. The French market is increasingly demanding non-toxic explosive compounds and eco-friendly, low-smoke pyrotechnics.
- The growing adoption of smart, digitally controlled electronic detonators allows for safer, highly precise blasting with reduced environmental vibration.
Latin America held a market share of 9% in 2025. The growth of the region can be driven by growing adoption of precision blasting technologies and the presence of large-scale infrastructure projects. The mining industry is actively transitioning toward emulsion explosives and electronic initiation systems. These high-precision technologies tackle operational downtime and enhance occupational safety in both open-pit and underground environments.
Brazil
- Government and private-sector investments in transportation corridors, tunneling, and rock excavation fuel ongoing demand for bulk blasting agents.
- Regional geopolitical shifts and modernization programs have optimized an increase in military spending, driving the adoption of high-performance energetic compounds (like RDX).
Argentina
- Ongoing public works, including urban expansion, tunneling, and transportation networks, significantly drives the demand for commercial rock-blasting explosives.
- The entertainment and pyrotechnics sector is propelled by regional festivals, holidays, and tourism-related events, remaining a steady and lucrative segment.
The Middle East & Africa held a market share of 6% in 2025. The growth of the region can be attributed to the growing copper and cobalt extraction projects in major countries like the Democratic Republic of Congo (DRC), Zambia, and Ghana. Furthermore, the implementation of digital and electronic detonation systems allows operators to enhance operational safety, mitigate the risk of misfires, and strictly comply with regulatory vibration limits during urban blasting operations.

Saudi Arabia
- Saudi Arabia remains one of the top five defense spenders globally. The continuous need for tactical operations, ammunition, and weapon systems drives country growth soon.
- The market is adopting digital ignition systems, AI-integrated electronic detonators, and programmable timing.
- These innovations improve safety, minimize ecological disruption, and allow precision blasting near urban areas.
UAE
- The UAE’s reliance on deep drilling and perforation explosives for its upstream energy sector represents a highly lucrative, specialized segment within the expanding market.
- The market is increasingly adopting digital blasting systems, smart electronic detonators, and "green" pyrotechnics that minimize smoke and environmental impact.
Segmental Insights
Product Insights
The pyrotechnics segment dominated the explosives & pyrotechnics market share 52% in 2025. The growing demand for entertainment purposes like sports events, festivals, concerts, and celebrations increases demand for pyrotechnics. The growing demand from the tourism industry for applications like visual display and fireworks helps in the market growth. The growing cultural festivals and personal celebrations increase demand for pyrotechnics. The growing demand for special effects in entertainment venues, movies, and theatre drives market growth. The growing demand for military applications like training exercises, signaling, and creating visual effects contributes to the overall growth of the market.
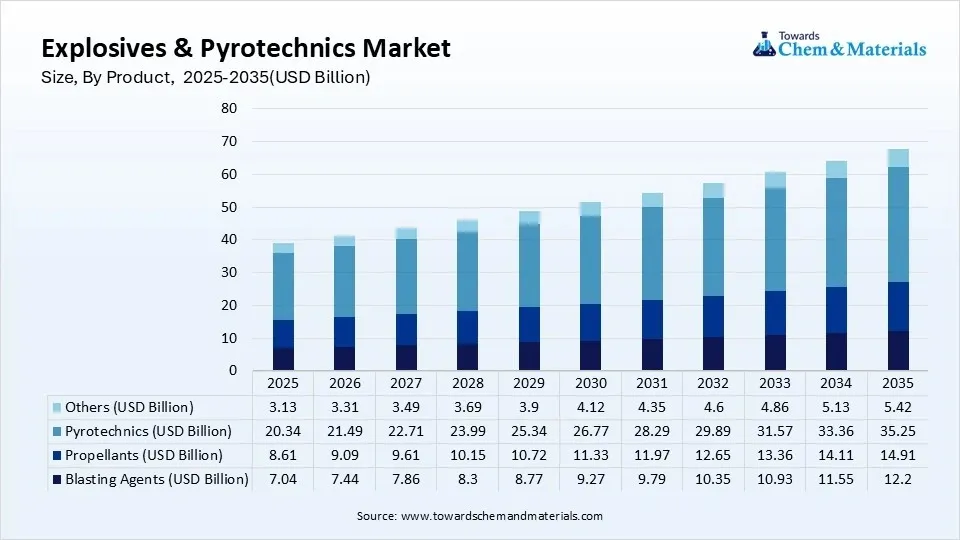 The blasting agents segment is significantly growing in the market during the forecast period. The growing development of construction and infrastructure projects, like dam building, road construction, and many more, increases demand for blasting agents to break down rock and earth. The growing mining industry and the extraction of minerals like coal, minerals help in the market growth. The growing demand for controlled demolition of structures, buildings, and other construction projects increases demand for blasting. The rapid urbanization and industrial project developments fuel demand for blasting agents. Additionally, growing environmental concerns and the development of environment-friendly blasting agents drive the overall growth of the market.
Explosives & Pyrotechnics Market Share, By Product,2025(%)
| By Product | Market Share (%) |
| Blasting Agents | 18% |
| Propellants | 22% |
| Pyrotechnics | 52% |
| Others | 8% |
Explosives Application Insights
The mining segment led the explosives & pyrotechnics market share 48% in 2025. The growing demand for mining operations like blasting and drilling to extract ores & minerals helps in the market growth. The growing development of infrastructure projects like bridges and roads increases demand for mining operations. The growing demand for various metals and minerals fuels demand for mining operations. The growing demand for underground and surface mining operations drives the market growth. Technological advancements in explosive materials and blasting techniques increase demand for effective mining operations. The growing mining industry, particularly in the Asia Pacific region, supports the overall growth of the market.
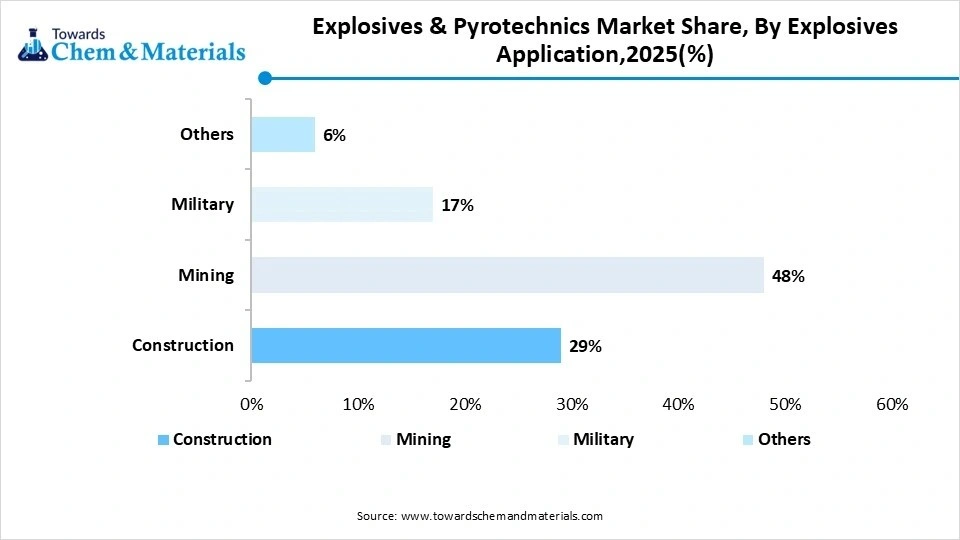
The construction segment expecting the fastest grow in the market during the forecast period. The worldwide infrastructure development, like utilities, roads, and buildings, increases demand for explosives for various applications like demolition, rock removal, and excavation. The growing urbanization and rapid population growth increase demand for construction projects like commercial, residential, and infrastructural, fueling demand for explosives. The governments strong investment in infrastructure projects increases demand for construction, which fuels the adoption of explosives. The growing large-scale construction projects increase demand for time-saving & cost-effective solutions, driving the overall growth of the market.
Explosives & Pyrotechnics Market Share, By Explosives Application,2025(%)
| By Explosives Application | Market Share (%) |
| Construction | 29% |
| Mining | 48% |
| Military | 17% |
| Others | 6% |
Pyrotechnics Application Insights
The consumer pyrotechnics segment dominated the explosives & pyrotechnics market share 46% in 2025. The growing demand for consumer goods like oxygen candles increases demand for pyrotechnics. The growing celebrations of cultural and traditional events help the market growth. The growing demand for entertainment during celebrations, holidays, and weddings increases demand for fireworks. The growing adoption of flares for safety & signaling helps in the market growth. The growing disposable incomes increase demand for pyrotechnics for the celebration of events. Technological advancements in pyrotechnics, like digitally controlled displays, drive market growth. The growing demand for sparklers, safety matches, oxygen candles, distress flares & smoke bombs, and easy accessibility through online platforms and retail stores support the market growth.
The proximate pyrotechnics segment is the fastest growing in the market during the forecast period. The growing demand from military operations like crowd control, signaling, and illumination increases demand for proximate pyrotechnics. The growing advancements in proximate to enhance duration, safety, and brightness help in the market growth. The growing entertainment industry, like festivals, sports, and concerts, increases demand for proximate pyrotechnics. The growing celebrations of weddings, engagements, and birthdays fuel demand for proximate pyrotechnics. The growing demand from the Asia Pacific countries like India and China contributes to the overall market growth.
Explosives & Pyrotechnics Market Share, By Pyrotechnics Application,2025(%)
| By Pyrotechnics Application | Market Share (%) |
| Consumer Pyrotechnics | 46% |
| Proximate Pyrotechnics | 18% |
| Display Pyrotechnics | 28% |
| Others | 8% |
Recent Developments
- In January 2025, Pyroemotions Ltd launched a record-breaking fireworks display by drones to kick off the new year celebrations. The fireworks launched in Lusail, Qatar, and the display consisted of 500 drones to form various shapes. Each drone is controlled by a special radio firing system, and the display lasted for 10 minutes.Display created Lusail city symbol, and spectacular images of the cylinder, spiral. Display awarded by a Guinness World Records certificate. (Source: guinessworldrecords )
- In April 2025, BAE Systems develops a new explosive without the use of nitrocellulose and nitroglycerin. The company invested more than £150 million in the expansion of production infrastructure and utilizes a continuous flow process to develop explosives. (Source: militarnyi.com)
- In April 2026, Pune-based defense technology startup Sagar Defence Engineering, founded by Nikunj Parashar, confirmed that it has obtained an industrial license to manufacture explosives and ammunition. The licensed production will take place at facilities in Maharashtra and Andhra Pradesh. This development marks a significant diversification of the companys operational portfolio beyond its core autonomous systems business.(Source: www.indiasentinels.com)
Top Companies List

- Dyno Nobel (Incitec Pivot)
- EPC Groupe
- Sasol Limited
- Hanwha Corporation
- Austin Powder Company
- Orica Limited
- MAXAM Corp.
- AEL Mining Services
- ENAEX
- Solar Industries India
Segments Covered in the Report
By Product
- Blasting Agents
- ANFO (Ammonium Nitrate Fuel Oil)
- Emulsion Explosives
- Water Gel Explosives
- Bulk Explosives
- Propellants
- Solid Propellants
- Liquid Propellants
- Composite Propellants
- Double-Base Propellants
- Pyrotechnics
- Consumer Fireworks
- Professional Display Fireworks
- Signal & Safety Pyrotechnics
- Stage & Entertainment Pyrotechnics
- Others
- Detonators
- Igniters
- Initiating Devices
- Specialty Energetic Materials
By Explosives Application
- Construction
- Tunnel Excavation
- Road Construction
- Dam Construction
- Urban Demolition
- Mining
- Surface Mining
- Underground Mining
- Quarrying
- Military
- Ammunition
- Missile Systems
- Demolition Operations
- Others
- Oil & Gas Exploration
- Seismic Survey
- Avalanche Control
By Pyrotechnics Application
- Consumer Pyrotechnics
- Firecrackers
- Sparklers
- Aerial Fireworks
- Proximate Pyrotechnics
- Stage Effects
- Concert Effects
- Indoor Events
- Display Pyrotechnics
- Public Fireworks Displays
- Festival Fireworks
- Sports Events
- Others
- Marine Signals
- Emergency Flares
- Military Signaling
By Region
- North America
- U.S.
- Canada
- Europe
- Germany
- UK
- France
- Italy
- Spain
- Sweden
- Denmark
- Norway
- Asia Pacific
- China
- Japan
- India
- South Korea
- Thailan
- Latin America
- Brazil
- Mexico
- Argentina
- Middle East & Africa
- South Africa
- UAE
- Saudi Arabia
- Kuwait
A Seven-Phase Framework
Our methodology is designed to be universally applicable across commodity chemicals, specialty chemicals, petrochemicals, construction chemicals, coatings, electronic chemicals, industrial gases, agrochemicals, water treatment chemicals, and performance materials. Each phase builds upon the last, creating a layered validation structure that minimizes estimation error and maximizes analytical confidence.
The framework ensures comprehensive market coverage, robust cross-validation, and reliable long-term forecasting — producing market estimates that withstand scrutiny from investors, regulators, and corporate strategy teams.

Seven-Phase Framework — Analytical Effort Distribution
Relative analytical effort allocated across each phase of the Chemicals & Materials research framework

Phase 1 - Secondary Research: Establishing the Foundation
Secondary research collects and evaluates publicly available information from authoritative sources, establishing the foundational understanding of market structure, value chain dynamics, competitive landscape, and end-use demand patterns. Every source is evaluated for credibility, recency, geographic relevance, and methodological soundness before inclusion.
Industry Associations
Sources include ACC, CEFIC, ICCA, JCIA, CPCIF, and SOCMA providing production volumes, consumption trends, capacity developments, and sustainability initiatives.
Company Disclosures
Annual reports, investor presentations, earnings transcripts, and regulatory filings reveal product portfolios, manufacturing footprints, capacity expansions, and revenue segmentation.
Government Databases
National statistical offices, customs authorities, environmental agencies, and industrial production databases provide verified statistics on output, trade flows, and regulatory compliance.
Trade Databases
UN Comtrade, ITC, Eurostat, and national customs authorities enable assessment of global product movement, import dependency, and export competitiveness across regions.
Our Secondary Research Sources
- Ministry of Chemicals and Fertilizers
- European Chemicals Agency
- United States Department of Energy
- Ministry of Industry and Information Technology
- Ministry of Economy Trade and Industry
- Ministry of Trade Industry and Energy
- National Institute of Standards and Technology
- Council of Scientific and Industrial Research
- Fraunhofer Society
- National Institute for Materials Science
Phase 2 — Supply-Side Assessment: Mapping Production Capabilities
Production Capacity Analysis
All major manufacturers are assessed for existing installed capacity, planned additions, expansions, new plant announcements, and technology adoption — mapped at global, regional, and country levels.
Capacity Utilization Adjustment
Installed capacity is adjusted using utilization rates based on demand conditions, feedstock availability, plant operating rates, maintenance schedules, and regulatory restrictions.
Manufacturer Revenue Analysis
Product-specific revenues, segment-level performance, regional distribution, average selling prices, and margin trends are evaluated to establish market value estimates.
Supply-Side Assessment — Capacity vs. Effective Production by Region
Illustrative comparison of installed capacity vs. effective production volume (after utilization rate adjustment) across major regions

Phase 3 — Demand-Side Assessment: Quantifying Chemical Consumption
Demand-side analysis quantifies chemical consumption across industries, applications, and geographies — identifying where and how chemicals are consumed throughout the value chain with precision.
End-Use Industry Analysis
Chemical demand is evaluated across automotive, construction, packaging, electronics, agriculture, healthcare, consumer goods, industrial manufacturing, energy and utilities, and water treatment. Industry output, production trends, and consumption intensity are analyzed to determine demand patterns.
Consumption Modeling
Demand is estimated using measurable indicators: kilograms per vehicle, kilograms per square meter of construction, dosage per cubic meter of water treated, kilograms per hectare of agricultural land, and kilograms per ton of manufactured products. Consumption factors are validated through industry publications and primary interviews.
Application Analysis
The market is segmented by application area to understand product performance requirements, formulation trends, technology adoption, customer preferences, and regulatory requirements improving demand accuracy and segmentation granularity.
Demand-Side Assessment — End-Use Industry Demand Distribution
Illustrative distribution of chemical & materials demand across key end-use industries

Phase 4 - Trade Flow Analysis: Balancing Regional Supply and Demand
Trade flow analysis reconciles regional supply and demand estimates through import and export data, identifying net supply positions, regional dependencies, and market imbalances. It serves as an independent validation layer that tests the consistency of supply-side and demand-side estimates.
Import Analysis
Import data is evaluated to determine volumes, source countries, product dependency, regional supply gaps, and pricing trends — identifying markets that rely heavily on external supply and where domestic production is insufficient to meet demand.
Export Analysis
Export assessments reveal production surplus, export competitiveness, regional manufacturing strength, and global market participation. Export patterns also help validate domestic production estimates and identify net exporting regions.
Apparent Consumption Model
Regional consumption is assessed using the standard apparent consumption formula:
Results identify net importing regions, net exporting regions, regional deficits, and surpluses — serving as an independent validation of supply and demand estimates.
Trade Flow Analysis — Net Supply Position by Region
Illustrative apparent consumption vs. domestic production across major regions — positive gap indicates net import dependency

Phase 5 — Primary Research: The Critical Validation Layer
Primary research tests and refines findings from secondary research through direct engagement with industry participants across the supply chain, demand side, and expert community. It captures intelligence that no database or published report can provide — the real-world experience of manufacturers, buyers, and specialists operating in the market.

Supply-Side Interviews
Conversations with chemical manufacturers, raw material suppliers, contract manufacturers, technology providers, and plant operators cover production trends, capacity utilization, pricing developments, technology shifts, and competitive dynamics.

Demand-Side Interviews
Engagement with OEMs, industrial consumers, procurement managers, distributors, formulators, and end-use manufacturers focuses on consumption trends, purchasing behavior, product substitution, demand outlook, and emerging applications.

Industry Expert Consultations
Additional interviews with industry consultants, independent experts, regulatory specialists, technical professionals, and research institutions provide deeper market context and validate key analytical assumptions.
Focus Areas of Primary Research:
Market Size & Forecast Validation
Revenue estimates, volume consumption, growth rates, forecast assumptions, regional demand.Supply Chain & Value Chain Assessment
Raw material sourcing, supply chain challenges, distribution networks, procurement practices.Production & Capacity Analysis
Manufacturing capacity, utilization rates, expansion projects, plant investments.Pricing & Cost Structure Analysis
Product pricing trends, feedstock costs, energy costs, margin pressures, pricing outlook.Competitive Landscape Assessment
Volume and value estimates confirmed to be fully consistent with one another before publicationInterview Volume by Market Scope
| Study Scope | Number of Interviews |
|---|---|
| Niche Market | 20 – 30 |
| Mid-Sized Market | 30 – 50 |
| Global Market | 50 – 80 |
| Highly Fragmented Market | 80 – 120 |
Interview Details:
Category : Manufacturers, Suppliers, Distributors, End Users, Experts/Associations
Average Duration : 30–60 Minutes
Interview Mode : Video calls, telephonic interviews, expert consultations
Interview Format : Structured / Semi-Structured questionnaire
Focus Areas of Primary Research:
Market Size & Forecast Validation :
Revenue estimates, volume consumption, growth rates, forecast assumptions, regional demand.
Supply Chain & Value Chain Assessment :
Raw material sourcing, supply chain challenges, distribution networks, procurement practices.
Production & Capacity Analysis :
Manufacturing capacity, utilization rates, expansion projects, plant investments.
Pricing & Cost Structure Analysis :
Product pricing trends, feedstock costs, energy costs, margin pressures, pricing outlook.
Competitive Landscape Assessment :
Market share, competitor positioning, strategic initiatives, partnerships, acquisitions.
Primary Research — Stakeholder Coverage by Category
Distribution of interview respondents across stakeholder categories (% share from PPT data)

Primary Research — Respondent Designation Profile
Seniority breakdown of interview respondents (% share from PPT data)

Primary Research — Geographic Coverage of Interviews
Regional distribution of primary research engagement (% share from PPT data)

Phase 6 — Data Triangulation and Market Validation
No single methodology is relied upon in isolation. Multiple independent estimation approaches are combined and reconciled to ensure consistency, accuracy, and analytical defensibility. Any material deviations between approaches are investigated and adjusted through additional validation cycles.
The final market size is derived through weighted triangulation of all validated methodologies. Any material deviations between approaches are investigated and adjusted through additional validation cycles. The outcome represents the most realistic assessment of the market based on available evidence and expert confirmation ensuring that volume and value estimates are fully consistent with one another.
Triangulation Framework — Input Contribution Weight
Relative weight each sizing input contributes to the final reconciled market estimate

Phase 7 — Forecast Modeling: Projecting Future Market Evolution
Forecasting evaluates the future trajectory of the market using a combination of quantitative indicators and qualitative assessments across economic, industry, and regulatory dimensions. Rather than simple extrapolation, each driver is independently modeled and integrated into a composite forecast.
Macroeconomic Indicators
GDP growth, industrial production, manufacturing output, construction activity, consumer spending, and capital investment form the quantitative foundation of long-term demand projections. These are applied at country, regional, and global levels.
Industry Growth Drivers
Urbanization, infrastructure development, industrialization, technological innovation, sustainability initiatives, and evolving product performance requirements are assessed at regional and industry levels — capturing both structural and cyclical demand drivers.
Capacity Expansion Analysis
Announced plant expansions, new manufacturing facilities, technology upgrades, and strategic investments are evaluated to determine future supply-demand dynamics and potential market tightness or oversupply situations.
Regulatory & Sustainability
Environmental regulations, chemical safety standards, emission reduction targets, circular economy initiatives, and sustainability requirements are incorporated as they often influence product adoption rates and market growth trajectories.
Scenario Forecast Range — Indexed Market Growth (Year 1–10)
Illustrative indexed growth trajectories across Base, Optimistic, and Pessimistic scenarios over a 10-year forecast horizon

Forecast Drivers — Relative Impact Score by Category
Impact score (0–100) of each driver type on chemicals & materials market forecast




Comments
Share your thoughts, ask a question, or provide feedback about this report.