Table of Content
Content
What is the Cosmetic Chemicals Market Size and Share?
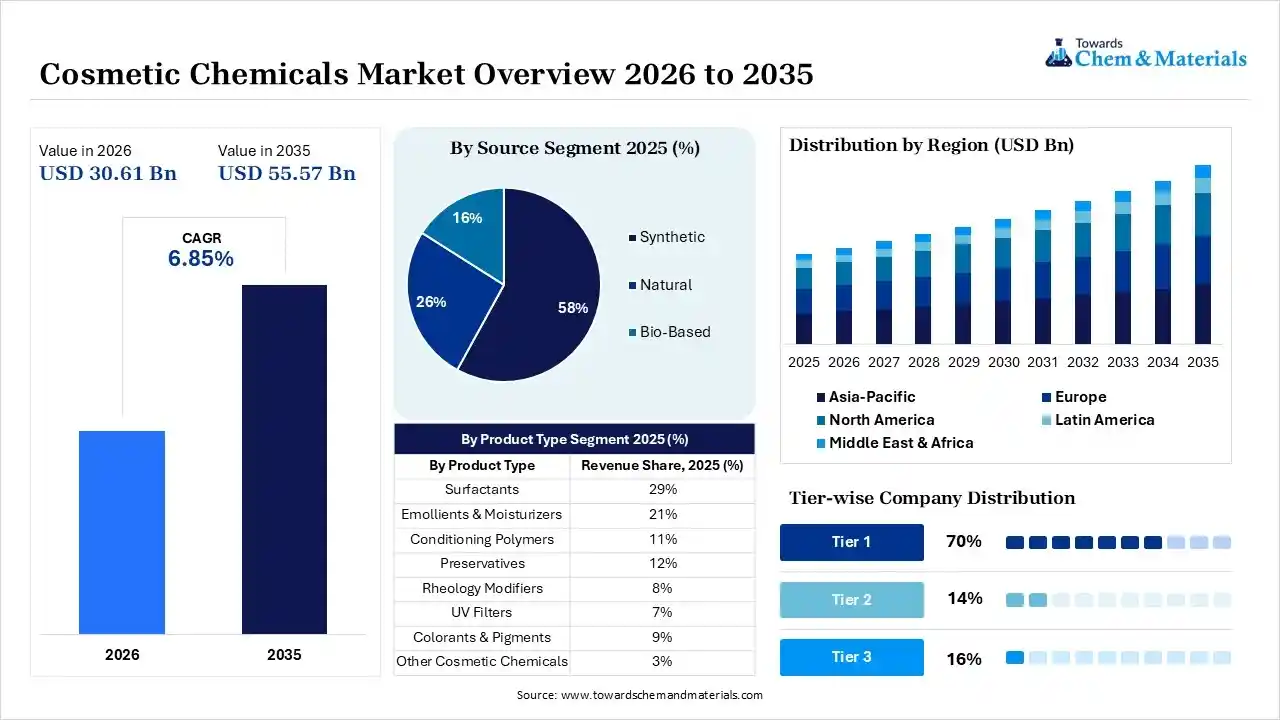
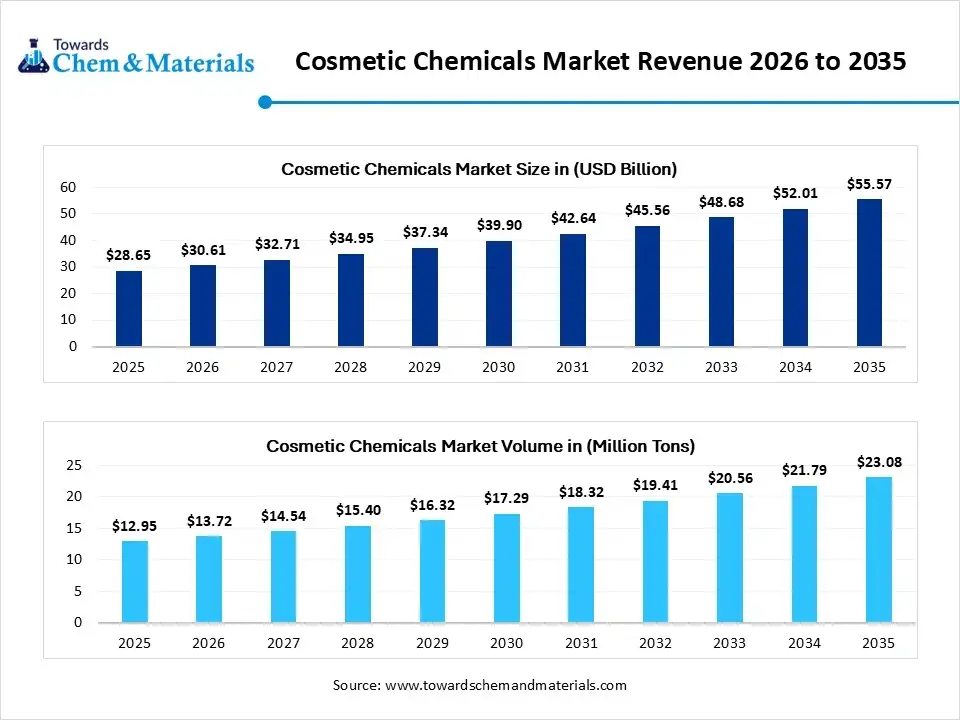
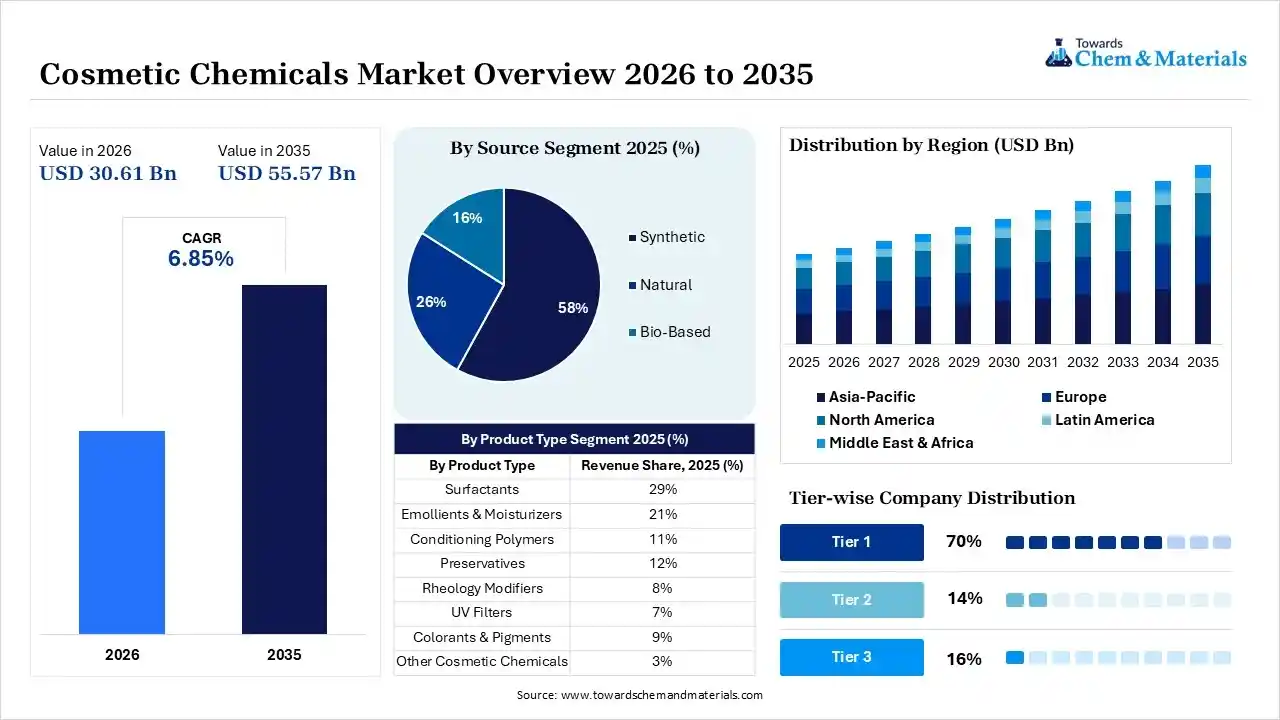
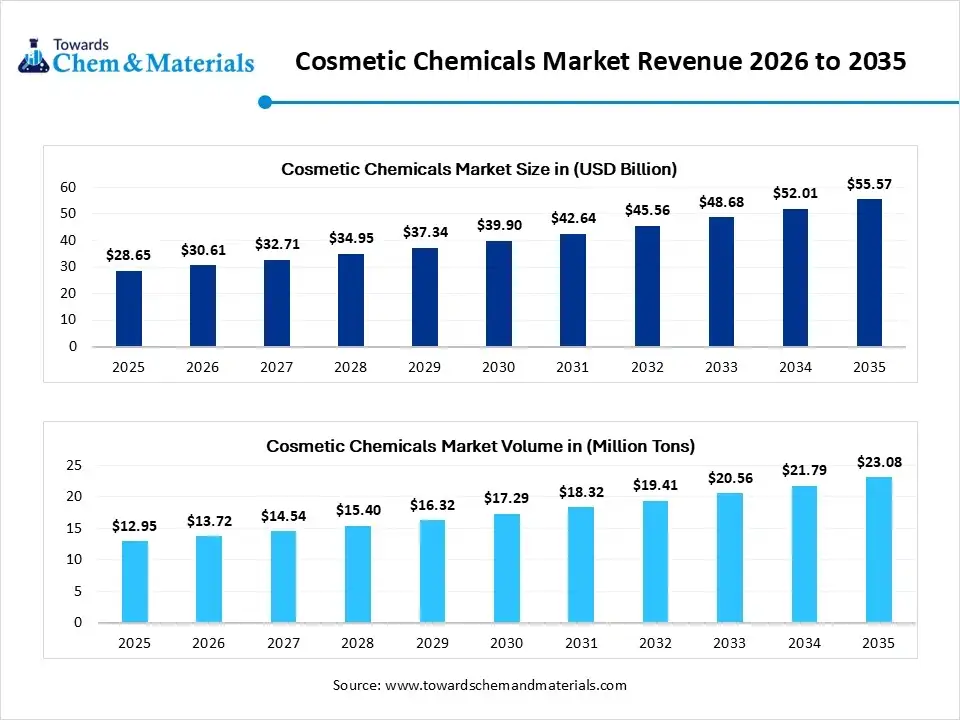
The cosmetic chemicals market size was valued at USD 28.65 billion in 2025, is estimated to reach USD 55.57 billion in 2026, and is projected to reach USD 55.57 billion by 2035, exhibiting a compound annual growth rate (CAGR) of 6.85% over the forecast period from 2026 to 2035.Asia Pacific dominated the cosmetic chemicals market with the largest revenue share of 34% in 2025 and is expected to grow at the fastest CAGR of 7.01% during the forecast period. In terms of volume, the cosmetic chemicals market is projected to grow from 12.95 million tons in 2025 to 23.08 million tons by 2035. growing at a CAGR of 5.95% from 2026 to 2035.Increasing consumer demand for premium skincare products is the key factor driving market growth. Also, an extensive transition towards natural and clean-label ingredients coupled with the surge in impact of social media trends on daily care can fuel market growth further.
Market Highlights
- By region, Asia Pacific dominated the market with the largest share of 34.00% in 2025 and is expected to grow at the fastest CAGR of 8.2% over the forecast period. The dominance and growth of the region can be attributed to the increasing consumer purchasing power.
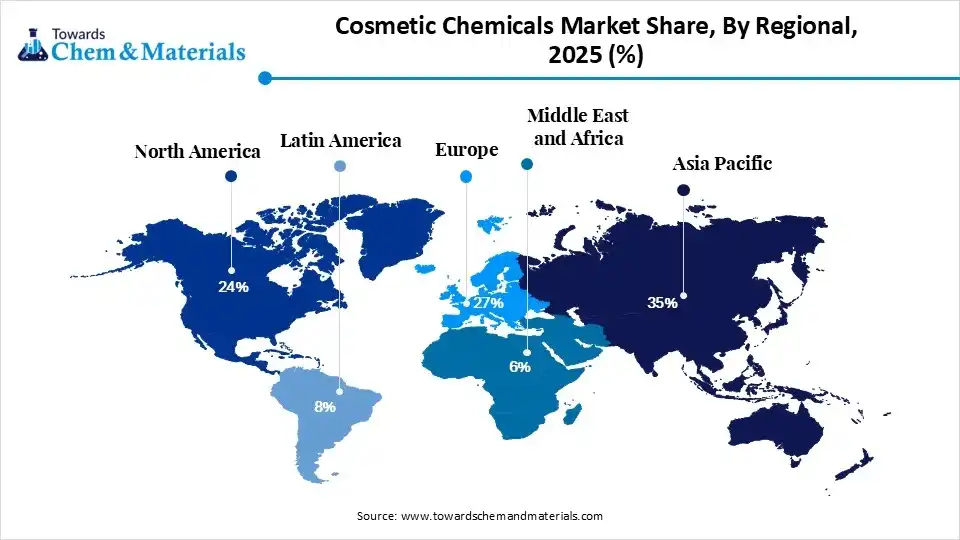
- By region, Europe held the 27.0% market share in 2025. The growth of the region can be attributed to the strengthened sustainability mandates and an expanding dermocosmetics sector.
- By product type, the surfactants segment dominated the market with the largest share of 29% in 2025. Surfactants serve as basic roles in personal care, acting as the major agents.
- By product type, the UV filters segment held a market share of 7.00% in 2025 and is expected to grow at the fastest CAGR of 8.2% over the forecast period. Chemical UV filters, including avobenzone, octocrylene, and octinoxate.
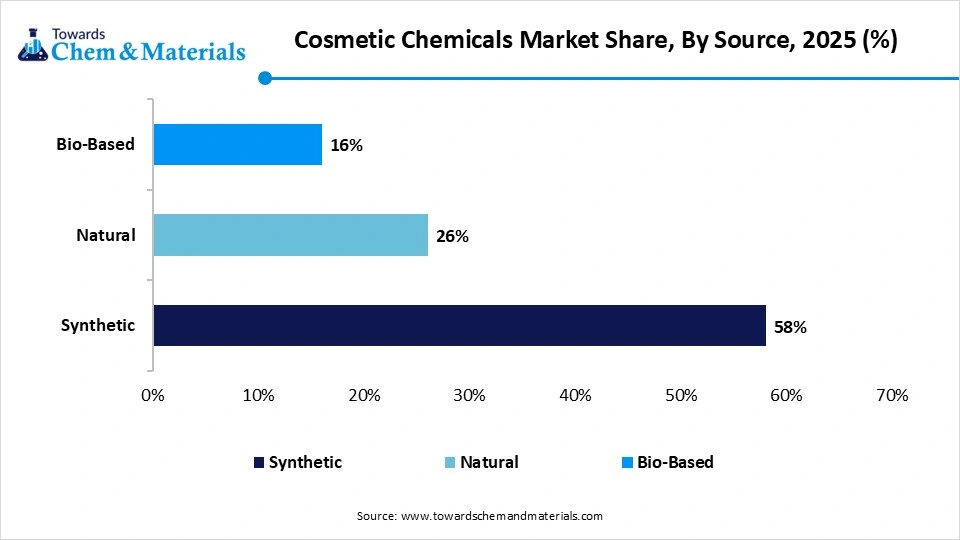
- By source, the synthetic segment dominated the market with the largest share of 58% in 2025. Synthetics give a highly predictable and reliable chemical performance across large-scale production.
- By source, the bio-based segment held a market share of 16.00% in 2025 and is expected to grow at the fastest CAGR of 9.1% during the forecast period. Plant-sourced materials remain the most established pillar of bio-based cosmetics.
- By functionality, the cleansing agents segment dominated the market with the largest share of 27% in 2025. Surfactants, or surface-active agents, are fundamental chemical compounds used to diminish surface tension.
- By functionality, the UV protection agents segment held a market share of 8.00% in 2025 and is expected to grow at the fastest CAGR of 8.4% over the forecast period. These agents are majorly categorized by their action mechanics into organic (chemical) and inorganic (physical/mineral) UV filters.
- By application, the skin care segment dominated the market with the largest share of 37% in 2025 and is expected to grow at the fastest CAGR of 7.50% over the forecast period. The active ingredients in skin care are extensively incorporated for targeted treatments.
- By end user, the mass market cosmetics segment dominated the market with the largest share of 49% in 2025. It supplies affordable personal and beauty care items such as shampoos, skin cleaners, and body washes.
- By end user, the premium cosmetics segment held a market share of 28.00% in 2025 and is expected to grow at the fastest CAGR of 7.9% over the forecast period. Premium market segments require scalp-revitalizing treatments.
- By distribution channel, the direct sales to manufacturers segment dominated the market with a large share of 46% in 2025. This segment consists of specialty ingredient providers and raw material manufacturers that supply active components.
- By distribution channel, the online B2B platforms segment held a market share of 8.00% in 2025 and is expected to grow at the fastest CAGR of 9.2% during the projected period. This platform establishes a direct relation between raw material suppliers and cosmetic manufacturers.
Increasing Adoption of Cosmetics in Daily Routines Supports Market Growth
The rising incorporation of cosmetics within daily grooming is a major factor presenting lucrative opportunities in the market. This is fueled by urbanization, a surge in disposable incomes, and a surge in the labor force, particularly among women.
- In January 2026, IMCD Group, a global leader in the distribution of specialty chemicals and ingredients, established new facilities in South Korea. These developments include a beauty & personal care application laboratory alongside the IMCD Beauty Studio Seoul. This strategic expansion positions the corporation within one of the world's most dynamic beauty markets.(Source:indianchemicalnews.com)
There has been particular growth for BB creams, lip tints, foundations, and setting sprays that are convenient for all-day wear, which leads cosmetic chemical makers to design advanced products with innovative formulations.
Global Investment Flow for Cosmetic Chemicals 2025
Major investment flows are transitioning towards Asia, especially China and India. Emerging nations are increasing their domestic chemical manufacturing capacities to tackle trade barriers, geopolitical risks, and overall shipping costs.
- In 2025, the bilateral trade volume in cosmetics and personal care products between the European Union and the United States reached approximately $14.6 billion in 2025. Within this exchange, U.S. exports to the European Union accounted for an estimated $3.6 billion, whereas imports from EU manufacturers comprised roughly $11.0 billion.(Source:personalcarecouncil.org)
These investments are rapidly transitioning towards sustainable, green chemistry and bio-based ingredients along with the stringent, regulatory-compliant formulations.
Cosmetic Chemicals Market Trends
- Increasing disposable incomes and shifting consumer preferences in emerging economies are the latest trends in the market shaping positive market growth. This surge in income brackets is propelling high expenditure on cosmetics from being a need to a lifestyle, emphasizing more effectiveness and quality.
- In recent years, the demand for sustainable and natural chemicals has been increasing, fuelled by the digitally savvy consumer base, who are aware of the potential environmental and health impacts of synthetics. This trend also involves the growing need for plant-based surfactants and natural preservatives.
- Growing government emphasis on local manufacturing is the future trend in the market driving expansion. The major countries are reliant more on the import of cosmetic chemicals like specialty silicones, advanced UV filters, and bioactive, hence creating supply chain vulnerabilities.
Market Report Scope
| Report Attributes | Details |
| Market Size and Volume in 2026 | USD 30.61 Billion / 13.72 Million Tons |
| Revenue Forecast in 2035 | USD 55.57 Billion / 23.08 Million Tons |
| Growth Rate | CAGR 6.85% |
| Base Year of Estimation | 2025 |
| Forecast Period | 2025 - 2035 |
| High Impact Region | Asia Pacific |
| Segment Covered | By Product Type, By Source, By Functionality, By Application, By End User, By Distribution Channel |
| Key Companies Profiled | BASF SE, Croda International Plc, Evonik Industries AG, Eastman Chemical Company, FMC Corporation, Emery Oleochemicals, Solvay, Pilot Chemical Corp., Procter & Gamble, United-Guardian, LANXESS, BASF SE, EVONIK |
AI-Powered Predictive Formulations in the Cosmetic Chemicals Market
AI-powered predictive formulation is transforming the market by replacing conventional trial-and-error processes with data-driven modeling. By simulating chemical interactions at the subtle level, AI boosts R&D, minimizes raw material waste, and optimizes product stability. Furthermore, AI models can predict how a formulation’s stability and viscosity will behave when transitioning towards large-scale manufacturing.
Supply Chain Analysis of the Cosmetic Chemicals Market
- Production & Processing:It refers to the formulation, sourcing, and mass production of essential chemical ingredients into finished commercial beauty and personal care products. It also includes ingredient blending, chemical synthesis, stability testing, and the scale-up from lab batches to large-scale industrial manufacturing. Quality testing is generally performed for purity and compliance.
- BASF SE (Germany): The global leader in active ingredients, skin moisturizers (e.g., Hydagen Aquaporin), and sustainable chemical portfolios.
- Other Key Players: Croda International Plc. and Evonik Industries AG.
- Quality Testing and Certification :It is the scientific and regulatory process of assessing raw materials and finished products to ensure they are effective, safe, and compliant with global safety standards. It protects consumers by preventing allergic reactions, contamination, and hazardous toxicity. It simulated harsh temperatures and humidity to determine the product's shelf life.
- Intertek: Offers extensive analytical and regulatory testing, including allergen screening and banned ingredient detection.
- Other Key Players: Unilever, Estée Lauder.
- Distribution to Industrial Users :It includes the business-to-business (B2B) supply chain, where essential materials are sold directly to third-party distributors for personal care and cosmetic manufacturers. These industrial users then process the chemical ingredients to formulate haircare, skincare, and makeup products.
- The Dow Chemical Company: Provides silicone-based materials and advanced polymers for skin and haircare.
- Other Key Players: Brenntag AG, Helm AG.
Cosmetic Chemicals Market’s Regulatory Landscape: Global Regulations
| Country/Region | Key Regulations |
| European Union (EU) | Fragrance Allergen Expansion: In effect by July 2026 under Regulation (EU) 2023/1545, mandatory on-pack declarations for fragrance allergens jump from 26 to over 80 chemical substances. |
| United States | The Modernization of Cosmetics Regulation Act (MoCRA) mandates facility registrations, master chemical product listings, adverse event reporting, and professional safety substantiations. |
| China | The Cosmetic Supervision and Administration Regulation (CSAR) requires intensive raw-material safety reporting. The National Institutes for Food and Drug Control (NIFDC) continues rolling adjustments to the Inventory of Existing Cosmetic Ingredients in China (IECIC). |
Market Dynamics
Driver
Increasing Awareness of Personal Grooming
The market is increasingly benefiting from a growing awareness of personal grooming and personal care among most consumers, which is the major factor driving growth in the market. This trend is especially popular in developing countries with growing disposable incomes. In addition, as the prioritization of personal appearance grows, the consumption of cosmetics and personal care products is increasing. Hence, brands are capitalizing on this trend by launching targeted marketing campaigns that emphasize the significance of self-care and grooming.
Restraint
Supply Chain Volatility
Sourcing bio-based and natural raw materials makes chemical market players prone to crop seasonality's and climate impacts, which are the major factors hindering the market growth. Moreover, traditional chemical supply chains are currently navigating significant global overcapacity, a dynamic that is compressing profit margins despite a simultaneous rise in demand for specialized chemical ingredients.
Opportunity
Personalization and Extensive Product Offerings
The market is distinguished by an extensive range of products, offering tailoring to different consumer needs and preferences, creating lucrative opportunities in the market. Furthermore, brands are increasingly prioritizing customization, empowering consumers to select products tailored to their specific needs. This trend is particularly evident in the growing market for vital skincare solutions and customized cosmetic formulations. As consumer preference increasingly shifts toward unique, personalized experiences, the demand for individualized cosmetic products is projected to experience significant growth.
Segmental Insights
Product Type Insights
The surfactants segment dominated the market with the largest share of 29% in 2025. Surfactants serve basic roles in personal care, acting as the major agents for foaming, cleansing, emulsification, solubilization, and conditioning. In addition, these ingredients carry no electrical charge. They are highly valued for their exceptional compatibility with other formulation components and superior skin tolerance. Therefore, they form the foundational basis for sulfate-free product lines. Their primary applications include solubilizing essential oils, serving as superfatting agents, and formulating gentle cleansers for facial or infant care.
The UV filters segment held a market share of 7.00% in 2025 and is expected to grow at the fastest CAGR of 8.2% over the forecast period. Chemical UV filters, including avobenzone, octocrylene, and octinoxate, operate by penetrating the dermis to absorb harmful UVA and UVB radiation, then converting it into negligible thermal energy. Due to their lightweight textures and lack of chalky residue, these compounds are generally used in daily cosmetic formulations, which makes them the preferred choice for everyday moisturizers and makeup products. Also, UV filters can be formulated into lotions and creams as well as sprays, gels, and sticks.
Cosmetic Chemicals Market Share,By Product Type, 2025 (%)
| By Product Type | Revenue Share, 2025 (%) |
| Surfactants | 29% |
| Emollients & Moisturizers | 21% |
| Conditioning Polymers | 11% |
| Preservatives | 12% |
| Rheology Modifiers | 8% |
| UV Filters | 7% |
| Colorants & Pigments | 9% |
| Other Cosmetic Chemicals | 3% |
Source Insights
The synthetic segment dominated the market with the largest share of 58% in 2025. Synthetics give a highly predictable and reliable chemical performance across large-scale production. They also offer an inexpensive solution to sourcing bioderived or natural ingredients. Moreover, manufacturers are transitioning toward derived-synthetic ingredients, which use bio-based feedstocks processed via chemical synthesis to yield high-purity compounds that satisfy clean-label criteria.
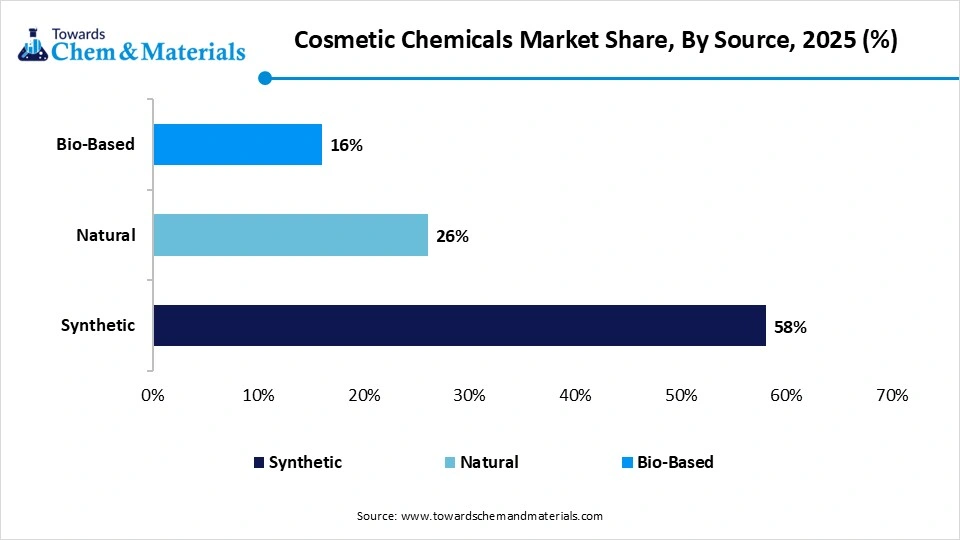
The bio-based segment held a market share of 16.00% in 2025 and is expected to grow at the fastest CAGR of 9.1% during the forecast period. Plant-sourced materials remain the most established pillar of bio-based cosmetics. The industry leverages botanical extracts to substitute fossil-fuel-based emollients, solvents, and texture-enhancing agents. Due to an exceptional concentration of antioxidants and cell-regenerative bioactives, these formulations are well suited for premium anti-aging, UV protection, and hyper-hydration therapies, driving positive segment growth soon.
Cosmetic Chemicals Market Share,By Source, 2025 (%)
| By Source | Revenue Share, 2025 (%) |
| Synthetic | 58% |
| Natural | 26% |
| Bio-Based | 16% |
Functionality Insights
The cleansing agents segment dominated the market with the largest share of 27% in 2025. Surfactants, or surface-active agents, are fundamental chemical compounds used to diminish surface tension. This mechanism enables the emulsification of oils and dirt within water, facilitating their efficient and thorough removal. These ingredients are main components in rinse-off cleansing formulations. This involves body washes, facial cleaners, shampoos, micellar waters, and liquid soaps. Ingredients such as xanthan gum or cocamide DEA offer viscosity and a keen sensory experience during cleansing.
The UV protection agents segment held a market share of 8.00% in 2025 and is expected to grow at the fastest CAGR of 8.4% over the forecast period. These agents are majorly categorized by their action mechanics into organic (chemical) and inorganic (physical/mineral) UV filters, extensively used in color, skin care, and sun-care products. Consumers now possess extensive knowledge regarding environmental stressors, such as pollution and photoaging, due to guidance from dermatologists and beauty influencers. Hence, this heightened awareness has transformed UV filters from seasonal skincare products into daily essentials.
Cosmetic Chemicals Market Share, By Functionalitye, 2025 (%)
| By Functionality | Revenue Share, 2025 (%) |
| Cleansing Agents | 27% |
| Moisturizing Agents | 21% |
| Conditioning Agents | 14% |
| Preserving Agents | 10% |
| Coloring Agents | 9% |
| UV Protection Agents | 8% |
| Thickening & Stabilizing Agents | 7% |
| Fragrance Carriers | 4% |
Application Insights
The skin care segment dominated the market with the largest share of 37% in 2025 and is expected to grow at the fastest CAGR of 7.50% over the forecast period. The active ingredients in skin care are extensively incorporated for targeted treatments such as anti-aging and acne control. Active chemicals such as salicylic acid, niacinamide, and peptides are popular with informed consumers. In addition, modern consumers increasingly demand chemical compositions with clinically proven efficacy, fueling significant segment growth for biological actives such as hyaluronic acid, niacinamide, retinol, and stabilized vitamins.
The hair care segment held a market share of 24% in 2025. This segment serves as the high-volume foundation of the market and ensures consistent demand for specialized chemical formulations that emphasize anti-bacterial efficacy, mildness, and superior cleansing. Hair care products are frequently promoted for their therapeutic advantages, using advanced formulations that protect against environmental pollutants and maintain microbiome equilibrium.
Cosmetic Chemicals Market Share, By Application, 2025 (%)
| By Application | Revenue Share, 2025 (%) |
| Skin Care | 37% |
| Hair Care | 24% |
| Color Cosmetics | 16% |
| Oral Care | 8% |
| Fragrances | 6% |
| Personal Hygiene Products | 9% |
End User Insights
The mass market cosmetics segment dominated the market with the largest share of 49% in 2025. It supplies affordable personal and beauty care items such as shampoos, skin cleaners, and body washes. The demand here emphasizes cost-effective, high-volume ingredients while transitioning towards milder and more sustainable chemical alternatives. Mass-market manufacturers are compelled to substitute inexpensive synthetic components with sustainable or bio-based alternatives, such as green surfactants, while maintaining strict price parity for the consumer.
The premium cosmetics segment held a market share of 28.00% in 2025 and is expected to grow at the fastest CAGR of 7.9% over the forecast period. Premium market segments require scalp-revitalizing treatments, advanced bond-repair polymers, and biofunctional ingredients to elevate the overall efficacy and health benefits of hair care formulations. Specialized film-formers, high-value colorants, and long-wear pigment modifiers fuel chemical usage, boosted by increasing disposable incomes.
Cosmetic Chemicals Market Share, By End User, 2025 (%)
| By End User | Revenue Share, 2025 (%) |
| Mass Market Cosmetics | 49% |
| Premium Cosmetics | 28% |
| Professional/Salon Products | 13% |
| Dermocosmetics | 10% |
Distribution Channel Insights
The direct sales to manufacturers segment dominated the market with a large share of 46% in 2025. This segment consists of specialty ingredient providers and raw material manufacturers that supply active components directly to beauty and personal care brands, bypassing traditional chemical distributors. This direct-to-brand channel is mainly propelled by the increasing consumer demand for premium skincare and clean beauty formulations. Also, direct sourcing is the preferred approach for skincare brands because clinical-grade active ingredients demand rigorous quality control, stability testing, and origin verification.
The online B2B platforms segment held a market share of 8.00% in 2025 and is expected to grow at the fastest CAGR of 9.2% during the projected period. This platform establishes a direct relation between raw material suppliers and cosmetic manufacturers. Furthermore, this digital transformation optimizes bulk procurement, enhances price visibility, and expedites the sourcing of critical formulation ingredients like surfactants, emollients, and preservatives. Dedicated B2B platforms, including SpecialChem, ChemDmart, and Knowde, operate exclusively within the chemical raw materials sector. These digital marketplaces are created to support industry professionals by providing granular ingredient formulations.
Cosmetic Chemicals Market Share, By Distribution Channel, 2025 (%)
| By Distribution Channel | Revenue Share, 2025 (%) |
| Direct Sales to Manufacturers | 46% |
| Specialty Chemical Distributors | 32% |
| Online B2B Platforms | 8% |
| Contract Formulation Suppliers | 14% |
Regional Analysis
How did Asia Pacific Dominated the Cosmetic Chemicals Market in 2025?
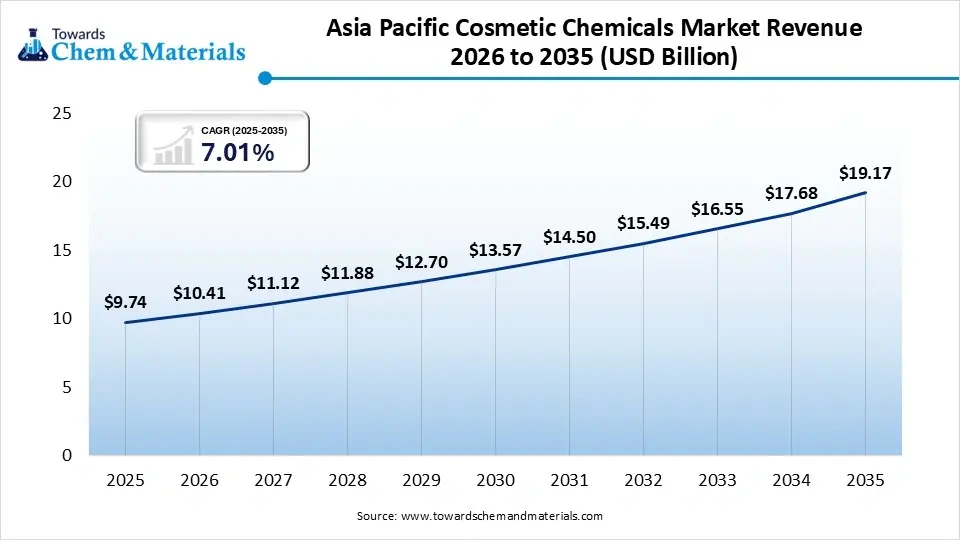
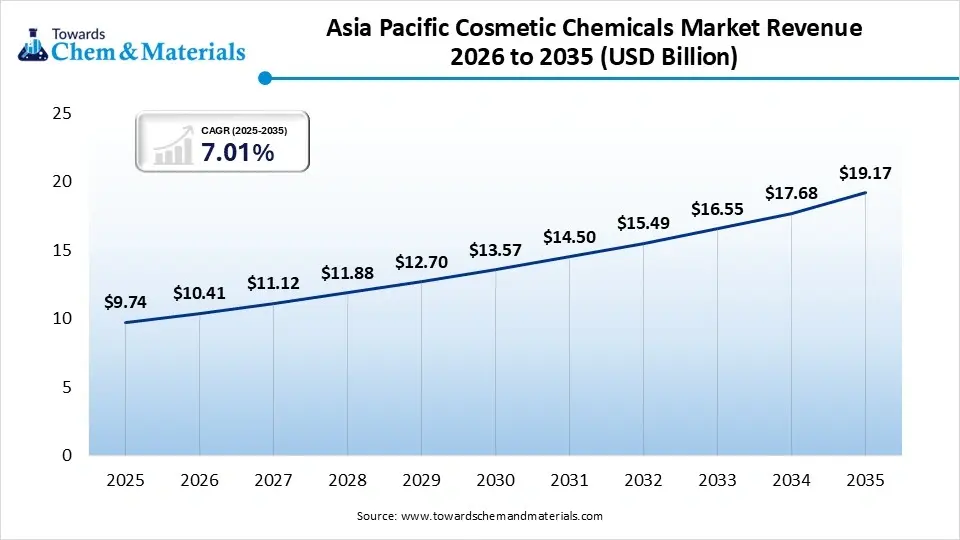
The Asia Pacific cosmetic chemicals market size was estimated at USD 9.74 billion in 2025 and is projected to reach USD 19.17 billion by 2035, growing at a CAGR of 7.01% from 2026 to 2035.Asia Pacific dominated the market with the largest share of 34.00% in 2025 and is expected to grow at the fastest CAGR of 8.2% over the forecast period. The dominance and growth of the region can be attributed to the increasing consumer purchasing power, rapid e-commerce expansion, and the surge in prominence of South Korean and Japanese cosmetic trends. In addition, the market further benefits from highly cost-effective and developed regional manufacturing facilitated by emerging economies like China and India.
 China
China
- Chinese consumers increasingly prefer scientifically backed, functional ingredients (like peptides, ceramides, and niacinamide).
- There is an increase in demand for herbal, clean-label, and botanical ingredients driven by wellness consciousness and the popularity of traditional ingredients.
India
- A cultural shift toward elaborate grooming routines has increased a demand for luxury and premium cosmetics, leading brands to formulate specialized chemicals.
- The growth of online retail platforms and direct-to-consumer homegrown beauty brands has dramatically increased product reach and demand.
The Europe cosmetic chemicals market size was estimated at USD 7.74 billion in 2025 and is projected to reach USD 15.28 billion by 2035, growing at a CAGR of 7.04% from 2026 to 2035.Europe held the 27.0% market share in 2025. The growth of the region can be attributed to the strengthened sustainability mandates and an expanding dermocosmetics sector, along with the growing need for natural, clean, and scientifically backed beauty products. The market is further experiencing a significant surge in demand for barrier-repair formulations, serums, and clinical skincare products targeting specific concerns such as acne, hyperpigmentation, and aging.
Germany
- Germany is enforcing strict regulations for natural cosmetics, including the COSMOS Standard and former BDIH certifications, impacting positive market growth soon.
- Germany is home to some of the world's largest cosmetic ingredient manufacturers, such as BASF SE, Evonik Industries AG, Wacker Chemie AG, and Symrise AG.
France
- France remains a primary hub for clinical skincare and premium products. This premiumization fuels the demand for high-value emollient systems.
- There is surging demand for science-backed bioactives, including plant-based peptides and bio-retinol substitutes.
The North America cosmetic chemicals market size was estimated at USD 6.88 billion in 2025 and is projected to reach USD 13.61 billion by 2035, growing at a CAGR of 7.06% from 2026 to 2035.North America held a market share of 24.00% in 2025. The growth of the region can be linked to the increasing consumer expenditure on premium dermatological products, stringent safety mandates, and a growing demand for organic and botanical ingredients, coupled with the rapid evolution of industry regulations. Also, an increase in consumer awareness regarding synthetic chemicals impels market players to invest in green chemistry.
 United States
- Innovative dermatological formulations and scientific breakthroughs allow manufacturers to develop safer, highly effective products like anti-aging serums and specialized exfoliants.
- The implementation of the Modernization of Cosmetics Regulation Act (MoCRA) has compelled manufacturers to overhaul formulations.
Canada
- Increasing disposable incomes and an increased emphasis on preventive anti-aging are driving the demand for high-value specialty chemicals.
- Consumers increasingly need streamlined beauty routines, boosting the need for multi-benefit chemical systems that offer several benefits.
The Latin America cosmetic chemicals market size was estimated at USD 2.29 billion in 2025 and is projected to reach USD 4.72 billion by 2035, growing at a CAGR of 7.50% from 2026 to 2035.Latin America held a market share of 8.00% in 2025. The growth of the region can be driven by an increase in societal focus on personal aesthetics, combined with the exponential growth of the middle class and population in major countries. In addition, consumer preferences are evolving toward environmentally sustainable and non-toxic cosmetic products. The region's extensive biodiversity enables manufacturers to locally source premium, tropical botanical ingredients (such as açaí and cupuaçu) while eliminating the need for synthetic additives.
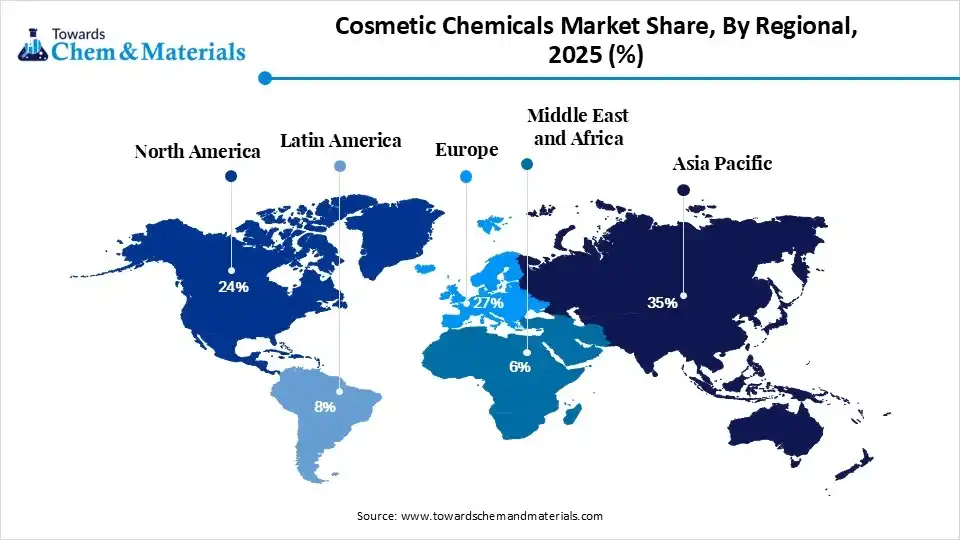
Cosmetic Chemicals Market Share, By Regional, 2025 (%)
| Regional | Revenue Share, 2025 (%) |
| North America | 24% |
| Europe | 27% |
| Asia-Pacific | 35% |
| Latin America | 8% |
| Middle East & Africa | 6% |
Brazil
- Brazil's vast natural resources, yielding ingredients like cupuaçu, açaí, and babassu oil, are central to product formulations.
- Growing middle-class disposable incomes and a strong cultural emphasis on personal grooming have expanded the market growth further.
Argentina
- Growing ingredient awareness is pushing manufacturers to replace harsh synthetic chemicals with organic, plant-derived alternatives.
- Consumers are seeking products that offer aesthetic benefits along with therapeutic protection from environmental stressors.
The Middle East & Africa cosmetic chemicals market size was estimated at USD 2.01 billion in 2025 and is projected to reach USD 4.17 billion by 2035, growing at a CAGR of 7.57% from 2026 to 2035.The Middle East & Africa held a market share of 7.00% in 2025. The growth of the region can be attributed to the growing need for halal-compliant formulations and surge in the youth demographic. Furthermore, the expansion of physical retail networks and the proliferation of e-commerce have significantly increased consumer access to premium international beauty brands, a trend driven by rising disposable incomes.
Cosmetic Chemicals Market Share, By Regional, 2025 (%)
| Regional | Revenue Share, 2025 (%) |
| North America | 24% |
| Europe | 27% |
| Asia-Pacific | 35% |
| Latin America | 8% |
| Middle East & Africa | 6% |
Saudi Arabia
- Consumers are increasingly prioritizing organic, cruelty-free, and natural ingredients, leading to market growth soon.
- Investments in domestic manufacturing and specialty chemicals are minimizing reliance on imports, driving innovation.
UAE
- The men's grooming sector is experiencing rapid expansion, opening new avenues for tailored skincare and cosmetic formulations.
- The use of regional online beauty retailers has made specialty and organic cosmetics significantly more accessible to the average consumer.
Competitive Analysis
Major market players and personal care suppliers lead the market, heavily investing in R&D to meet regulatory standards and natural ingredient preferences. Companies are transitioning towards plant-based, biodegradable, and biotech-manufactured chemicals to accommodate clean beauty movements.
- The U.S. Food and Drug Administration (FDA) has officially approved Bemotrizinol (BEMT), marketed by BASF as Tinosorb® S, for use as an active ingredient in sunscreen formulations.
- Dow Personal Care debuted its first silicone elastomer blends under the Decarbia reduced carbon footprint platform at the New York Society of Cosmetic Chemists (NYSCC) Suppliers' Day.(Source:basf.com), (Source: personalcareinsights.com)
Recent Developments
- In May 2026, In-Cosmetics Global has unveiled its inaugural Nutricosmetics Ingredient Index. Industry data identifies this beauty-from-within sector as one of the most rapidly expanding segments of the nutraceutical market.(Source: nutraceuticalbusinessreview.com)
- In February 2026, Lesaffre expanded its biotechnology portfolio with the launch of Innosya Cosmetic Ingredients. This strategic expansion marks the organization's entrance into the global B2B beauty sector, offering the cosmetics industry innovative, science-backed solutions derived entirely through advanced fermentation processes.(Source: personalcareinsights)
Strategic Profiles of Key Players Shaping the Cosmetic Chemicals Market
| Company | Company Type / Position | Headquarters | Geographic Presence | Offerings | Key Offering / Strength |
| BASF SE | Market Leader / Tier-1 Multinational | Ludwigshafen, Germany | Global (Europe, North America, APAC, LATAM) | Surfactants, emulsifiers, polymers, UV filters, emollients | Sustainable formulations, biodegradable personal care ingredients, and extensive global distribution network. |
| Croda International Plc | Specialty Ingredient Specialist / Market Leader | Snaith, United Kingdom | Global (Production sites in 18 countries) | Natural specialty chemicals, active ingredients, skin/hair care lipids | Bio-based, natural-origin ingredients and high-performance skin tissue engineering actives. |
| Evonik Industries AG | Specialty Chemicals Giant | Essen, Germany | Global (Operating in 104 locations across 27 countries) | Cosmetic antioxidants, specialty additives, conditioning agents | Advanced delivery systems, biotechnology-derived actives, and sustainable specialty emulsifiers. |
Other Key Players
- Eastman Chemical Company
- FMC Corporation
- Emery Oleochemicals
- Solvay
- Pilot Chemical Corp.
- Procter & Gamble
- United-Guardian
- LANXESS
- BASF SE
- EVONIK
Segments Covered in the Report
By Product Type
- Surfactants
- Anionic Surfactants
- Non-Ionic Surfactants
- Amphoteric Surfactants
- Cationic Surfactants
- Emollients & Moisturizers
- Natural Emollients
- Synthetic Emollients
- Esters
- Conditioning Polymers
- Cationic Polymers
- Silicone-Based Polymers
- Protein-Based Polymers
- Preservatives
- Parabens
- Phenoxyethanol
- Organic Acids
- Formaldehyde-Free Preservatives
- Rheology Modifiers
- Natural Rheology Modifiers
- Synthetic Rheology Modifiers
- UV Filters
- Organic UV Filters
- Inorganic UV Filters
- Colorants & Pigments
- Organic Pigments
- Inorganic Pigments
- Specialty Effect Pigments
- Other Cosmetic Chemicals
- Chelating Agents
- Pearlescent Agents
- Solvents
- Antioxidants
By Source
- Synthetic
- Petrochemical-Based
- Specialty Synthetic Chemicals
- Natural
- Plant-Based
- Mineral-Based
- Marine-Based
- Bio-Based
- Fermentation-Derived
- Biotechnology-Derived Ingredients
By Functionality
- Cleansing Agents
- Moisturizing Agents
- Conditioning Agents
- Preserving Agents
- Coloring Agents
- UV Protection Agents
- Thickening & Stabilizing Agents
- Fragrance Carriers
By Application
- Skin Care
- Anti-Aging Products
- Moisturizers
- Sunscreens
- Facial Cleansers
- Hair Care
- Shampoos
- Conditioners
- Hair Styling Products
- Hair Treatments
- Color Cosmetics
- Face Makeup
- Eye Makeup
- Lip Products
- Oral Care
- Toothpaste
- Mouthwash
- Fragrances
- Fine Fragrances
- Body Mists
- Personal Hygiene Products
- Deodorants
- Bath & Shower Products
- Intimate Hygiene Products
By End User
- Mass Market Cosmetics
- Premium Cosmetics
- Professional/Salon Products
- Dermocosmetics
By Distribution Channel
- Direct Sales to Manufacturers
- Specialty Chemical Distributors
- Online B2B Platforms
- Contract Formulation Suppliers
By Region
- North America
- U.S.
- Canada
- Europe
- Germany
- UK
- France
- Italy
- Spain
- Sweden
- Denmark
- Norway
- Asia Pacific
- China
- Japan
- India
- South Korea
- Thailand
- Latin America
- Brazil
- Mexico
- Argentina
- Middle East and Africa (MEA)
- South Africa
- UAE
- Saudi Arabia
- Kuwait
FAQ's




Select User License to Buy
Figures (5)




 sales@towardschemandmaterials.com
 Download Sample
 Schedule a Meeting