
Commercial Sandwich Panels Market Size Analysis Report 2035
According to Videsh Swar Research, which specializes in the construction and related materials market, the innovation and rising demand for building materials like commercial sandwich panels, which are extensively used for their properties and advantages, result in a rapid surge in the market. The research helps in the integration of advancements and the launch of new and innovative products, which are used extensively for building construction, aligning with the sustainability regulations, which will help the market to grow in the coming decade, and helps in the growth of the commercial sandwich panel market across the globe.
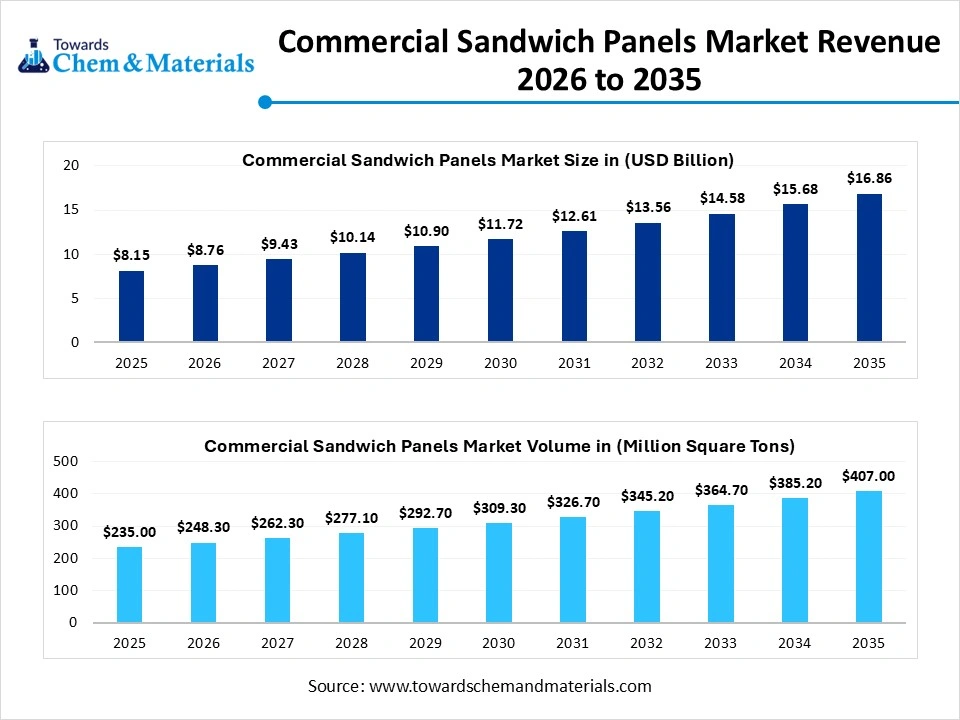
The global commercial sandwich panel market size was estimated at USD 8.15 billion in 2025 and is predicted to increase from USD 8.76 billion in 2026 to approximately USD 16.86 billion by 2035 and is expected to grow at a CAGR of 7.50% during 2025-2035; the global demand for commercial sandwich panels for construction and insulated building demand and also increased use in cold chain infrastructure fuels the growth of the market. Strict safety and thermal standards and demand from AI data centers help in market growth. The key players, such as Kingspan Group, Tata Steel, ArcelorMittal, Nucor Corporation, Metecno Group, and Assan Panel A.S., play a major role in the growth of the market.
Key Takeaway
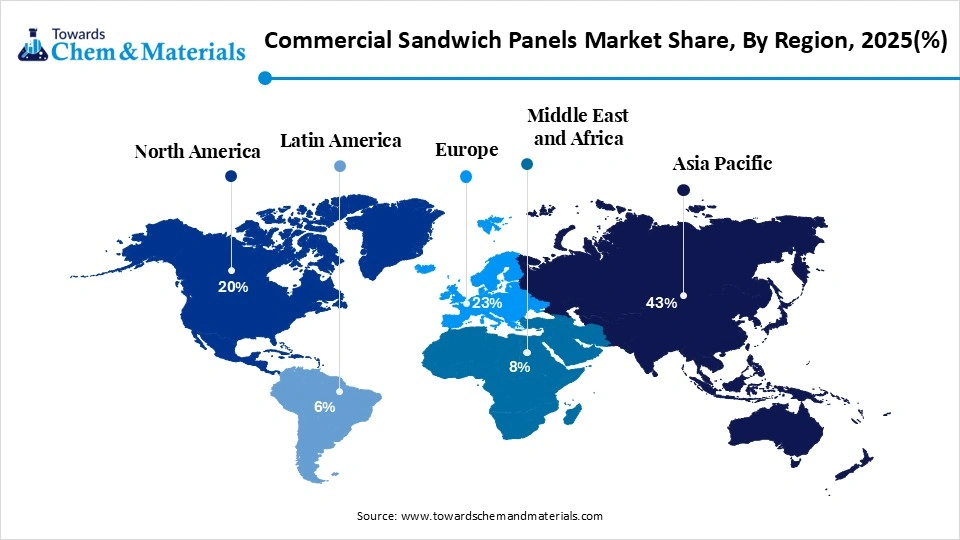
- By region, Asia Pacific dominated the commercial sandwich panels market with a share of 43% in 2025 and is expected to experience the fastest growth with a CAGR of 8.20% in the forecast period.
- By insulation material, the PIR/PUR segment dominated the market with a 58% share in 2025 and is expected to grow at a CAGR of 7.10% over the forecast period.
- By insulation material, the mineral wool segment held a 22% market share in 2025 and is expected to have the fastest growth with a CAGR of 8.80% in the forecast period.
- By facing material, the steel segment dominated the market with a 71% share in 2025 and is expected to grow at a CAGR of 7.20% over the forecast period.
- By facing material, the aluminum segment held a 22% market share in 2025 and is expected to have the fastest growth with a CAGR of 8.60% in the forecast period.
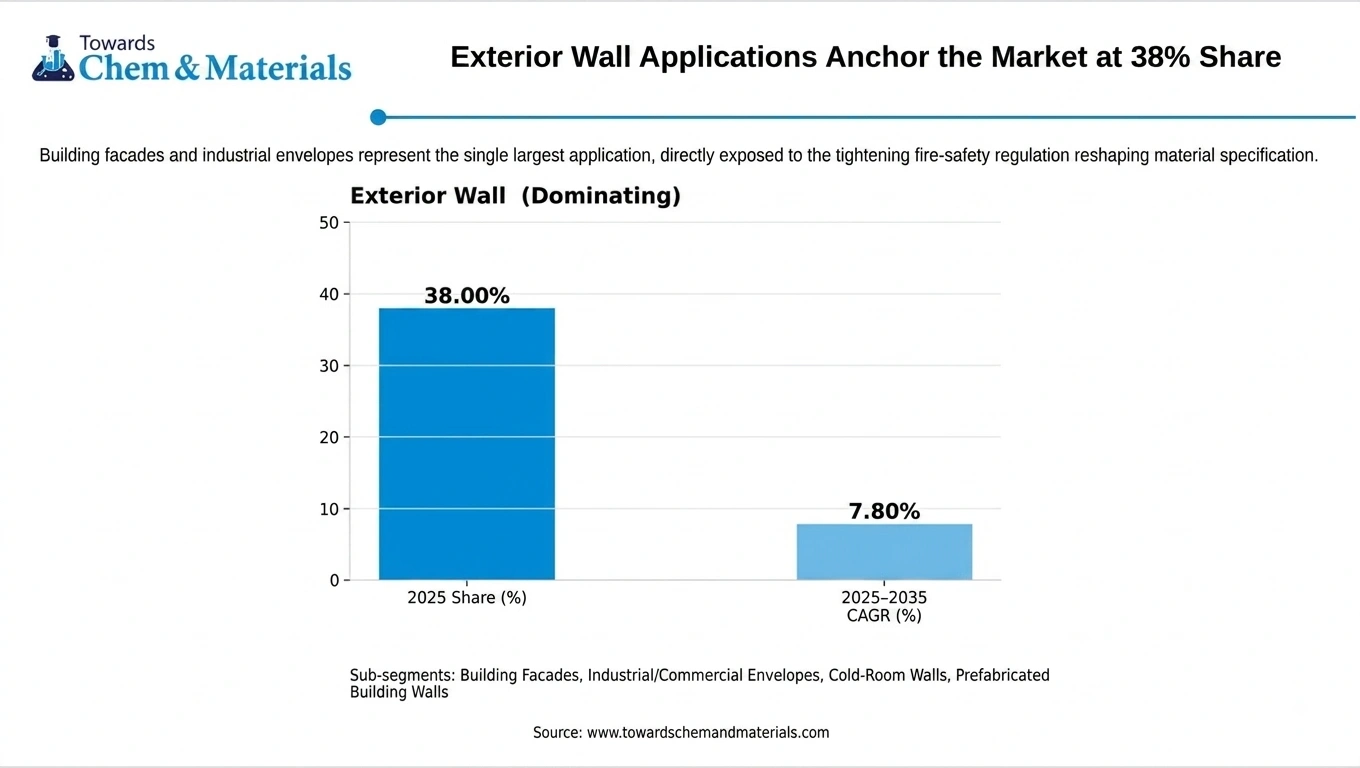
- By application, the exterior wall segment dominated the market with a 38% share in 2025 and is expected to grow at a CAGR of 7.80% over the forecast period.
- By application, the roofs segment held a 34% market share in 2025 and is expected to have the fastest growth with a CAGR of 8.40% in the forecast period.
Commercial Sandwich Panels Market Overview
According to research, it is observed that the commercial sandwich panels market is projected to have a market size of USD 8.15 billion in 2025 and is expected to reach approximately USD 16.86 billion in 2035. This growth is seen due to global demand for insulated buildings, and the use of sustainable materials for construction fuels the growth. The growing focus on supply chain and cloud infrastructure for data centers, due to growing demand for heat insulators, results in increased production. The commercial sandwich panel is widely used for its properties and for its lightweight, structural strength, weather resistance, and thermal insulation, propelling demand and resulting in rapid growth in the coming decade.
- Key Insight: The commercial sandwich panel market is increasing, with a market share of USD 8.15 billion in 2025.
The commercial sandwich panel market is expected to grow annually at 7.50% CAGR; this shows that there is consistent demand and cold chain infrastructure development plans in the global market. The steady construction demand and cold storage in commercial buildings, as they offer excellent energy efficiency and durability. The panels are highly effective and used to maintain the temperature in both the cold and warm climates, which makes them a preferred choice. The lightweight nature and versatility of the panels make it easier to transport and handle and also make installation easier, which not only saves labor costs but also reduces overall construction time, which will help in increased adoption, making the market grow.
- Key Insight: Compounding at 7.50% annually, the market's trajectory aligns closely with the supplied 2035 figure of USD 16.86 billion
According to the research performed, the chart shows that the commercial sandwich panels market is estimated to reach a shipment volume of 235 million square meters in 2025, highlighting the large physical manufacturing scale required to meet demand from construction and cold-chain infrastructure projects. Shipment volume is projected to increase substantially to around 407 million square meters by 2035, indicating sustained demand over the forecast period. Overall, the rise from 235 million to 407 million square meters represents strong long-term expansion in market volume, reflecting growing construction activity and investment in temperature-controlled and energy-efficient infrastructure.
- Key Insight: 235.0 million square meters of panel shipments in 2025 underscore the physical manufacturing scale required to supply global construction and cold-chain infrastructure projects.
According to the research performed, the chart shows that the commercial sandwich panels market volume is expected to grow steadily from 235 million square meters in 2025 to about 407 million square meters by 2035, representing a 5.60% volume CAGR. This indicates consistent expansion in the physical quantity of panels shipped over the forecast period. It notes that volume growth trails revenue growth of 7.50%; that is, revenue is increasing faster than the number of square meters sold. This suggests that factors such as higher panel prices, improved product specifications, premium insulated panels, and a shift toward higher-value solutions are contributing to market revenue growth.
- Key Insight: Volume CAGR (5.60%) trails the base year (7.50%) by nearly two full percentage points, showing that price and mix improvement contribute meaningfully to the markets' forecasted revenue growth.
According to the research performed, the chart shows that the average manufacturing cost of commercial sandwich panels was USD 28.40 per square meter in 2025. This manufacturing cost represents the expenses involved in producing the panel, including the insulation core, facing materials, and processing. This compares the cost with an average selling price of USD 34.68 per square meter, indicating that the final market price is higher than the manufacturing cost due to commercial markup and other downstream costs. Overall, the data shows that a cost-side view of the sandwich panel value chain indicates that material and processing costs form a significant part of the final product price.
- Key Insight: At USD 28.40 per square meter, manufacturing cost reflects the combined insulation core, facing material, and processing costs before commercial markup.
According to the research performed, the chart shows that the average selling price of commercial sandwich panels reached USD 34.68 per square meter in 2025, compared with an average manufacturing price of USD 28.40 per square meter. The difference of USD 6.28 per square meter represents an implied gross margin of about 18.1% of the selling price. This means manufacturers capture a relatively modest margin between production cost and the final selling price. The relatively narrow margin indicates that raw material and manufacturing cost fluctuations can have a meaningful impact on profitability, particularly because insulation materials, facing materials, energy, and processing contribute significantly to production costs. Overall, the chart highlights that the market has a limited pricing buffer between manufacturing costs and selling prices.
- Key Insight: The implied gross margin of USD 6.28 per square meter (18.1% of selling price) is relatively thin, leaving limited buffer to absorb raw material cost volatility in MDI and steel.
According to the research performed, this chart compares the CAGR of manufacturing price, selling price, market volume, and market revenue from 2025 to 2035 for the commercial sandwich panels market. Market volume is expected to grow at a 5.60% CAGR, while revenue grows at a 7.50% CAGR. In contrast, the manufacturing price grows by only 1.80% and the selling price by 1.90%. This indicates that the market's expansion is being driven primarily by higher physical demand and shipment volumes rather than significant price increases. The faster revenue growth compared with volume also suggests that product mix, premium panels, and higher-value applications may contribute to additional revenue generation. Overall, the chart indicates a volume-driven growth structure, with relatively limited pricing power.
- Key Insight: With both pricing CAGRs sitting below 2% versus 5.60–7.50% for volume and revenue, this market's growth is overwhelmingly volume-driven rather than price-driven, a structural constraint on manufacturer pricing power.
Commercial Sandwich Panels Market Value Consistently Outpaces Volume Growth Through 2035
According to the research performed, the chart compares market value growth with market volume growth from 2025 to 2035 and shows that market value is consistently growing faster than physical volume. The commercial sandwich panels market starts at approximately USD 8.15 billion in 2025, with market value projected to grow at a 7.50% CAGR, while market volume starts at 235 million square meters and grows at a 5.60% CAGR. This difference means that the market is not expanding only because more panels are being sold, higher-value products, changes in product mix, and moderate price improvements are also contributing to revenue growth. Therefore, the market demonstrates steady physical demand expansion while generating even stronger growth in monetary terms, creating a value-led layer on top of volume-driven demand.
- Key Insight: Value grows visibly faster than volume across the full forecast horizon, confirming a moderate mix-and-price-led expansion layered on top of steady physical demand growth.
A Decade of Growth Adds USD 8.71 Billion in New Market Value
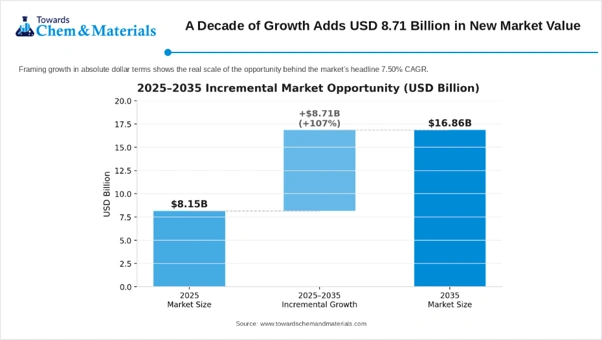
According to the research performed, the chart shows that the commercial sandwich panels market is expected to more than double in value between 2025 and 2035. Market size is projected to increase from USD 8.15 billion in 2025 to USD 16.86 billion by 2035, resulting in an incremental market opportunity of USD 8.71 billion, or approximately 107% growth over the decade. This indicates substantial expansion in demand across applications such as commercial buildings, industrial facilities, warehouses, roofing, and cold-storage infrastructure. The large increase in absolute market value highlights a significant revenue opportunity for manufacturers and suppliers as construction activity, infrastructure investment, and demand for insulated building solutions continue to expand.
- Key Insight: The market is set to more than double (+107%) over the decade, adding roughly USD 8.71 billion in incremental value across exterior wall, roofing, and cold-storage applications.
Commercial Sandwich Panels Market Segmental Analysis
By Insulation Material
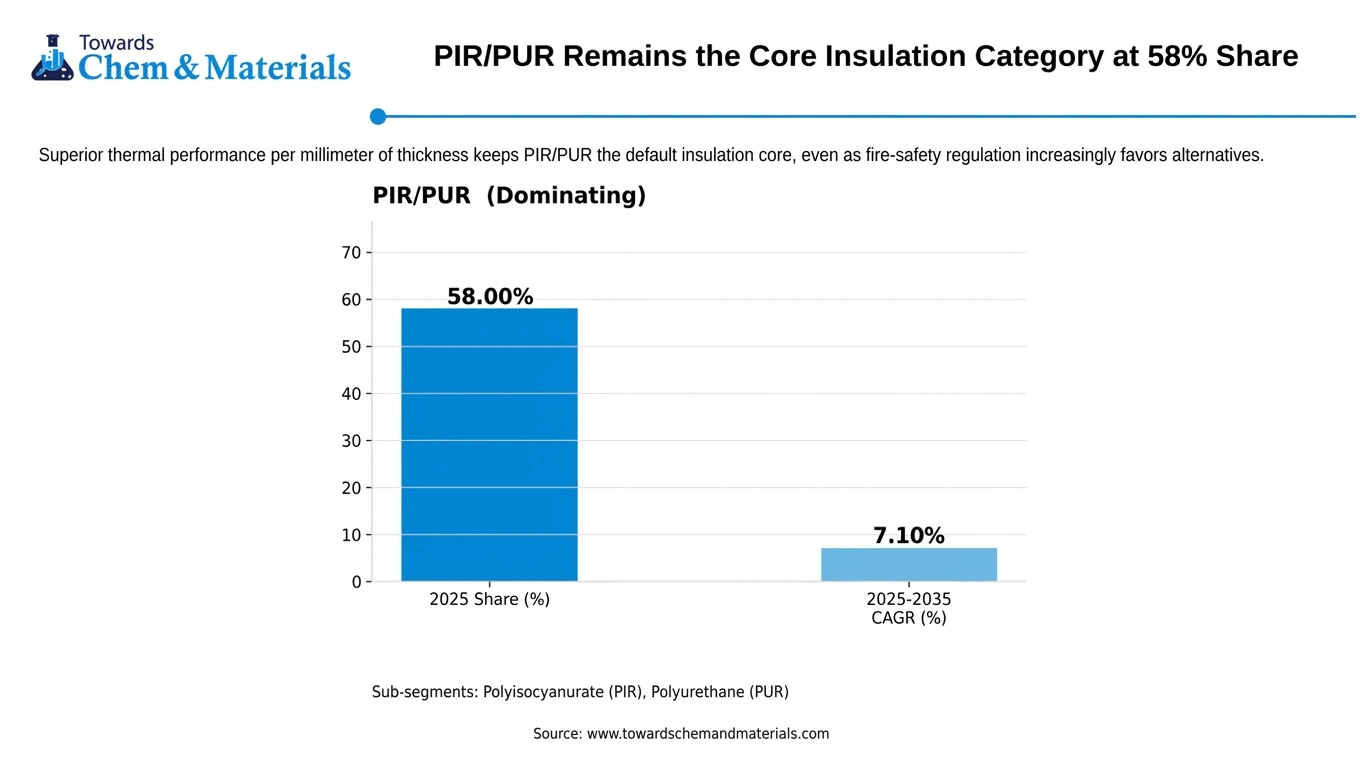
The PIR/PUR segment dominated the market with a 58% share in 2025 and is expected to grow at a CAGR of 7.10% over the forecast period, driven by increasing demand for energy-efficient building envelopes, stringent thermal performance codes, superior fire safety ratings, and rapid modular construction capabilities, which support the growth of the market. Exceptional low thermal conductivity significantly reduces commercial heating and cooling expenditure, further supporting the growth of the market.
- Key Insight: Superior thermal performance per millimeter of thickness keeps PIR/PUR the default insulation core, even as fire-safety regulation increasingly favors alternatives in regulated applications.
The mineral wool segment held a 22% market share in 2025 and is expected to have the fastest growth, with a CAGR of 8.80% in the forecast period, experiencing rapid growth driven by strict fire-safety regulations, increasing demand for non-combustible thermal insulation, and rapid industrialization in developing regions. Rising emphasis on sustainable building envelopes and green certifications accelerates the adoption of high-performance acoustic and thermal insulation, further boosting growth.
- Key Insight: Non-combustible fire performance is driving mineral wools above-average growth as fire-safety codes tighten across major commercial construction markets, particularly in Europe.
By Facing Material
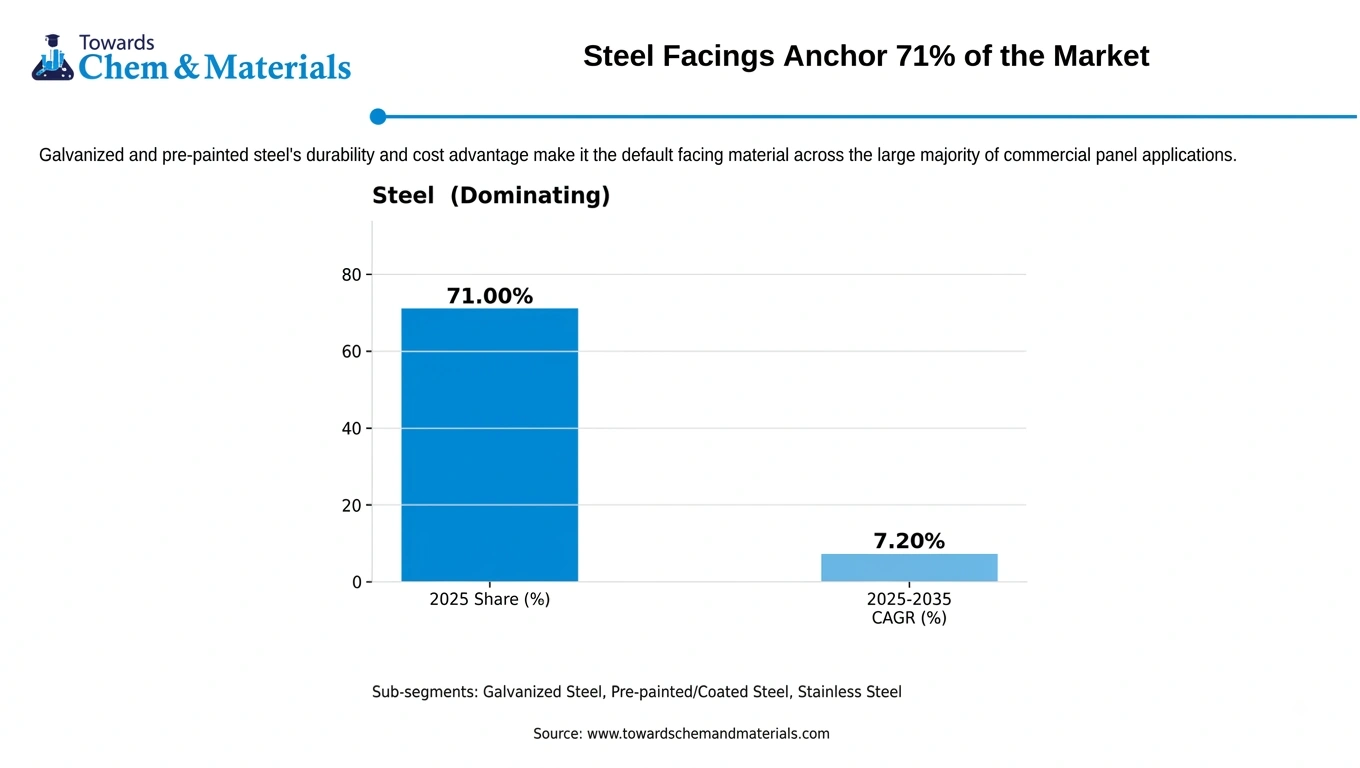
The steel segment dominated the market with a 71% share in 2025 and is expected to grow at a CAGR of 7.20% over the forecast period. It continues to experience steady growth due to its high structural integrity, fire resistance, durability, cost-effectiveness, and compatibility with prefabricated and green building practices. Steel skins are typically bonded to Polyurethane (PUR/PIR) or Mineral Wool cores, with mineral wool gaining momentum as strict non-combustible fire safety standards further support the growth of the market.
- Key Insight: Galvanized and pre-painted steels durability and cost advantage make it the default facing material across the large majority of commercial panel applications.
The aluminium segment held a 22% market share in 2025 and is expected to have the fastest growth with a CAGR of 8.60% in the forecast period, because they offer superior corrosion resistance, high durability, aesthetic flexibility, and excellent thermal performance compared to traditional steel or fiber-reinforced facings, which drives the growth of the market. The growing benefits offered and its ability not to rust in comparison to other alloys further fuel the growth of the market, supporting expansion.
- Key Insight: Aluminums lighter weight and corrosion resistance are driving above-average growth in coastal, architectural, and weight-sensitive facade applications.
By Application
The exterior wall segment dominated the market with a 38% share in 2025 and is expected to grow at a CAGR of 7.80% over the forecast period. driven by increasing demand for high-performance building envelopes, strict energy efficiency codes, and rapid growth in modular and prefabricated industrial and logistics infrastructure supporting the growth of the market. The dominance and core insulation for the growing demand further fuel the growth of the market.
- Key Insight: Building facades and industrial envelopes represent the single largest application, directly exposed to the tightening fire-safety regulation reshaping material specification across major markets.
The roofs segment held a 34% market share in 2025 and is expected to have the fastest growth, with a CAGR of 8.40% in the forecast period. This momentum is driven by surging investments in logistics, industrial infrastructure, and energy-efficient building requirements, which further fuels the growth of the market. Insulated roof panels drastically cut down heating and air-conditioning costs by offering high thermal resistance. This energy-efficiency characteristic is a major shareholder for the growth of the market.
- Key Insight: Industrial and commercial roofing demand is outpacing every other application, reflecting the scale of warehouse, logistics, and manufacturing facility construction globally.
Commercial Sandwich Panels Market Regional Analysis
The Asia-Pacific commercial sandwich panels market size was valued at USD 3.50 billion in 2025 and is projected to grow from USD 3.77 billion in 2026 to USD 7.33 billion by 2035, at a CAGR of 7.67% from 2026 to 2035.Asia Pacific dominated the commercial sandwich panels market with a share of 43% in 2025 and is expected to experience the fastest growth with a CAGR of 8.20% in the forecast period.
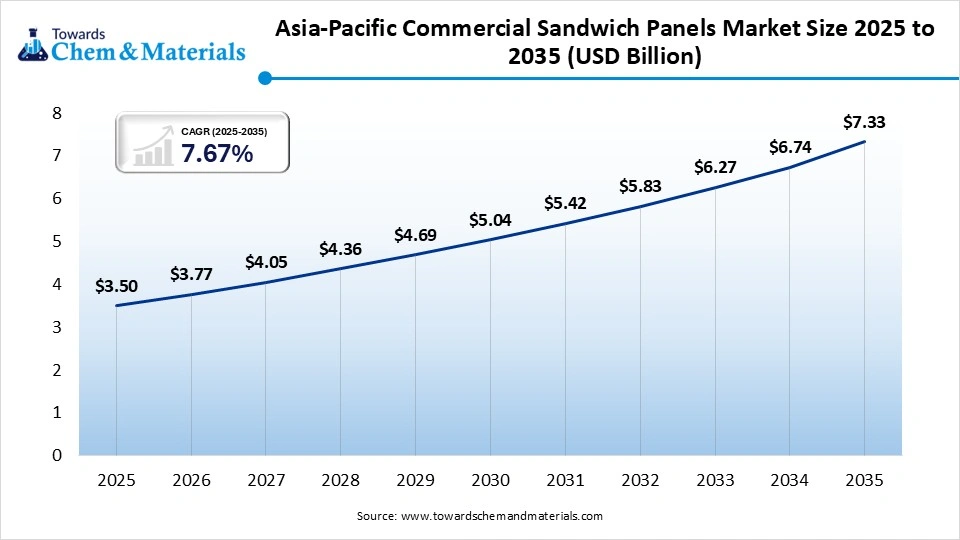
According to the research performed, it was noticed and noted that there is a significant shift in construction activity from generic to highly specialized and technical infrastructure, which is influenced by the growing demand and supply chain movement that propels the growth of the market. There is a shift in factory infrastructure as well, where there is use of high-strength, precision-engineered sandwich panels due to demand from data centers and cloud investments, which require insulation for high-density AI servers, supporting demand. In India, there is massive advancement in the cold chain and warehouse boom through initiatives like the PM Gati Shakti national plan, which are aligning with the modernization of facilities, especially in pharmaceuticals, cleanrooms, electronics, and agriculture. For instance, Gujarat, Maharashtra, and Tamil Nadu have made PUF panels a core and major structural mandate.
- Key Insight: China combines the largest share of global industrial and cold-chain construction activity with rapidly expanding demand, giving Asia-Pacific the rare distinction of leading on both scale and growth simultaneously.
Europe Holds 23% Share Amid Tightening for Safety Regulation.
Europe holds a 23% share in the commercial sandwich panel market in 2025, according to the research it was noticed that the growth is driven by strict energy-efficiency mandates under the European Green Deal, the rise of modular construction, and cold-chain infrastructure growth. Core segments are led by polyurethane and fire-resistant mineral wool panels, supporting the growth over a period of time. The energy regulations, fire safety compliance, and sector demand further fuel the growth. Germany, France, the UK, and Italy account for the lions share of regional consumption, supported by active industrial restructuring and green building incentives. Key industry participants include Kingspan Group, ArcelorMittal Building Solutions, Manni Group, and Metecno who has a major role in the growth and expansion of the market. For instance, Invespanels partnership with ArcelorMittal utilizes XCarb recycled steel and high-performance thermal insulated systems like ArcelorMittals Maukatherm. Increased manufacturing footprints include Teknopanels production expansion and Isopan Ests output across Europe.
- Key Insight: Post-Grenfell building safety reforms are reshaping which insulation and fire-resistant materials European specifiers can use in commercial panel systems.
North America Holds 20% Share on Steady Cold Chain and Industrial Demand.
North America holds a 20% share in the commercial sandwich panel market in 2025. According to the research, it was noted that a surge in e-commerce warehouse construction, cold-chain logistics, data centers, and stringent energy-efficiency regulations requiring high-performance building envelopes are the major factors that support the growth of the market. Stricter decarbonization goals from the U.S. Department of Energy have fueled product launches tailored for retrofitting aging commercial properties to minimize heating and cooling loss, which is a major growth factor in the region. Newly built distribution hubs and fulfillment centers across the U.S. and Canada utilize insulated metal panels for rapid wall and roof installation, resulting in the growth and expansion of the market.
- Key Insight: Established cold storage, food processing, and light-industrial construction sustain a stable, moderate-growth regional market.
Middle East and Africa Post the Second-Fastest Growth at 8.70% CAGR
Middle East and Africa holds an 8% share in the commercial sandwich panel market in 2025; according to the research, it was noted that massive infrastructure investments, logistics warehousing, and stringent energy-efficiency building codes are the major growth drivers in the region. Saudi Arabia and the United Arab Emirates lead the market launch and adoption of advanced composite panels, spurred by government diversification initiatives like Saudi Vision 2030, which will also help in the growth supporting the management, and expansion. Nations in East and West Africa, alongside South Africa and Egypt, show surging demand driven by expansions in the cold chain logistics, agricultural storage, and commercial retail sectors due to emerging demand.
- Key Insight: Large-scale logistics, cold storage, and industrial construction tied to economic diversification programs are driving above-average regional growth.
Latin America Holds the Smallest Regional Share at 6%
Latin America holds a 6% share in the commercial sandwich panel market in 2025; according to the research, it was noted that surging industrial, logistics, and retail construction led primarily by Brazil, Mexico, and Chile. Adoption is centered on fast-assembly, energy-saving insulated envelopes for warehouses, cold storage, and modular commercial spaces, driving the growth of the market. The thermal efficiency, fire safety rating, cost, and lightweight nature, which are used widely in high-rise buildings and data centers, boost the growth of the market in the region.
- Key Insight: Limited industrial construction investment keeps Latin America the smallest regional market, though growth remains broadly in line with the global average.
Commercial Sandwich Panels Market Recent Developments
- In October 2025, ArcelorMittal launched the Helioroof production line in Contrisson, France, an innovative roofing product that combines steel roofing panels, thermal insulation, and solar cells, aligning with sustainability regulations.(Source:constructalia.arcelormittal.com)
- In December 2025, Mount Roofing and Structures Pvt. Ltd., a rapidly expanding manufacturer in PUF and a top provider of Pre-Engineered Buildings (PEB) and Polycarbonate Sheets, has inaugurated its second automated continuous Sandwich Panel production line and a PEB manufacturing facility at its large campus in Tumkur.(Source:www.moneycontrol.com)
Top players in the Pigment Grade Titanium Dioxide Market & Their Offerings
- Nippon Steel Corporation: Its headquarters are located in Tokyo, Japan. Its core business is that it is the world’s largest steel producer, which also manufactures flat-rolled steel products, including hot-rolled, cold-rolled, and coated steel, used as facing material inputs for sandwich panel manufacturing.
- United States Steel Corporation: Its headquarters is located in Pittsburgh, Pennsylvania, USA. Its core business includes manufacturing flat-rolled steel products, including hot-rolled, cold-rolled, and galvanized coils used in commercial sandwich panel facings.
- Covestro AG: Its headquarters is located in Leverkusen, Germany. It is a major global producer of MDI, polyols, and other polyurethane raw materials used as the core feedstock for PIR/PUR insulation cores in commercial sandwich panels.
- BASF SE: Its headquarters is located in Ludwigshafen, Germany. It is the worlds largest chemical producer, manufacturing MDI, polyols, and other polyurethane system components used in PIR/PUR insulation core production for sandwich panels. They announced new and sustainable polyurethane concepts and recycling methods and collaborated with Remondis Electro Recycling, RAMPF Eco Solutions, and KraussMaffei to produce recycled polyols.
- Dongsung Chemical Co., Ltd.: Its headquarters is located in Seoul, South Korea. It is a major South Korean polyurethane materials manufacturer producing prepolymers, polyester polyols, and polyurethane resins used across insulation and industrial applications. It has opened a new polyurethane production plant in Karawang, Indonesia, with 67,000 tonnes per year of capacity.
- Kingspan Group (Ireland)
- Nucor Corporation (US)
- ArcelorMittal (Luxembourg)
- Tata Steel (India)
- Cornerstone Building Brands (US)
- Recticel NV/SA (Belgium)
- Metecno Group (Italy)
- Isopan S.p.A. (Italy)
- Assan Panel A.S. (Turkey)
- BRUCHA GmbH (Austria)
- Lattonedil S.p.A. (Italy)
- Manni Group S.p.A. (Italy)
- DANA Group of Companies (UAE/India)
- KPS Global LLC (US)
- WGI Westman Group Inc. (Canada)
- Norbec Inc. (Canada)
- Balex Metal (Poland)
- Hemsec Manufacturing Ltd. (UK)
- Jiangsu Jingxue Insulation Technology Co. Ltd (China)
- FALK Bouwsystemen B.V. (Netherlands)
Expert insight
According to my research and assessment, the market is shifting towards energy-efficient and lightweight materials for high-end insulation, and demand for data centers is a major factor. Production, due to growing demand in regions to lower dependency and increase competitiveness among consumers and suppliers, is a major factor in the forecast growth.
Our Experts
Vidyesh Swar led the research based on primary market research, analysis, and optimisation of market trends, segmental and regional trends, methodology, growth opportunities, competitive analysis, volume and market growth, pricing and manufacturing analysis, and optimising product performance for the forecast period.
Aman is responsible for providing and analysing company insights, regulations, statistical analysis and optimisation, partnership and collaboration between companies, and the quantitative data that helps in strengthening the market expansion.
Aditi reviewed the entire research document, performed quality checks, validated findings, refined content, corrected inconsistencies, and finalised the report to ensure accuracy, clarity, credibility, and readiness for publication.
Complete Market Segmentation Listing
By Insulation Material
- PIR/PUR
- Polyisocyanurate (PIR)
- Polyurethane (PUR)
- Polystyrene
- Expanded Polystyrene (EPS)
- Extruded Polystyrene (XPS)
- Mineral Wool
- Rock Wool
- Glass Wool
- Other Insulation Materials
- Phenolic Foam
- Vacuum Insulation
- Hybrid Insulation Cores
By Facing Material
- Steel
- Galvanised Steel
- Aluminum
- Plain Aluminium
- Pre-coated Aluminum
- Embossed Aluminum
- Other Facing Materials
- Fiber-Reinforced Polymer
- Fibreglass
- Other Composite Facings
By Application
- Interior Wall
- Partition Walls
- Cleanroom Walls
- Office/Commercial Interior Walls
- Service/Utility Areas
- Exterior Wall
- Building Facades
- Industrial/Commercial Envelopes
- Cold-Room Walls
- Prefabricated Building Walls
- Roofs
- Flat/Low-Slope Roofs
- Pitched Roofs
- Industrial Roofs
- Commercial Roofs
- Ceilings
- Suspended Ceilings
- Insulated Ceilings
- Cleanroom Ceilings
- Other Applications
- Cold Storage Enclosures
- Modular Structures
- Temporary Commercial Structures
- Specialised Enclosures
By Regions
- North America
- Europe
- Asia Pacific
- Middle East & Africa
- Latin America
A Seven-Phase Framework
Our methodology is designed to be universally applicable across commodity chemicals, specialty chemicals, petrochemicals, construction chemicals, coatings, electronic chemicals, industrial gases, agrochemicals, water treatment chemicals, and performance materials. Each phase builds upon the last, creating a layered validation structure that minimizes estimation error and maximizes analytical confidence.
The framework ensures comprehensive market coverage, robust cross-validation, and reliable long-term forecasting — producing market estimates that withstand scrutiny from investors, regulators, and corporate strategy teams.

Seven-Phase Framework — Analytical Effort Distribution
Relative analytical effort allocated across each phase of the Chemicals & Materials research framework

Phase 1 - Secondary Research: Establishing the Foundation
Secondary research collects and evaluates publicly available information from authoritative sources, establishing the foundational understanding of market structure, value chain dynamics, competitive landscape, and end-use demand patterns. Every source is evaluated for credibility, recency, geographic relevance, and methodological soundness before inclusion.
Industry Associations
Sources include ACC, CEFIC, ICCA, JCIA, CPCIF, and SOCMA providing production volumes, consumption trends, capacity developments, and sustainability initiatives.
Company Disclosures
Annual reports, investor presentations, earnings transcripts, and regulatory filings reveal product portfolios, manufacturing footprints, capacity expansions, and revenue segmentation.
Government Databases
National statistical offices, customs authorities, environmental agencies, and industrial production databases provide verified statistics on output, trade flows, and regulatory compliance.
Trade Databases
UN Comtrade, ITC, Eurostat, and national customs authorities enable assessment of global product movement, import dependency, and export competitiveness across regions.
Our Secondary Research Sources
- Ministry of Chemicals and Fertilizers
- European Chemicals Agency
- United States Department of Energy
- Ministry of Industry and Information Technology
- Ministry of Economy Trade and Industry
- Ministry of Trade Industry and Energy
- National Institute of Standards and Technology
- Council of Scientific and Industrial Research
- Fraunhofer Society
- National Institute for Materials Science
Phase 2 — Supply-Side Assessment: Mapping Production Capabilities
Production Capacity Analysis
All major manufacturers are assessed for existing installed capacity, planned additions, expansions, new plant announcements, and technology adoption — mapped at global, regional, and country levels.
Capacity Utilization Adjustment
Installed capacity is adjusted using utilization rates based on demand conditions, feedstock availability, plant operating rates, maintenance schedules, and regulatory restrictions.
Manufacturer Revenue Analysis
Product-specific revenues, segment-level performance, regional distribution, average selling prices, and margin trends are evaluated to establish market value estimates.
Supply-Side Assessment — Capacity vs. Effective Production by Region
Illustrative comparison of installed capacity vs. effective production volume (after utilization rate adjustment) across major regions

Phase 3 — Demand-Side Assessment: Quantifying Chemical Consumption
Demand-side analysis quantifies chemical consumption across industries, applications, and geographies — identifying where and how chemicals are consumed throughout the value chain with precision.
End-Use Industry Analysis
Chemical demand is evaluated across automotive, construction, packaging, electronics, agriculture, healthcare, consumer goods, industrial manufacturing, energy and utilities, and water treatment. Industry output, production trends, and consumption intensity are analyzed to determine demand patterns.
Consumption Modeling
Demand is estimated using measurable indicators: kilograms per vehicle, kilograms per square meter of construction, dosage per cubic meter of water treated, kilograms per hectare of agricultural land, and kilograms per ton of manufactured products. Consumption factors are validated through industry publications and primary interviews.
Application Analysis
The market is segmented by application area to understand product performance requirements, formulation trends, technology adoption, customer preferences, and regulatory requirements improving demand accuracy and segmentation granularity.
Demand-Side Assessment — End-Use Industry Demand Distribution
Illustrative distribution of chemical & materials demand across key end-use industries

Phase 4 - Trade Flow Analysis: Balancing Regional Supply and Demand
Trade flow analysis reconciles regional supply and demand estimates through import and export data, identifying net supply positions, regional dependencies, and market imbalances. It serves as an independent validation layer that tests the consistency of supply-side and demand-side estimates.
Import Analysis
Import data is evaluated to determine volumes, source countries, product dependency, regional supply gaps, and pricing trends — identifying markets that rely heavily on external supply and where domestic production is insufficient to meet demand.
Export Analysis
Export assessments reveal production surplus, export competitiveness, regional manufacturing strength, and global market participation. Export patterns also help validate domestic production estimates and identify net exporting regions.
Apparent Consumption Model
Regional consumption is assessed using the standard apparent consumption formula:
Results identify net importing regions, net exporting regions, regional deficits, and surpluses — serving as an independent validation of supply and demand estimates.
Trade Flow Analysis — Net Supply Position by Region
Illustrative apparent consumption vs. domestic production across major regions — positive gap indicates net import dependency

Phase 5 — Primary Research: The Critical Validation Layer
Primary research tests and refines findings from secondary research through direct engagement with industry participants across the supply chain, demand side, and expert community. It captures intelligence that no database or published report can provide — the real-world experience of manufacturers, buyers, and specialists operating in the market.

Supply-Side Interviews
Conversations with chemical manufacturers, raw material suppliers, contract manufacturers, technology providers, and plant operators cover production trends, capacity utilization, pricing developments, technology shifts, and competitive dynamics.

Demand-Side Interviews
Engagement with OEMs, industrial consumers, procurement managers, distributors, formulators, and end-use manufacturers focuses on consumption trends, purchasing behavior, product substitution, demand outlook, and emerging applications.

Industry Expert Consultations
Additional interviews with industry consultants, independent experts, regulatory specialists, technical professionals, and research institutions provide deeper market context and validate key analytical assumptions.
Focus Areas of Primary Research:
Market Size & Forecast Validation
Revenue estimates, volume consumption, growth rates, forecast assumptions, regional demand.Supply Chain & Value Chain Assessment
Raw material sourcing, supply chain challenges, distribution networks, procurement practices.Production & Capacity Analysis
Manufacturing capacity, utilization rates, expansion projects, plant investments.Pricing & Cost Structure Analysis
Product pricing trends, feedstock costs, energy costs, margin pressures, pricing outlook.Competitive Landscape Assessment
Volume and value estimates confirmed to be fully consistent with one another before publicationInterview Volume by Market Scope
| Study Scope | Number of Interviews |
|---|---|
| Niche Market | 20 – 30 |
| Mid-Sized Market | 30 – 50 |
| Global Market | 50 – 80 |
| Highly Fragmented Market | 80 – 120 |
Interview Details:
Category : Manufacturers, Suppliers, Distributors, End Users, Experts/Associations
Average Duration : 30–60 Minutes
Interview Mode : Video calls, telephonic interviews, expert consultations
Interview Format : Structured / Semi-Structured questionnaire
Focus Areas of Primary Research:
Market Size & Forecast Validation :
Revenue estimates, volume consumption, growth rates, forecast assumptions, regional demand.
Supply Chain & Value Chain Assessment :
Raw material sourcing, supply chain challenges, distribution networks, procurement practices.
Production & Capacity Analysis :
Manufacturing capacity, utilization rates, expansion projects, plant investments.
Pricing & Cost Structure Analysis :
Product pricing trends, feedstock costs, energy costs, margin pressures, pricing outlook.
Competitive Landscape Assessment :
Market share, competitor positioning, strategic initiatives, partnerships, acquisitions.
Primary Research — Stakeholder Coverage by Category
Distribution of interview respondents across stakeholder categories (% share from PPT data)

Primary Research — Respondent Designation Profile
Seniority breakdown of interview respondents (% share from PPT data)

Primary Research — Geographic Coverage of Interviews
Regional distribution of primary research engagement (% share from PPT data)

Phase 6 — Data Triangulation and Market Validation
No single methodology is relied upon in isolation. Multiple independent estimation approaches are combined and reconciled to ensure consistency, accuracy, and analytical defensibility. Any material deviations between approaches are investigated and adjusted through additional validation cycles.
The final market size is derived through weighted triangulation of all validated methodologies. Any material deviations between approaches are investigated and adjusted through additional validation cycles. The outcome represents the most realistic assessment of the market based on available evidence and expert confirmation ensuring that volume and value estimates are fully consistent with one another.
Triangulation Framework — Input Contribution Weight
Relative weight each sizing input contributes to the final reconciled market estimate

Phase 7 — Forecast Modeling: Projecting Future Market Evolution
Forecasting evaluates the future trajectory of the market using a combination of quantitative indicators and qualitative assessments across economic, industry, and regulatory dimensions. Rather than simple extrapolation, each driver is independently modeled and integrated into a composite forecast.
Macroeconomic Indicators
GDP growth, industrial production, manufacturing output, construction activity, consumer spending, and capital investment form the quantitative foundation of long-term demand projections. These are applied at country, regional, and global levels.
Industry Growth Drivers
Urbanization, infrastructure development, industrialization, technological innovation, sustainability initiatives, and evolving product performance requirements are assessed at regional and industry levels — capturing both structural and cyclical demand drivers.
Capacity Expansion Analysis
Announced plant expansions, new manufacturing facilities, technology upgrades, and strategic investments are evaluated to determine future supply-demand dynamics and potential market tightness or oversupply situations.
Regulatory & Sustainability
Environmental regulations, chemical safety standards, emission reduction targets, circular economy initiatives, and sustainability requirements are incorporated as they often influence product adoption rates and market growth trajectories.
Scenario Forecast Range — Indexed Market Growth (Year 1–10)
Illustrative indexed growth trajectories across Base, Optimistic, and Pessimistic scenarios over a 10-year forecast horizon

Forecast Drivers — Relative Impact Score by Category
Impact score (0–100) of each driver type on chemicals & materials market forecast




Comments
Share your thoughts, ask a question, or provide feedback about this report.