
What is the Asia Pacific Fine Chemicals Market Size and Share?
The Asia Pacific fine chemicals market size was valued at USD 104.85 billion in 2025 and is projected to grow from USD 110.98 billion in 2026 to USD 185.13 billion by 2035. Growth is driven by rising purity requirements in electronics, agrochemical innovation, pharmaceutical outsourcing, and supply-chain diversification. The report covers market size, segmentation, pricing, demand-supply, value chain, trade, technology, regulation, and customer analysis. It also provides competitive benchmarking, market share, M&A, strategic developments, and profiles of leading companies across the region.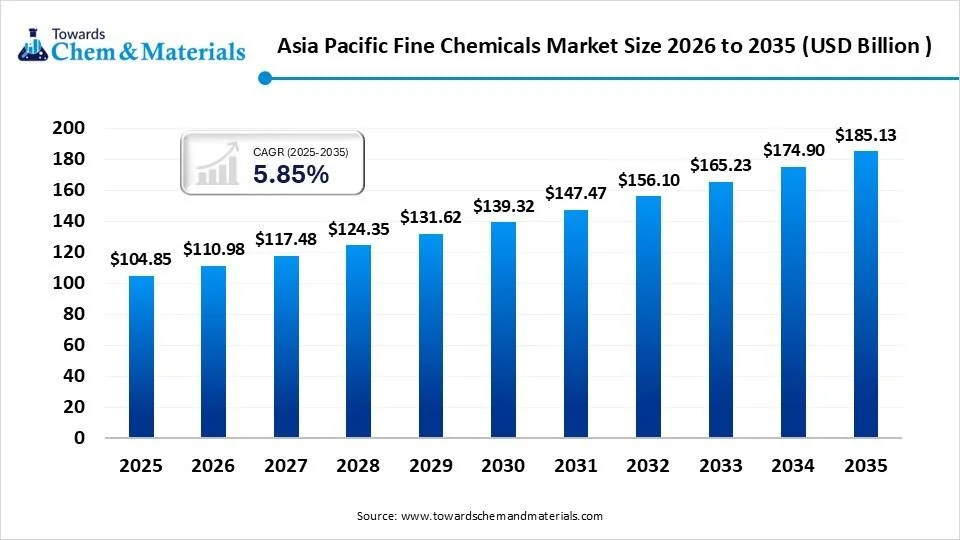
Key Takeaways
- Asia Pacific is evolving from a low-cost production base into a strategic global hub for fine chemicals, driven by pharmaceutical outsourcing, semiconductor expansion, agrochemical innovation, and supply-chain diversification.
- Pharmaceuticals remain the largest end-use segment, while electronics and semiconductor materials offer the fastest growth, with electronics chemicals expected to expand at around 9–10% CAGR through 2035.
- Custom synthesis and contract manufacturing are emerging as the most attractive business models, supported by higher growth, longer customer relationships, and stronger margin potential than standardized products.
- Specialized and high-complexity chemistries command significant pricing and margin premiums, with prices ranging from roughly USD 3–15/kg for commodity-like intermediates to USD 1,000+/kg for certain regulated products.
- Supply is relatively abundant for standard intermediates but increasingly constrained for specialized chemistries, particularly fluorinated, high-potency, and ultra-high-purity products where qualification requirements limit available capacity.
- China remains the dominant regional market, while India is positioned as the fastest-growing major market, benefiting from increasing pharmaceutical and agrochemical outsourcing and global efforts to diversify sourcing.
- Technology, regulatory compliance, and supply reliability are becoming key competitive differentiators, with continuous-flow chemistry, biocatalysis, fluorination, and ultra-high-purity processing gaining importance.
- Future value creation is expected to concentrate in high-specification and technically complex products, including semiconductor chemicals, peptides, fluorinated products, complex pharmaceutical intermediates, and low-carbon chemical routes, while undifferentiated producers face greater margin pressure.
Overview: Asia Pacific has Moved from Low-Cost Producer to the Center of Global Fine Chemical Supply
China represents around 46% of the regional share, followed by India with 18%, Japan with 12%, South Korea with 8%, and ASEAN with 16%. Pharmaceuticals form the largest revenue pool at about 32%. Electronic semiconductor materials are the fastest-growing segment with 9-10% CAGR over the forecast period.
Three structural forces define the market:
- Supply-chain diversification away from single-country sourcing.
- Rising purity and quality requirements.
- A shift from transactional intermediate supply to long-term custom development and manufacturing contracts.
- The market is highly fragmented. The top 10 producers hold an estimated 23–25% of regional revenue, with thousands of small and mid-sized producers beneath them.
Key Coverage
- 2026–2035 forecasts
- Regional share, with country-level detail for 12 economies
- Fastest-growing, highest-value, and declining segments
- Market concentration and maturity assessment
- Incremental revenue opportunity by segment
Segmentation Analysis: Pharmaceutical Intermediates Dominate Value, While Electronic Chemicals Offer the Fastest Growth
- By end-use, the pharmaceuticals segment dominated the market with the largest share of 36% in 2025 and is expected to grow at a CAGR of 6.5% during the forecast period.
- By end-use, the electronics and semiconductor materials segment held a 13% market share in 2025 and is expected to grow at the highest CAGR of 9-10% over the forecast period.
- By product type, the advanced intermediates segment dominated the market with the largest share of 43% in 2025, followed by the active ingredients with ~29% share, the building blocks and reagents with ~17% share, and other with 11% share.
- By business model, custom synthesis and contract manufacturing is the highest-value and fastest-growing segment, at about 9% CAGR during the forecast period.
- By chemistry, fluorinated, heterocyclic, chiral, high-purity, and organometallic chemistries command the strongest premiums.
Key Coverage
- Revenue, volume, share, and CAGR by end-use, product type, chemistry, and business model.
- Growth contribution by segment.
- Chemistry-level analysis (fluorination, chiral, heterocyclic, high-purity).
- Emerging segments such as semiconductor process chemicals, peptide intermediates, and electrolyte additives.
Market Dynamics: Outsourcing, Purity Demand, and Environmental Compliance are Resetting Cost and Competitive Structure
Drivers
The Asia Pacific fine chemicals market is being pushed forward by four main forces. Global pharmaceutical companies keep moving the manufacture of small-molecule intermediates to the region, which gives producers steady and repeat demand. At the same time, new semiconductor fabs across Asia Pacific are raising the need for ultra-high-purity chemicals. Agrochemical innovation is also helping, since newer active ingredients tend to be complex, halogenated molecules that only capable producers can make. Finally, multinational buyers no longer want to depend on a single country for supply, so they are qualifying additional suppliers elsewhere in the region.
Restraints
Growth is held back by cost and demand pressures. Raw materials make up roughly 60-70% of the cost of goods sold, so producers feel every swing in feedstock prices. Environmental compliance is another burden, and smaller plants can see operating costs rise by 8-15% as a result.
Opportunities
Producers that modernize and lock in demand stand to gain the most. Continuous-flow manufacturing can shorten cycle times by 35-50%, which improves yields, consistency, and capacity use. Long-term supply contracts offer a second route, giving manufacturers more predictable volumes and steadier margins.
Challenges
The main risks are external factors. Trade and tariff friction can disrupt established export routes and make pricing harder to predict. Stricter enforcement of plant closures could take out capacity, especially among smaller operators. And where some large customers account for most of a producer's revenue, losing even one of them can hit hard.
Key Coverage
- Quantified driver and restraint impact
- Cost-curve analysis
- Demand-shift analysis by end-use
- Customer behavior and sourcing strategy shifts
Why Do Fine Chemical Prices Vary by More Than 50x, and Which Producers Capture the Margin?
Asia Pacific fine chemical pricing is set by technical difficulty rather than volume. Commodity-like intermediates sell at roughly USD 3-15/kg, advanced intermediates at USD 20-150/kg, and electronic-grade and high-purity chemicals at USD 50-500/kg. GMP-grade pharmaceutical intermediates and APIs start around USD 100/kg and can exceed USD 1,000/kg, while specialty fluorochemicals and chiral building blocks reach USD 200-2,000/kg. Gross margins run 20-30% in commodity-like intermediates, 30-40% in advanced intermediates, and 35-50% in custom synthesis. EBITDA margins for leading custom-synthesis providers are typically 22-30%, against 10-15% for undifferentiated producers.
Our analysis indicates that this spread reflects what the customer is actually paying for: regulatory documentation, impurity profiles, supply security, and qualification history. These are costly and slow to build, and they are hard for new entrants to copy. We believe this explains why a 10–15-point EBITDA gap persists between specialists and undifferentiated producers. The pass-through picture supports this view. Raw materials are often passed on at 70- 90% under contract, but with a lag of 1- 3 months, so producers without scale or contract protection absorb the timing risk. Spot prices in China are typically 10-25% below equivalent-grade Indian or Japanese pricing, which suggests price competition is concentrated in standard grades and that origin carries a premium mainly where quality assurance and supply continuity matter.
In our view, the most significant implication is that margin growth will come from moving up the complexity curve rather than from cost-cutting in commodity grades. Producers that add regulated-grade capability, high-purity processing, or fluorination and chiral chemistry are better placed to hold pricing power. Buyers should expect tight pricing in qualified, specification-driven segments and continued discounting in generic intermediates. From our assessment, this creates an opportunity for mid-sized producers to defend margins through long-term contracts with clearer raw-material pass-through terms.
The full report quantifies price benchmarks by product class, purity grade,e and country, along with cost breakdowns across raw materials, conversion, and logistics. It also covers margin analysis by business model, pass-through mechanisms, price elasticity and the 2026-2035 pricing outlook. The same intelligence can also be provided as a structured pricing database tracking product class, chemistry, grade, country, contract versus spot basis, price range, and margin band by year. Users can filter and benchmark price points across segments and origins, which complements the strategic analysis with granular, comparable data.
Key Coverage
- Price benchmarks by product class, grade and country
- Raw-material, conversion and logistics cost breakdowns
- Margin analysis by business model
- Pass-through mechanisms and price elasticity
- 2026–2035 pricing outlook
Demand-Supply Analysis: Capacity is Abundant in Commodity Intermediates but Tight in High-Specification Chemistries
The market has enough capacity for standard chemical intermediates, especially in China and India, but supply is much tighter for specialized products such as fluorinated, high-potency, cryogenic, and ultra-high-purity chemicals. China operates at around 65–70% capacity utilization, while India is higher at 75–80%. New qualified capacity can take 24–36 months to become operational, and regulatory approvals may add further delays. Overall capacity is expected to grow by about 5% annually through 2030, with most new investments focused on pharmaceuticals, electronics, and specialty agrochemicals. Southeast Asia is becoming a supply-deficit region as its growing demand is not fully matched by local production.
Value Chain & Supply Chain – Margin Concentrates in Custom Development, Regulated Grades and Qualified Supply
The fine chemicals value chain starts with petrochemical and mineral feedstocks, which are converted into basic intermediates, then advanced intermediates and active ingredients. From there, the products move to formulators, OEMs, and end-users. Margin is not spread evenly along this path. Feedstock and basic intermediates take only about 10-15% of the total chain margin, while advanced synthesis and custom manufacturing capture an estimated 40-50%. The rest is shared between formulation and distribution.
This split makes sense when you look at what each stage does. Basic intermediates are made in large volumes by many producers, so prices are driven by supply and feedstock costs. Advanced synthesis is different. It involves multi-step chemistry, tight impurity control, and, in pharmaceuticals, regulatory documentation. Customers also spend 12-36 months qualifying a supplier, and they rarely switch once that is done. That is what keeps margins high at this stage.
The weak points sit upstream. A small number of suppliers control fluorspar, specialty solvents, and catalysts, so a disruption there can slow production even for well-run plants. Fluorinated chemistry is especially exposed, since fluorspar is its starting point. On the delivery side, logistics typically adds 3-7% to the final cost. Hazardous-goods handling rules and port constraints add delays and risk, particularly for exports.
For producers, the practical lesson is to move toward custom development and regulated grades, where most of the margin sits. Securing a second source for critical raw materials is just as important as expanding capacity.
Trade & Import-Export Analysis: Asia Pacific is a Net Exporter, but Dependency Varies Sharply by Chemistry
Asia Pacific exports an estimated USD 38–42 billion in fine chemicals annually and is a net exporter by a wide margin. China and India are the major exporters, primarily to North America, Europe, and other Asian markets. Japan, South Korea, and Singapore remain net importers of specific high-purity and specialty inputs. Roughly 60–70% of Indian fine chemical output is exported. Tariff exposure, anti-dumping measures, and proposed biosecurity-related restrictions are shifting trade corridors. Several Southeast Asian economies are pursuing import substitution in agro and personal-care intermediates.
Key Coverage
- Import and export value and volume by country
- Trade corridors and dependency by chemistry
- Tariff, duty and trade-policy impact
- Localization and import-substitution opportunities
Technology & Innovation – Continuous Flow, Biocatalysis, Fluorination and Ultra-High-Purity Processing Redefine Competitiveness
Continuous-flow chemistry is deployed in an estimated 15–20% of leading producers' product portfolios, and adoption is expected to double by 2035. Biocatalysis and enzymatic routes are expanding in chiral and peptide-related intermediates. Selective fluorination, photochemistry, and electrochemistry enable cleaner, higher-yield routes. Ultra-high-purity purification capability (ppb-level metal impurity control) is a key qualification barrier in electronics. R&D intensity is 2–4% of sales for typical producers and 5–8% for innovation-led specialists.
Key Coverage
- Technology maturity and adoption by chemistry
- Patent and R&D intensity analysis
- Commercial deployment case analysis
- Digital process control and analytics
Regulatory & Sustainability Analysis: Stricter Environmental Rules and Decarbonization Requirements Are Increasing Industry Costs
China's tightened environmental inspections and chemical park consolidation have removed substantial small-scale capacity since 2017. India's zero-liquid-discharge requirements and pollution norms are becoming stricter. Regulatory frameworks like REACH, TSCA, GMP and K-REACH shape export eligibility. Scope 1 and 2 emission targets from multinational customers are cascading into supplier audits, with an estimated 50–60% of major buyers now requiring supplier sustainability disclosures. Solvent recovery rates above 80–90% and green-chemistry route redesign are becoming competitive differentiators. Compliance investment can reach 5–10% of capex.
Key Coverage
- Country-by-country regulatory comparison
- Compliance cost modeling
- Decarbonization and circularity initiatives
- Green chemistry and bio-based alternatives
Customer & Application Analysis: Customer Behavior Defined by Qualification Cycles and Dual-Sourcing
Pharmaceutical customers require 12–36 months for supplier qualification, which creates strong switching costs. Agrochemical customers are more price-sensitive but increasingly demand long-term contracts for patented actives. Electronics customers prioritize purity, consistency, and local supply. The top 10 customers account for an estimated 40–60% of revenue at leading custom-synthesis providers. Highest-value applications include oncology intermediates, GLP-1-related peptide building blocks, semiconductor photoresist components, and next-generation agro actives. Unmet needs include flexible small-batch capacity, regulatory support, and secure multi-country supply.
Key Coverage
- Application share and CAGR
- Purchasing criteria and price sensitivity
- Customer concentration and switching costs
- High-value application analysis
Which Types of Players Hold the Strongest Competitive Position in Asia Pacific Fine Chemicals Market, and Where is Rivalry Most Intense?
The Asia Pacific fine chemicals market is highly fragmented. The top 5 players hold roughly 11-13% of regional revenue and the top 10 around 22-25%, with the remaining 75% spread across mid-sized and small producers. Within this structure, three tiers compete. Scale and integrated leaders, including Japanese diversified chemical groups and large Chinese producers, combine broad portfolios with backward integration. Contract development and manufacturing specialists in China and India pair process chemistry with regulatory capability. Chemistry-focused specialists concentrate in fluorination, nitration, halogenation, and high-purity materials. Contract development leaders and Indian custom-synthesis specialists have gained an estimated 1-3 percentage points of share collectively since 2020, while commodity-intermediate producers have lost share to consolidation and enforcement.
Our analysis indicates that competitive intensity depends far more on chemistry and regulatory complexity than on company size. Rivalry is highest in generic intermediates, where products are interchangeable, and buyers hold the pricing power. It is lowest in complex, regulated chemistries, where qualification cycles of 12- 36 months and tight capacity make switching costly for customers. This is consistent with the 10–15-point EBITDA gap between leading custom-synthesis providers (22-30%) and undifferentiated producers (10-15%). Our assessment is that scale alone no longer guarantees a defensible position. Integrated leaders benefit from breadth and feedstock security, but the contract development specialists and chemistry-focused players are the ones converting capability into share gains and premium margins.
In our view, the most significant implication is that the strategic response now matters as much as the starting position. Capacity expansion, capability acquisition, and long-term supply contracts are the dominant moves, and we expect them to accelerate consolidation among mid-sized producers that lack either scale or a specialized niche. From our assessment, this creates an opportunity for acquirers seeking high-purity, fluorination, or electronics capabilities, and for specialists that can secure multi-year contracts with global pharma, agro, and semiconductor customers. Producers stuck in generic intermediates face continued share loss and margin pressure.
Tentative Leading Company Universe
| Sr.no | Company | HQs | Market Position | Core Strength | Major Segments |
| 1 | Sumitomo Chemical | Japan | Global scale leader | Integrated agro and pharma intermediates | Agro, pharma |
| 2 | Mitsubishi Chemical Group | Japan | Scale leader | Advanced materials, electronic chemicals | Electronics, pharma |
| 3 | Tokyo Chemical Industry | Japan | Reagent specialist | Building-block breadth | R&D, pharma |
| 4 | Tosoh | Japan | Specialty leader | Organic and halogen chemistry | Electronics, specialty |
| 5 | Daicel | Japan | Specialist | Chiral and functional materials | Pharma, electronics |
| 6 | Shin-Etsu Chemical | Japan | Technology leader | High-purity materials | Semiconductor |
| 7 | Lotte Fine Chemical | South Korea | Regional leader | Cellulose and specialty chemicals | Pharma, electronics |
| 8 | WuXi STA (WuXi AppTec) | China | CDMO leader | Integrated development and manufacturing | Pharma |
| 9 | Asymchem | China | CDMO leader | Continuous-flow process capability | Pharma |
| 10 | Porton Pharma Solutions | China | CDMO challenger | Intermediates and APIs | Pharma |
| 11 | Zhejiang NHU | China | Growth leader | Vitamins and fine chemicals | Pharma, nutrition |
| 12 | Jiangsu Yangnong Chemical | China | Agro leader | Agro actives and intermediates | Agro |
| 13 | Wanhua Chemical | China | Scale leader | Integrated chemical platform | Specialty, electronics |
| 14 | Navin Fluorine | India | Fluorination specialist | Fluorochemical CDMO | Pharma, agro |
| 15 | SRF | India | Diversified specialist | Fluorospecialty and agro | Agro, specialty |
| 16 | Divi's Laboratories | India | API and CRAMS leader | Custom synthesis, scale | Pharma |
| 17 | Aarti Industries | India | Intermediates leader | Benzene-derivative chemistry | Pharma, agro |
| 18 | Anupam Rasayan | India | Custom synthesis leader | Multi-step agro and specialty | Agro, specialty |
| 19 | PI Industries | India | Agro specialist | Agro actives CSM | Agro |
| 20 | Deepak Nitrite | India | Intermediates specialist | Nitration and phenolics | Specialty, agro |
| 21 | Cohance Lifesciences | India | Emerging CDMO | Pharma intermediates | Pharma |
| 22 | Neuland Laboratories | India | API specialist | Complex APIs | Pharma |
| 23 | Jubilant Ingrevia | India | Diversified specialist | Life-science chemicals | Pharma, agro, nutrition |
| 24 | Piramal Pharma | India | CDMO challenger | Development and manufacturing | Pharma |
Competitive, Product Portfolio and Technology Benchmarking- Breadth Wins Scale, Depth Wins Margin
Leading producers in Asia Pacific fine chemicals have built their strengths in different areas. Japanese groups lead in portfolio breadth and technology platforms, particularly in electronics and advanced materials. Chinese contract development and manufacturing leaders stand out for integrated development-to-commercial capability and scale. Indian specialists lead in fluorination, agrochemical custom synthesis and cost-efficient multi-step chemistry.
The report benchmarks leading companies across revenue growth, margin, product breadth, technology, capacity, geography and sustainability. Each company is rated Leader, Strong, Moderate or Emerging on every factor, allowing clear comparison of players with very different business models.
Application and Geographic Benchmarking: Application Leaders Differ Sharply from Regional Leaders
Pharma intermediates are led by Chinese and Indian CDMOs. Agroactives are led by Japanese integrated groups, Chinese producers, and Indian custom manufacturers. Electronic chemicals are concentrated among Japanese and Korean players. Geographically, China hosts the greatest scale, India the fastest growth, and Japan the strongest technology depth. Application white spaces include semiconductor process chemicals outside Japan and South Korea, and Southeast Asian pharma intermediate localization.
Manufacturing, Customer, and Channel Benchmarking
Major leading producers operate 5–20 multi-purpose sites each. Indian specialists have announced capacity expansions typically ranging from 30% to 50% of existing base over 3–5 years. Vertical integration into key intermediates and fluorinated feedstocks is a common strategy to secure margin. Customers favor suppliers with application engineering, regulatory support, and multi-site redundancy, and long-term contracts of 5–10 years are increasingly normal.
Strategic Developments and M&A Landscape: Capacity Localization and Capability Acquisition Define the Last Few Years
Recent announcements concentrate on:
- Capacity expansion in India and China.
- Overseas capacity, including Singapore and Southeast Asia, to serve diversification demand.
- Multi-year supply agreements with global pharma and agro customers.
- Investments in peptides, fluorination and electronic chemicals.
M&A has been dominated by capability consolidation, such as the combination of Suven and Cohance in India. Future M&A themes include acquisition of high-purity and electronics capabilities, mid-sized custom synthesis consolidation, and cross-border technology acquisitions. Deal values, target revenues, and strategic rationale are analyzed in the full report.
Company Profiles and Strategic Positioning
The report profiles companies across overview, market position, financial profile (revenue, growth, EBITDA, R&D, capex), product portfolio, application exposure, geographic footprint, manufacturing, innovation, strategic developments, strengths, vulnerabilities, and growth opportunities. A concise strategic positioning assessment classifies companies as Market Leaders, Growth Leaders, Technology Leaders, Scale Leaders, Regional Leaders, Application Specialists, or Emerging Challengers.
Opportunity & White-Space Analysis: Highest-Value Opportunities Sit Where Capability is Scarce
The largest white spaces include:
- Semiconductor and high-purity chemicals, an estimated USD 8–10 billion incremental opportunity by 2035.
- Peptide, oligonucleotide,e and complex pharma intermediates.
- Southeast Asian import substitution.
- Flow-chemistry-enabled contract manufacturing.
Low-carbon and bio-based intermediate routes commanding a 5–15% price premium.
Industry Structure (Porter’s Five Forces), PESTLE Analysis, and Market Attractiveness
Porter's Five Forces
- Supplier power: Medium. It rises to high for fluorspar and specialty feedstocks, where only a few suppliers control the supply.
- Buyer power: High in generics, Medium in regulated pharma. Generic buyers can switch easily, while pharma customers are tied to suppliers through long qualification processes.
- Threat of new entrants: Medium. Entry is possible, but regulatory approvals, environmental compliance, and customer qualification slow new entrants down.
- Threat of substitutes: Low to Medium. Replacing a process (for instance, a cleaner or cheaper synthesis route) is a bigger risk than replacing the product itself.
- Competitive rivalry: High. The market is fragmented, and competition is high in generic intermediates.
PESTLE Analysis
- Political: Governments are encouraging supply-chain diversification, and trade friction is changing sourcing patterns.
- Economic: Pharma outsourcing continues to grow and gives regional producers steady demand.
- Technological: Semiconductor localization is raising demand for ultra-high-purity chemicals.
- Legal: Environmental laws are getting stricter, which raises compliance costs, especially for smaller plants.
- Environmental: Global customers are setting decarbonization targets and passing them on to their suppliers.
Future Outlook
Technology priorities include continuous flow, biocatalysis and ultra-high-purity processing. Margins are expected to widen by 1–2 percentage points for specialized producers and compress for undifferentiated ones. Future profit pools lie in peptides, electronic materials, fluorinated actives and low-carbon routes. Future winners are likely to be capacity-qualified CDMOs, integrated electronics-chemicals suppliers and Indian custom-synthesis specialists, while emerging challengers include Southeast Asian regional producers.
Key Strategic Questions
- Which countries and markets will contribute the most incremental revenue to the Asia Pacific fine chemicals market through 2035?
- Which fine chemical segments will generate the strongest growth and the largest incremental revenue opportunities through 2035?
- Where are the biggest capacity gaps and supply constraints by country, chemistry, and end-use, and how are they likely to evolve?
- Which product categories and chemistries offer the strongest pricing power and margin potential, and what factors support those premiums?
- How will pharmaceutical outsourcing, semiconductor expansion, and supply-chain diversification reshape regional demand and sourcing patterns?
- Which technologies will have the greatest impact on production costs, yields, quality, and competitive positioning through 2035?
- How will environmental regulations, decarbonization requirements, and compliance costs affect capacity, profitability, and industry consolidation?
- Which companies are best positioned to gain market share based on portfolio breadth, technology, capacity, geography, customer relationships, and financial strength?
- Which capability areas and market segments present the most attractive M&A, investment, and expansion opportunities across Asia Pacific?
- Where are the largest market white spaces through 2035, and which business models and capabilities are best positioned to capture them?
List of Segments
By End-Use
- Pharmaceuticals
- Agrochemicals
- Electronics and Semiconductor Materials
- Flavors, Fragrances and Personal Care
- Dyes, Pigments, Polymer Additives and Others
By Product Type
- Advanced Intermediates
- Active Ingredients
- Building Blocks and Reagents
- Others
By Business Model
- Custom Synthesis and Contract Manufacturing
- Catalog and Standard Products
By Chemistry
- Fluorinated Chemistry
- Heterocyclic Chemistry
- Chiral Chemistry
- High-Purity and Organometallic Chemistry
- Others
A Seven-Phase Framework
Our methodology is designed to be universally applicable across commodity chemicals, specialty chemicals, petrochemicals, construction chemicals, coatings, electronic chemicals, industrial gases, agrochemicals, water treatment chemicals, and performance materials. Each phase builds upon the last, creating a layered validation structure that minimizes estimation error and maximizes analytical confidence.
The framework ensures comprehensive market coverage, robust cross-validation, and reliable long-term forecasting — producing market estimates that withstand scrutiny from investors, regulators, and corporate strategy teams.

Seven-Phase Framework — Analytical Effort Distribution
Relative analytical effort allocated across each phase of the Chemicals & Materials research framework

Phase 1 - Secondary Research: Establishing the Foundation
Secondary research collects and evaluates publicly available information from authoritative sources, establishing the foundational understanding of market structure, value chain dynamics, competitive landscape, and end-use demand patterns. Every source is evaluated for credibility, recency, geographic relevance, and methodological soundness before inclusion.
Industry Associations
Sources include ACC, CEFIC, ICCA, JCIA, CPCIF, and SOCMA providing production volumes, consumption trends, capacity developments, and sustainability initiatives.
Company Disclosures
Annual reports, investor presentations, earnings transcripts, and regulatory filings reveal product portfolios, manufacturing footprints, capacity expansions, and revenue segmentation.
Government Databases
National statistical offices, customs authorities, environmental agencies, and industrial production databases provide verified statistics on output, trade flows, and regulatory compliance.
Trade Databases
UN Comtrade, ITC, Eurostat, and national customs authorities enable assessment of global product movement, import dependency, and export competitiveness across regions.
Our Secondary Research Sources
- Ministry of Chemicals and Fertilizers
- European Chemicals Agency
- United States Department of Energy
- Ministry of Industry and Information Technology
- Ministry of Economy Trade and Industry
- Ministry of Trade Industry and Energy
- National Institute of Standards and Technology
- Council of Scientific and Industrial Research
- Fraunhofer Society
- National Institute for Materials Science
Phase 2 — Supply-Side Assessment: Mapping Production Capabilities
Production Capacity Analysis
All major manufacturers are assessed for existing installed capacity, planned additions, expansions, new plant announcements, and technology adoption — mapped at global, regional, and country levels.
Capacity Utilization Adjustment
Installed capacity is adjusted using utilization rates based on demand conditions, feedstock availability, plant operating rates, maintenance schedules, and regulatory restrictions.
Manufacturer Revenue Analysis
Product-specific revenues, segment-level performance, regional distribution, average selling prices, and margin trends are evaluated to establish market value estimates.
Supply-Side Assessment — Capacity vs. Effective Production by Region
Illustrative comparison of installed capacity vs. effective production volume (after utilization rate adjustment) across major regions

Phase 3 — Demand-Side Assessment: Quantifying Chemical Consumption
Demand-side analysis quantifies chemical consumption across industries, applications, and geographies — identifying where and how chemicals are consumed throughout the value chain with precision.
End-Use Industry Analysis
Chemical demand is evaluated across automotive, construction, packaging, electronics, agriculture, healthcare, consumer goods, industrial manufacturing, energy and utilities, and water treatment. Industry output, production trends, and consumption intensity are analyzed to determine demand patterns.
Consumption Modeling
Demand is estimated using measurable indicators: kilograms per vehicle, kilograms per square meter of construction, dosage per cubic meter of water treated, kilograms per hectare of agricultural land, and kilograms per ton of manufactured products. Consumption factors are validated through industry publications and primary interviews.
Application Analysis
The market is segmented by application area to understand product performance requirements, formulation trends, technology adoption, customer preferences, and regulatory requirements improving demand accuracy and segmentation granularity.
Demand-Side Assessment — End-Use Industry Demand Distribution
Illustrative distribution of chemical & materials demand across key end-use industries

Phase 4 - Trade Flow Analysis: Balancing Regional Supply and Demand
Trade flow analysis reconciles regional supply and demand estimates through import and export data, identifying net supply positions, regional dependencies, and market imbalances. It serves as an independent validation layer that tests the consistency of supply-side and demand-side estimates.
Import Analysis
Import data is evaluated to determine volumes, source countries, product dependency, regional supply gaps, and pricing trends — identifying markets that rely heavily on external supply and where domestic production is insufficient to meet demand.
Export Analysis
Export assessments reveal production surplus, export competitiveness, regional manufacturing strength, and global market participation. Export patterns also help validate domestic production estimates and identify net exporting regions.
Apparent Consumption Model
Regional consumption is assessed using the standard apparent consumption formula:
Results identify net importing regions, net exporting regions, regional deficits, and surpluses — serving as an independent validation of supply and demand estimates.
Trade Flow Analysis — Net Supply Position by Region
Illustrative apparent consumption vs. domestic production across major regions — positive gap indicates net import dependency

Phase 5 — Primary Research: The Critical Validation Layer
Primary research tests and refines findings from secondary research through direct engagement with industry participants across the supply chain, demand side, and expert community. It captures intelligence that no database or published report can provide — the real-world experience of manufacturers, buyers, and specialists operating in the market.

Supply-Side Interviews
Conversations with chemical manufacturers, raw material suppliers, contract manufacturers, technology providers, and plant operators cover production trends, capacity utilization, pricing developments, technology shifts, and competitive dynamics.

Demand-Side Interviews
Engagement with OEMs, industrial consumers, procurement managers, distributors, formulators, and end-use manufacturers focuses on consumption trends, purchasing behavior, product substitution, demand outlook, and emerging applications.

Industry Expert Consultations
Additional interviews with industry consultants, independent experts, regulatory specialists, technical professionals, and research institutions provide deeper market context and validate key analytical assumptions.
Focus Areas of Primary Research:
Market Size & Forecast Validation
Revenue estimates, volume consumption, growth rates, forecast assumptions, regional demand.Supply Chain & Value Chain Assessment
Raw material sourcing, supply chain challenges, distribution networks, procurement practices.Production & Capacity Analysis
Manufacturing capacity, utilization rates, expansion projects, plant investments.Pricing & Cost Structure Analysis
Product pricing trends, feedstock costs, energy costs, margin pressures, pricing outlook.Competitive Landscape Assessment
Volume and value estimates confirmed to be fully consistent with one another before publicationInterview Volume by Market Scope
| Study Scope | Number of Interviews |
|---|---|
| Niche Market | 20 – 30 |
| Mid-Sized Market | 30 – 50 |
| Global Market | 50 – 80 |
| Highly Fragmented Market | 80 – 120 |
Interview Details:
Category : Manufacturers, Suppliers, Distributors, End Users, Experts/Associations
Average Duration : 30–60 Minutes
Interview Mode : Video calls, telephonic interviews, expert consultations
Interview Format : Structured / Semi-Structured questionnaire
Focus Areas of Primary Research:
Market Size & Forecast Validation :
Revenue estimates, volume consumption, growth rates, forecast assumptions, regional demand.
Supply Chain & Value Chain Assessment :
Raw material sourcing, supply chain challenges, distribution networks, procurement practices.
Production & Capacity Analysis :
Manufacturing capacity, utilization rates, expansion projects, plant investments.
Pricing & Cost Structure Analysis :
Product pricing trends, feedstock costs, energy costs, margin pressures, pricing outlook.
Competitive Landscape Assessment :
Market share, competitor positioning, strategic initiatives, partnerships, acquisitions.
Primary Research — Stakeholder Coverage by Category
Distribution of interview respondents across stakeholder categories (% share from PPT data)

Primary Research — Respondent Designation Profile
Seniority breakdown of interview respondents (% share from PPT data)

Primary Research — Geographic Coverage of Interviews
Regional distribution of primary research engagement (% share from PPT data)

Phase 6 — Data Triangulation and Market Validation
No single methodology is relied upon in isolation. Multiple independent estimation approaches are combined and reconciled to ensure consistency, accuracy, and analytical defensibility. Any material deviations between approaches are investigated and adjusted through additional validation cycles.
The final market size is derived through weighted triangulation of all validated methodologies. Any material deviations between approaches are investigated and adjusted through additional validation cycles. The outcome represents the most realistic assessment of the market based on available evidence and expert confirmation ensuring that volume and value estimates are fully consistent with one another.
Triangulation Framework — Input Contribution Weight
Relative weight each sizing input contributes to the final reconciled market estimate

Phase 7 — Forecast Modeling: Projecting Future Market Evolution
Forecasting evaluates the future trajectory of the market using a combination of quantitative indicators and qualitative assessments across economic, industry, and regulatory dimensions. Rather than simple extrapolation, each driver is independently modeled and integrated into a composite forecast.
Macroeconomic Indicators
GDP growth, industrial production, manufacturing output, construction activity, consumer spending, and capital investment form the quantitative foundation of long-term demand projections. These are applied at country, regional, and global levels.
Industry Growth Drivers
Urbanization, infrastructure development, industrialization, technological innovation, sustainability initiatives, and evolving product performance requirements are assessed at regional and industry levels — capturing both structural and cyclical demand drivers.
Capacity Expansion Analysis
Announced plant expansions, new manufacturing facilities, technology upgrades, and strategic investments are evaluated to determine future supply-demand dynamics and potential market tightness or oversupply situations.
Regulatory & Sustainability
Environmental regulations, chemical safety standards, emission reduction targets, circular economy initiatives, and sustainability requirements are incorporated as they often influence product adoption rates and market growth trajectories.
Scenario Forecast Range — Indexed Market Growth (Year 1–10)
Illustrative indexed growth trajectories across Base, Optimistic, and Pessimistic scenarios over a 10-year forecast horizon

Forecast Drivers — Relative Impact Score by Category
Impact score (0–100) of each driver type on chemicals & materials market forecast




Comments
Share your thoughts, ask a question, or provide feedback about this report.