
U.S Natural Gas Storage Market Size, Competitive Landscape Analysis Report 2035
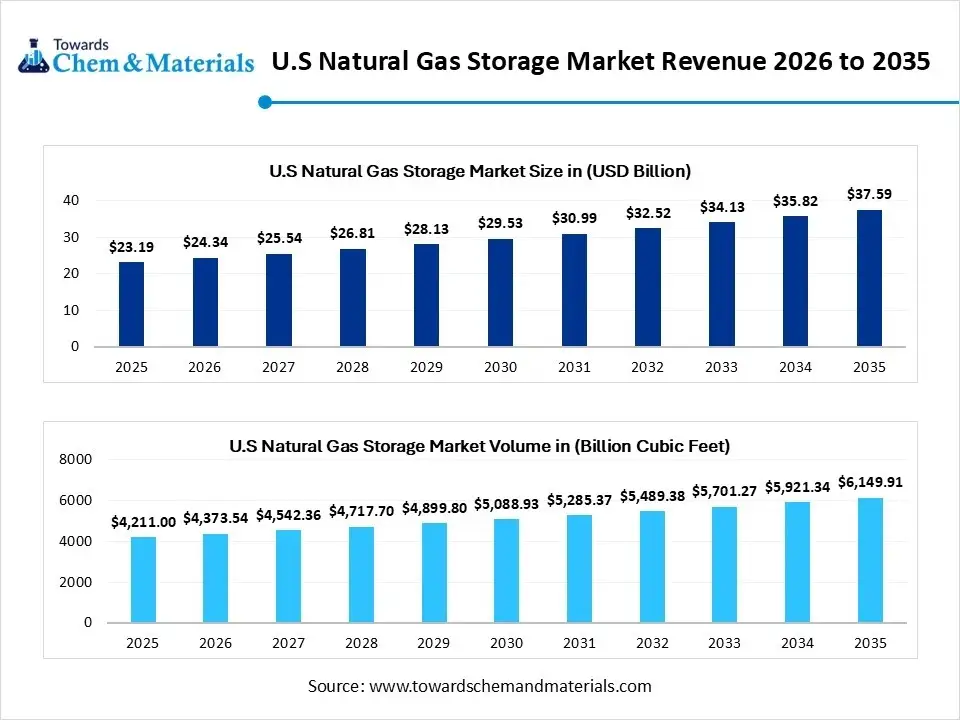
The U.S natural gas storage market size was estimated at USD 23.19 billion in 2025 and is expected to increase from USD 24.34 billion in 2026 to USD 37.59 billion by 2035, growing at a CAGR of 4.95% from 2026 to 2035. In terms of volume, the market is projected to grow from 4,211.00 billion cubic feet in 2025 to 6,149.91 billion cubic feet by 2035. growing at a CAGR of 3.86% from 2026 to 2035. The market is driven by methane emission surveillance, technological innovation and emphasis on operational resilience for storage.
Market Highlights
- By storage type, the underground storage segment held the largest 88% share in the market in 2025 due to ensuring large-scale seasonal supply integrity.
- By storage type, the above ground storage segment held the second largest share of 12% in 2025 and is expected to grow at the fastest growing in the market during the forecast period due to rapid deployment and expanding LNG resilience.
- By ownership type, the interstate storage segment held the largest 55% share in the market in 2025 due to its ability to enable cross-state gas transmission reliability.
- By ownership type, the intrastate storage segment held the second largest share of 30% in 2025 and is expected to grow at the fastest growing in the market during the forecast period due to rising demand that supports the domestic supply chain.
- By application, the power generation segment dominated the market with a 40% share in 2025, driven by its increasing gas-fired power capacity and electrical infrastructure.
- By application, the industrial segment held the second largest share of 25% in 2025 and is expected to grow at the fastest growing in the market during the forecast period due to its ability to maintain continuous manufacturing operations.
- By gas type, the dry gas segment dominated with a held 70% share in the market in 2025 due to its direct consumption and power utility.
- By gas type, the wet gas segment held the second largest share of 30% in 2025 and  is anticipated to grow at the fastest CAGR in the market during the forecast period due to demand for safety and rising NGL extraction.
- By function, the base load storage segment dominated with a held 60% share in the market in 2025 because it ensures continuous long-term supply reliability.
- By function, the peak shaving storage segment held the second largest share of 40% in 2025 and  is anticipated to grow at the fastest CAGR in the market during the forecast period due to its short-term demand spike efficiency.
Market Size and Volume Forecast
- Market Size (2025): USD 23.19 Billion | CAGR (2025–2035): 4.95%
- Market Projected Size (2035): USD 37.59 Billion
- Market Volume (2025): 4,211 Billion Cubic Feet (BCF) | Volume CAGR (2025–2035): 3.86%
- Market Projected Volume (2035): 6,149.91 Billion Cubic Feet (BCF)
- Market Pricing (2025):
- Average Manufacturing Price: USD 1,170/Metric Ton
- Average Selling Price: USD 1,480/Metric Ton
- Pricing CAGR (2025–2035): 4.85%
Market Overview
The U.S. natural gas storage market is a key part of the midstream infrastructure, acting as a massive underground energy battery that balances supply and demand using depleted reservoirs, salt caverns, and aquifers to meet upstream and downstream infrastructure. The U.S. creates a system that is essential for energy security, providing flexibility to reduce price volatility during extreme meteorological conditions and a baseload fuel supply, consistent power for electricity generation.
The market is a rapid-cycle asset for multiple injections and withdrawals, supporting renewable energy and the LNG export value chain. Additionally, the storage infrastructure increasingly uses AI data centres and has adopted digital twin modeling and advanced leak detection, satellite and drone surveillance, to ensure environmental compliance for sustainability.
Recent Market Trends
- Strategic Investments in Storage Infrastructure: The trend of large midstream players acquiring specialised storage operators with significant investment to produce wellhead-to-water integrated systems from production basins to end-users.
- Integration with LNG Export Waves: The revolutionary liquefaction trains come online, with storage facilities in the U.S. as surge tanks to absorb excess supply to provide regional export demand and avoid delays.
- The Stringent Regulatory Agenda: The low-carbon fuel standards and blending hydrogen mandate into existing natural gas storage reserves are pushing manufacturers towards the adoption of underground infrastructure, aligning with the transition to a hydrogen economy.
Report Scope
| Report Attribute | Details |
| Market Size in 2026 | USD 24.34 Billion / 4,373.54 Billion Cubic Feet |
| Revenue Forecast in 2035 | USD 37.59 Billion / 6,149.91 Billion Cubic Feet |
| Growth Rate | CAGR 4.95% |
| Forecast Period | 2026 - 2035 |
| Base Year | 2025 |
| Segment Covered | By Storage Type, By Ownership Type, By Application, By Gas Type, By Function |
| Key companies profiled | Williams Companies, Inc., Enbridge Inc., Kinder Morgan, Inc., Dominion Energy, Inc., Atmos Energy Corporation, ONEOK, Inc., Boardwalk Pipeline Partners, LP, Crestwood Equity Partners LP, DTE Energy Company and National Fuel Gas Company |
Key Technological Shifts and AI in the U.S. Natural Gas Storage Market
The United States is transforming from seasonal inventory to a digitally integrated energy ecosystem that involves real-time reservoir management with digital twin technology for advanced reservoirs, enhancing capacity and safety.
The rising stringent environmental regulations are driving the adoption of a multi-tiered methane monitoring system that uses sensors, satellite imaging, and drones for real-time emissions detection. The U.S. industry also services variable-speed natural gas compression and automated controls to maintain operational flexibility, balancing renewable loads and baseload power needs.
The recent innovations include subsurface hydrogen blending. Additionally, for the storage of natural gas, the region uses computational fluid dynamics to assess infrastructure compatibility, supported by AI analytics that optimize storage operations, making the storage network a resilient, intelligent energy catalyst for the global logistics supply chain.
U.S. Natural Gas Storage Market: Supply Chain Analysis
- Production and Supply: The stage of recovery of natural gas from underground and above ground reservoirs. The manufacturer's focus on maintaining a steady flow, which is then collected and treated before entering the storage network.
- Key Players: EQT Corporation, Antero Resources, Chesapeake Energy and Coterra Energy
- Transportation and Storage: In this stage, natural gas is processed and transported from high-pressure pipelines to underground facilities, such as depleted oil/gas reservoirs, salt caverns and aquifers. This stage manages the volatility in seasonal demand and supply.
- Key Players: Kinder Morgan, Enbridge, The Williams Companies, Energy Transfer and TC Energy
- Distribution and End-Use: The final stage, where gas is removed from storage and distributed to end-users. With the help of local utilities, serving homes, power plants, and liquefaction terminals for global export.
- Key Players: The Sempra Infrastructure, Southern Company, Cheniere Energy and Duke Energy
Regulatory Framework: U.S. Natural Gas Storage Market
| U.S.-based Region | Key Regulation | Regulatory Focus |
| Federal | FERC, Natural Gas Act, PHMSA, CFR, EPA and Clean Air Act | Focus on fairness and structural integrity, methane emissions for storage capacity and the U.S. to prevent leaks. |
| State level | State Utility Commissions, State-specific administrative codes and utility laws | Oversight for intrastate storage prices and safety of non-interstate field balancing local reliability in winter reserves. |
| Western (California) | CPUC and DOGGR(CalGEM) | Highly restrict the expansion of traditional storage and strict environmental rules that push operators towards renewable storage and enhanced safety technologies. |
| Midwest/East | Regional Transmission Organisation, State PUCs, State Implementation Plans for EPA compliance | Focus on consumer protection and seasonal reliability for preventing local gas shortage and price volatility. |
| Gulf Coast | State Underground Injection Control permits, Texas Railroad Commission, and Louisiana DNR | Specialized permitting for high-pressure salt caverns that focus on export readiness required for LNG terminals |
Segmental Insights
Storage Type Insights
The Underground Storage Segment Dominated The U.S. Natural Gas Storage Market With 88% Market Share In 2025.
Underground storage segment dominated the U.S. natural gas storage market with 88% share in 2025, driven by high-pressure subsurface energy batteries that support the midstream value chain. The segment used depleted oil and gas reservoirs and aquifers to ensure operational reliance. The segment is shifting towards technological advancement, where digital twin and real-time monitoring maintain well-being integrity. The segment is a key asset for global LPG export and a sustainable energy grid through advanced methane surveillance.
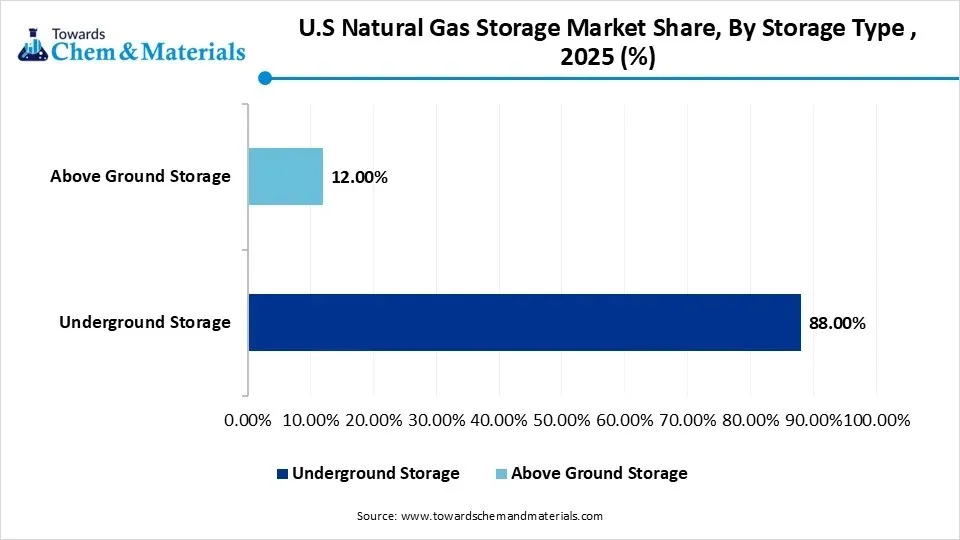
Above ground storage segment held the second largest share of 12% in 2025. It acts as a high-precision cryogenic buffer that uses LNG peak-having tanks and double containment vessels for immediate injectability. The segment offers instantaneous operational reliability and domestic energy supply during high downstream demand. The above ground storage represents integrated surge tanks that balance energy security for geopolitical and industrial hubs using automated regasification and advanced thermal technologies.
U.S Natural Gas Storage Market Share, By Storage Type , 2025 (%)
| By Storage Type | Revenue Share, 2025 (%) |
| Underground Storage | 88.00% |
| Above Ground Storage | 12.00% |
- In 2025, underground storage will dominate the U.S. natural gas storage market, accounting for 88.00% of the revenue share. It is favored for its large capacity, security, and ability to store gas for long periods, providing a reliable supply during peak demand.
- Above ground storage is expected to contribute 12.00% to the market share in 2025. This type of storage offers quicker access and flexibility for short-term needs, making it suitable for emergency situations and rapid response requirements.
Ownership Type Insights
Interstate Storage Segment Dominated The U.S. Natural Gas Storage Market With 55% Share In 2025
Interstate storage segment dominated the U.S. natural gas storage market with 55% share in 2025, driven by the federally regulated framework. The segment acts as a high-capacity subsurface energy integrated with the transmission grid. The stringent governmental regulation authorized by FERC for non-discriminatory access for operators for energy securing fueling the growth. The domestic shippers and distributors align with interstate storage stabilize power generation across state lines.
Intrastate storage segment held the second largest share of 30% in 2025. It represents a state-driven pillar derived from facilities that operate entirely within single state boundaries under state utility commissions promoted by domestic distribution companies and intrastate pipeline operators. The segment is act as a downstream infrastructure bridge that balances city-gate demand and maintains local price volatility aligned with the cost-of-service rate network to meet strict wellbore and emission compliance.
Independent storage operators segment held the third largest share of 15% in 2025, serving as specialized third-party storage services by offering operational flexibility for rapid-cycle injection and removals for trades and power generators to withstand price volatility. The rising midstream infrastructure segment delivers energy reliability and grid resilience that positions it as a market-driven merchant engine.
U.S Natural Gas Storage Market Share, By Ownership Type, 2025 (%)
| By Ownership Type | Revenue Share, 2025 (%) |
| Interstate Storage | 55.00% |
| Intrastate Storage | 30.00% |
| Independent Storage Operators | 15.00% |
- The U.S. Liquefied Natural Gas market in 2025 is expected to be dominated by long-term contracts, making up 55.00% of the revenue share. These contracts provide stability and predictability for both producers and buyers, ensuring consistent supply over extended periods.
- The spot market will contribute 25.00% to the total market share in 2025. It offers flexibility to buyers and sellers, enabling transactions at prevailing market prices for shorter durations.
- Short-term contracts are projected to account for 20.00% of the market share in 2025. This segment caters to those looking for more flexible terms, typically with a duration ranging from one to five years.
Application Insights
Power Generation Segment Dominated The U.S. Natural Gas Storage Market With 40% Share In 2025
Power generation segment dominated the U.S. natural gas storage market with 40% share in 2025, serving as grid-reliability solution for the nation's electrical infrastructure. The segment connects renewable energy and baseload power as a storage tool for operational reliability. Power generation prefers high-deliverability salt caverns for rapid-cycle injection by providing a stable fuel supply. Additionally, the rising utilization of natural gas enables AI-driven data center in power generation, boosting the market expansion.
Industrial segment held the second largest share of 25% in 2025 due to rising focus on operational efficiency in petrochemicals, steel and fertilizer manufacturing in the U.S. The industrial players are adopting storage infrastructure to bypass price volatility and maintain a stable feedstock value chain. The industry demands integrated surge tanks that fuel on-site cogeneration plants' expansion by maintaining regulatory compliance.
Residential segment held the third largest share of 20% in 2025. The growth is driven by seasonal demand and heating reliability shield for households. The segment utilized aquifers and depleted reservoirs to manage climatic conditions and transparency. The residential storage is regulated by local distribution companies that focus on a resilient utility supply chain using advanced demand forecasting and methane emission standards regarding human health.
Commercial segment held the fourth largest share of 15% in 2025, serving as a reliability catalyst for small-to-midscale networks, including hospitals, educational organizations, and retail facilities. The U.S. focuses on a steady supply of gas, where commercial storage acts as a shield from price volatility during weather-driven demand events. The local players in the commercial sector prioritised long-term cost stability and a reliable utility value chain that drives continuous growth.
U.S Natural Gas Storage Market Share, By Application, 2025 (%)
| By Application | Revenue Share, 2025 (%) |
| Residential | 20.00% |
| Commercial | 15.00% |
| Industrial | 25.00% |
| Power Generation | 40.00% |
- The power generation sector will lead the U.S. natural gas storage market, holding 40.00% of the revenue share.
- This sector is expected to continue its dominance due to high demand for energy generation.
- The industrial sector is projected to contribute 25.00% to the market share in 2025. Industrial facilities, particularly those relying on high energy consumption, are key drivers for this segment.
- Residential applications will make up 20.00% of the total market share in 2025. This growth is attributed to the increasing reliance on natural gas for heating and cooking purposes.
- The commercial sector will account for 15.00% of the market share in 2025. Commercial establishments, including offices and retail spaces, continue to use natural gas for various energy needs.
Gas Type Insights
Dry Gas Segment Dominated The U.S. Natural Gas Storage Market With 70% Share In 2025
Dry gas segment dominated the U.S. natural gas storage market with 70% share in 2025. The segment serves as a nation's pipeline-quality methane, where dry gas is preprocessed to remove liquid hydrocarbons and impurities. The segment is crucial for residential heating and industrial baseload as a strategic shock absorber that moderates price volatility and maintains nations' energy security. Additionally, the dry gas is integrating with technological advancement to optimized working gas capacity for the global LNG export value chain.
Wet gas segment held the second largest share of 30% in 2025 because it is a high-value feedstock for methane-containing natural gas liquids. The segment required specialized high-pressure storage infrastructure to maintain precision in various thermodynamic environments to prevent liquid dropout. The wet gas storage balances volatile petrochemical feedstock demand and enables supply flexibility for chemical manufacturing, integrated with advanced monitoring to optimize fractionation schedule.
U.S Natural Gas Storage Market Share, By Gas Type, 2025 (%)
| By Gas Type | Revenue Share, 2025 (%) |
| Dry Gas | 70.00% |
| Wet Gas | 30.00% |
- In 2025, dry gas will dominate the U.S. natural gas storage market, accounting for 70.00% of the revenue share. This segment is expected to maintain strong growth due to its widespread use in various industries, including power generation.
- Wet gas is expected to contribute 30.00% to the market share in 2025. The growth in this segment is driven by its increasing applications in processing and industrial sectors.
Function Insights
Base Load Storage Segment Dominated The U.S. Natural Gas Storage Market With 60% Share In 2025
Base load storage segment dominated the U.S. natural gas storage market with 60% share in 2025. It function as a volumetric pillar for U.S. seasonal demand cycle. The base load storage acts as a key shock absorber for national energy security by maintaining a continuous-state working gas inventory for industrial baseload needs. The segment is transforming towards digital twin modeling to optimize inventory management for the global energy supply chain.
Peak shaving storage segment held the second largest share of 40% in 2025, driven by its ability to provide high-intensity reliability and short-duration energy battery to avoid downstream demand spikes. The segment utilized above-ground LNG tanks and salt caverns to offer near-immediate injectivity during climate and grid fluctuations. It is crucial for midstream infrastructure to protect infrastructure from volumetric shortages and intraday price spikes. The peak shaving storage is implementing a regasification system and predictive monitoring to maintain emergency dispatch strategies.
U.S Natural Gas Storage Market Share, By Function, 2025 (%)
| By Function | Revenue Share, 2025 (%) |
| Base Load Storage | 60.00% |
| Peak Shaving Storage | 40.00% |
- In 2025, base load storage will account for 60.00% of the U.S. natural gas storage market share. This segment plays a crucial role in ensuring a stable energy supply throughout the year.
- Peak shaving storage is expected to contribute 40.00% to the market share in 2025. It helps meet the demand fluctuations during periods of high energy consumption, especially in colder months.
Recent Developments
- In March 2026, NextEra Energy, the largest energy construction in the U.S., received national approval to develop 10GW of natural gas power generation in Texas and Pennsylvania. This project approval is connected with Japan's $550 billion investment commitment with the U.S. from President Donald J. Trump to support surging data center demand.(Source: www.investor.nexteraenergy.com)
- In April 2025, NeuVentus LLC announced final approval from the Railroad Commission of Texas to advance 12 salt caverns for gas and liquid storage at its TRU hub project. The facility enables industrial users to store natural gas, hydrogen, and NGLs along the Gulf Coast.(Source: pgjonline.com)
U.S. Natural Gas Storage Market Competitive Landscape Analysis
Tier 1 Companies
|
Rank
|
Company Name | Headquarters | Country | Why Relevant to This Market | Key Products / Services |
| 1 | Kinder Morgan, Inc. | Houston, Texas | United States | One of the largest owners and operators of natural gas storage facilities and interstate pipelines in the U.S. | Underground natural gas storage, interstate pipelines, gas transportation |
| 2 | Energy Transfer LP | Dallas, Texas | United States | Major operator of natural gas storage assets integrated with extensive pipeline networks | Natural gas storage, pipeline transportation, storage hubs |
| 3 | Williams Companies, Inc. | Tulsa, Oklahoma | United States | Leading natural gas infrastructure company with significant storage and transmission assets | Underground gas storage, transmission pipelines, gathering systems |
| 4 | Enbridge Inc. | Calgary, Alberta | Canada | Operates major natural gas storage and transmission assets serving U.S. markets | Natural gas storage, interstate pipelines, gas transportation |
| 5 | DT Midstream, Inc. | Detroit, Michigan | United States | Operates strategically located natural gas storage fields and pipeline infrastructure | Underground storage, gas transmission, storage services |
Tier 2 Companies
|
Rank
|
Company Name | Headquarters | Country | Why Relevant to This Market | Key Products / Services |
| 1 | ONEOK, Inc. | Tulsa, Oklahoma | United States | Provides natural gas gathering, processing, transportation, and storage services | Gas storage, gathering, processing, pipeline services |
| 2 | Southern Star Central Gas Pipeline, Inc. | Owensboro, Kentucky | United States | Operates integrated natural gas pipeline and underground storage facilities | Underground storage, interstate pipeline services |
| 3 | Boardwalk Pipelines, LP | Houston, Texas | United States | Owns natural gas storage facilities connected to major interstate pipeline systems | Natural gas storage, transportation, pipeline infrastructure |
| 4 | National Fuel Gas Company | Williamsville, New York | United States | Operates underground storage and natural gas transmission assets in the Northeast | Natural gas storage, transmission, distribution |
Tier 3 Companies
|
Rank
|
Company Name | Headquarters | Country | Why Relevant to This Market | Key Products / Services |
| 1 | Spire Inc. | St. Louis, Missouri | United States | Operates underground natural gas storage assets through its midstream business | Gas storage, pipeline transportation |
| 2 | Northwest Natural Holding Company | Portland, Oregon | United States | Provides underground storage and natural gas utility services in the Pacific Northwest | Underground gas storage, gas distribution |
| 3 | UGI Corporation | King of Prussia, Pennsylvania | United States | Offers natural gas storage and distribution services across multiple U.S. markets | Natural gas storage, distribution, energy services |
| 4 | AltaGas Ltd. | Calgary, Alberta | Canada | Operates gas storage and midstream infrastructure with exposure to U.S. markets | Natural gas storage, processing, transportation |
Top Companies in the U.S. Natural Gas Storage Market and Their Offerings
- EQT Corporation: The largest producer offers a reliable volume of natural gas from the Appalachian Basin and provides a consistent supply for midstream companies, which then inject into storage.
- Kinder Morgan: The leading operator in the U.S. that offers an extensive network of underground storage fields. Their services allow trades to move gas between pipelines at a major storage intersection.
- ONEOK, Inc.: The key midstream provider that strengthened its storage infrastructure through an acquisition. Offers NGL, natural gas, storage, collection, and fractionation services.
- Duke Energy: The offer is Gas-to-Power Conversion utilizing stored gas as a flexible fuel source to balance the electrical grid.
- Williams Companies, Inc.
- Enbridge Inc.
- Dominion Energy, Inc.
- Atmos Energy Corporation
- ONEOK, Inc.
- Boardwalk Pipeline Partners, LP
- DTE Energy Company
- Crestwood Equity Partners LP
- National Fuel Gas Company
Segment Covered in the Report
By Storage Type
- Underground Storage
- Depleted Gas Reservoirs
- Aquifers
- Salt Caverns
- Above Ground Storage
- LNG Storage Tanks
- CNG Storage System
By Ownership Type
- Interstate Storage
- Intrastate Storage
- Independent Storage Operators
By Application
- Residential
- Commercial
- Industrial
- Power Generation
By Gas Type
- Dry Gas
- Wet Gas
By Function
- Base Load Storage
- Peak Shaving Storage
A Seven-Phase Framework
Our methodology is designed to be universally applicable across commodity chemicals, specialty chemicals, petrochemicals, construction chemicals, coatings, electronic chemicals, industrial gases, agrochemicals, water treatment chemicals, and performance materials. Each phase builds upon the last, creating a layered validation structure that minimizes estimation error and maximizes analytical confidence.
The framework ensures comprehensive market coverage, robust cross-validation, and reliable long-term forecasting — producing market estimates that withstand scrutiny from investors, regulators, and corporate strategy teams.

Seven-Phase Framework — Analytical Effort Distribution
Relative analytical effort allocated across each phase of the Chemicals & Materials research framework

Phase 1 - Secondary Research: Establishing the Foundation
Secondary research collects and evaluates publicly available information from authoritative sources, establishing the foundational understanding of market structure, value chain dynamics, competitive landscape, and end-use demand patterns. Every source is evaluated for credibility, recency, geographic relevance, and methodological soundness before inclusion.
Industry Associations
Sources include ACC, CEFIC, ICCA, JCIA, CPCIF, and SOCMA providing production volumes, consumption trends, capacity developments, and sustainability initiatives.
Company Disclosures
Annual reports, investor presentations, earnings transcripts, and regulatory filings reveal product portfolios, manufacturing footprints, capacity expansions, and revenue segmentation.
Government Databases
National statistical offices, customs authorities, environmental agencies, and industrial production databases provide verified statistics on output, trade flows, and regulatory compliance.
Trade Databases
UN Comtrade, ITC, Eurostat, and national customs authorities enable assessment of global product movement, import dependency, and export competitiveness across regions.
Our Secondary Research Sources
- Ministry of Chemicals and Fertilizers
- European Chemicals Agency
- United States Department of Energy
- Ministry of Industry and Information Technology
- Ministry of Economy Trade and Industry
- Ministry of Trade Industry and Energy
- National Institute of Standards and Technology
- Council of Scientific and Industrial Research
- Fraunhofer Society
- National Institute for Materials Science
Phase 2 — Supply-Side Assessment: Mapping Production Capabilities
Production Capacity Analysis
All major manufacturers are assessed for existing installed capacity, planned additions, expansions, new plant announcements, and technology adoption — mapped at global, regional, and country levels.
Capacity Utilization Adjustment
Installed capacity is adjusted using utilization rates based on demand conditions, feedstock availability, plant operating rates, maintenance schedules, and regulatory restrictions.
Manufacturer Revenue Analysis
Product-specific revenues, segment-level performance, regional distribution, average selling prices, and margin trends are evaluated to establish market value estimates.
Supply-Side Assessment — Capacity vs. Effective Production by Region
Illustrative comparison of installed capacity vs. effective production volume (after utilization rate adjustment) across major regions

Phase 3 — Demand-Side Assessment: Quantifying Chemical Consumption
Demand-side analysis quantifies chemical consumption across industries, applications, and geographies — identifying where and how chemicals are consumed throughout the value chain with precision.
End-Use Industry Analysis
Chemical demand is evaluated across automotive, construction, packaging, electronics, agriculture, healthcare, consumer goods, industrial manufacturing, energy and utilities, and water treatment. Industry output, production trends, and consumption intensity are analyzed to determine demand patterns.
Consumption Modeling
Demand is estimated using measurable indicators: kilograms per vehicle, kilograms per square meter of construction, dosage per cubic meter of water treated, kilograms per hectare of agricultural land, and kilograms per ton of manufactured products. Consumption factors are validated through industry publications and primary interviews.
Application Analysis
The market is segmented by application area to understand product performance requirements, formulation trends, technology adoption, customer preferences, and regulatory requirements improving demand accuracy and segmentation granularity.
Demand-Side Assessment — End-Use Industry Demand Distribution
Illustrative distribution of chemical & materials demand across key end-use industries

Phase 4 - Trade Flow Analysis: Balancing Regional Supply and Demand
Trade flow analysis reconciles regional supply and demand estimates through import and export data, identifying net supply positions, regional dependencies, and market imbalances. It serves as an independent validation layer that tests the consistency of supply-side and demand-side estimates.
Import Analysis
Import data is evaluated to determine volumes, source countries, product dependency, regional supply gaps, and pricing trends — identifying markets that rely heavily on external supply and where domestic production is insufficient to meet demand.
Export Analysis
Export assessments reveal production surplus, export competitiveness, regional manufacturing strength, and global market participation. Export patterns also help validate domestic production estimates and identify net exporting regions.
Apparent Consumption Model
Regional consumption is assessed using the standard apparent consumption formula:
Results identify net importing regions, net exporting regions, regional deficits, and surpluses — serving as an independent validation of supply and demand estimates.
Trade Flow Analysis — Net Supply Position by Region
Illustrative apparent consumption vs. domestic production across major regions — positive gap indicates net import dependency

Phase 5 — Primary Research: The Critical Validation Layer
Primary research tests and refines findings from secondary research through direct engagement with industry participants across the supply chain, demand side, and expert community. It captures intelligence that no database or published report can provide — the real-world experience of manufacturers, buyers, and specialists operating in the market.

Supply-Side Interviews
Conversations with chemical manufacturers, raw material suppliers, contract manufacturers, technology providers, and plant operators cover production trends, capacity utilization, pricing developments, technology shifts, and competitive dynamics.

Demand-Side Interviews
Engagement with OEMs, industrial consumers, procurement managers, distributors, formulators, and end-use manufacturers focuses on consumption trends, purchasing behavior, product substitution, demand outlook, and emerging applications.

Industry Expert Consultations
Additional interviews with industry consultants, independent experts, regulatory specialists, technical professionals, and research institutions provide deeper market context and validate key analytical assumptions.
Focus Areas of Primary Research:
Market Size & Forecast Validation
Revenue estimates, volume consumption, growth rates, forecast assumptions, regional demand.Supply Chain & Value Chain Assessment
Raw material sourcing, supply chain challenges, distribution networks, procurement practices.Production & Capacity Analysis
Manufacturing capacity, utilization rates, expansion projects, plant investments.Pricing & Cost Structure Analysis
Product pricing trends, feedstock costs, energy costs, margin pressures, pricing outlook.Competitive Landscape Assessment
Volume and value estimates confirmed to be fully consistent with one another before publicationInterview Volume by Market Scope
| Study Scope | Number of Interviews |
|---|---|
| Niche Market | 20 – 30 |
| Mid-Sized Market | 30 – 50 |
| Global Market | 50 – 80 |
| Highly Fragmented Market | 80 – 120 |
Interview Details:
Category : Manufacturers, Suppliers, Distributors, End Users, Experts/Associations
Average Duration : 30–60 Minutes
Interview Mode : Video calls, telephonic interviews, expert consultations
Interview Format : Structured / Semi-Structured questionnaire
Focus Areas of Primary Research:
Market Size & Forecast Validation :
Revenue estimates, volume consumption, growth rates, forecast assumptions, regional demand.
Supply Chain & Value Chain Assessment :
Raw material sourcing, supply chain challenges, distribution networks, procurement practices.
Production & Capacity Analysis :
Manufacturing capacity, utilization rates, expansion projects, plant investments.
Pricing & Cost Structure Analysis :
Product pricing trends, feedstock costs, energy costs, margin pressures, pricing outlook.
Competitive Landscape Assessment :
Market share, competitor positioning, strategic initiatives, partnerships, acquisitions.
Primary Research — Stakeholder Coverage by Category
Distribution of interview respondents across stakeholder categories (% share from PPT data)

Primary Research — Respondent Designation Profile
Seniority breakdown of interview respondents (% share from PPT data)

Primary Research — Geographic Coverage of Interviews
Regional distribution of primary research engagement (% share from PPT data)

Phase 6 — Data Triangulation and Market Validation
No single methodology is relied upon in isolation. Multiple independent estimation approaches are combined and reconciled to ensure consistency, accuracy, and analytical defensibility. Any material deviations between approaches are investigated and adjusted through additional validation cycles.
The final market size is derived through weighted triangulation of all validated methodologies. Any material deviations between approaches are investigated and adjusted through additional validation cycles. The outcome represents the most realistic assessment of the market based on available evidence and expert confirmation ensuring that volume and value estimates are fully consistent with one another.
Triangulation Framework — Input Contribution Weight
Relative weight each sizing input contributes to the final reconciled market estimate

Phase 7 — Forecast Modeling: Projecting Future Market Evolution
Forecasting evaluates the future trajectory of the market using a combination of quantitative indicators and qualitative assessments across economic, industry, and regulatory dimensions. Rather than simple extrapolation, each driver is independently modeled and integrated into a composite forecast.
Macroeconomic Indicators
GDP growth, industrial production, manufacturing output, construction activity, consumer spending, and capital investment form the quantitative foundation of long-term demand projections. These are applied at country, regional, and global levels.
Industry Growth Drivers
Urbanization, infrastructure development, industrialization, technological innovation, sustainability initiatives, and evolving product performance requirements are assessed at regional and industry levels — capturing both structural and cyclical demand drivers.
Capacity Expansion Analysis
Announced plant expansions, new manufacturing facilities, technology upgrades, and strategic investments are evaluated to determine future supply-demand dynamics and potential market tightness or oversupply situations.
Regulatory & Sustainability
Environmental regulations, chemical safety standards, emission reduction targets, circular economy initiatives, and sustainability requirements are incorporated as they often influence product adoption rates and market growth trajectories.
Scenario Forecast Range — Indexed Market Growth (Year 1–10)
Illustrative indexed growth trajectories across Base, Optimistic, and Pessimistic scenarios over a 10-year forecast horizon

Forecast Drivers — Relative Impact Score by Category
Impact score (0–100) of each driver type on chemicals & materials market forecast




Comments
Share your thoughts, ask a question, or provide feedback about this report.