
Rare Earth Magnets Market Size Analysis Report 2035
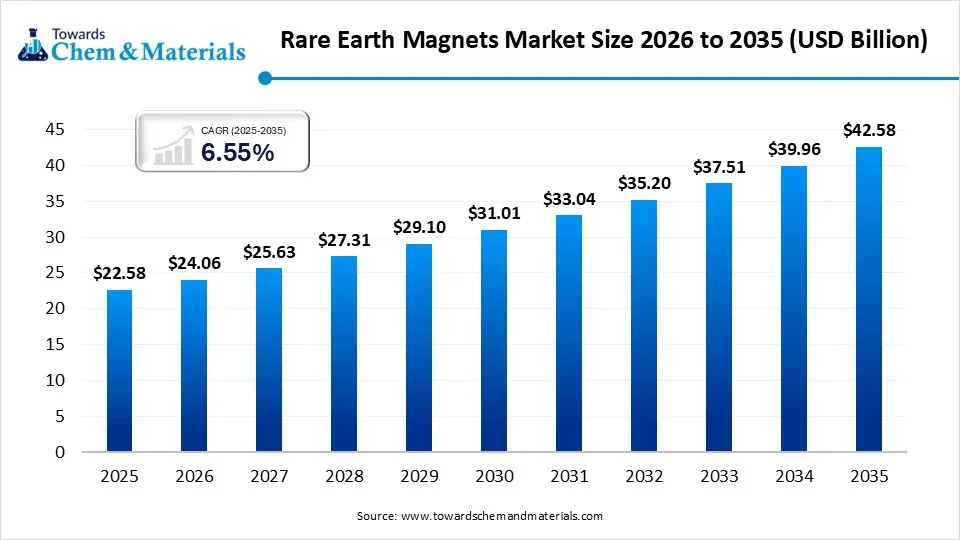
The global rare earth magnets market size was estimated at USD 22.58 billion in 2025 and is expected to increase from USD 24.06 billion in 2026 to USD 42.58 billion by 2035, growing at a CAGR of 6.55% from 2026 to 2035. Asia Pacific dominated the rare earth magnets market with the largest volume share of 46.00% in 2025. The increased growth of smaller and smarter electronics has fueled the industry's growth in recent years. The strong permanent magnets made from special rare earth elements is known as the rare earth magnets. Also, by having greater durability and create powerful magnetic force in a smaller size than the regular iron magnets, the rare earth magnetic has gained major industry attention in applications such as headphones, wind turbines, electric vehicles, and medical machines in the current period, as per the latest report.
Market Highlights
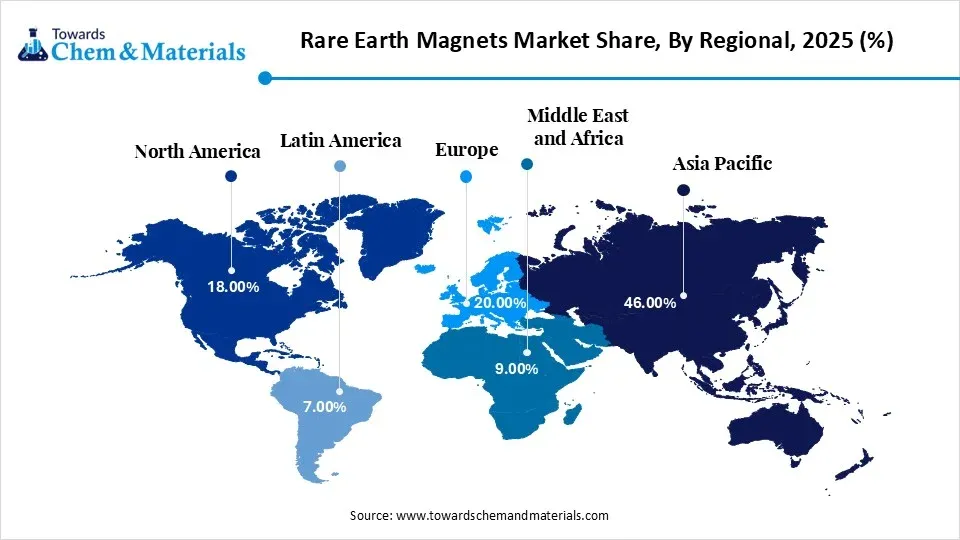
- The Asia Pacific dominated rare earth magnets market with the largest revenue share of 46.00% in 2025,due to its strong manufacturing capacity and large demand.
- By type, the NdFeb segment dominated the market and accounted for the largest revenue share of 66.00% in 2025, owing to its advantages, such as offering greater magnetic power at a relatively affordable cost.
- By manufacturing process, the sintered manufacturers segment led the market with the largest revenue share of 70.00% in 2025, owing to providing the highest magnetic strength and density.
- By end-use industry, the automotive segment dominated the market and accounted for the largest revenue share of 39.00% in 2025, owing to vehicles' use of multiple electric motors and sensors.
Smarter Magnets, Lower Supply Risk
The major manufacturers are turning towards improving heat resistance while reducing dependence on heavy rare-earth elements. Also, traditional high-performance magnets require materials like dysprosium for heat stability. However, these materials are expensive and limited. Manufacturers are now developing advanced magnet structures that perform well at high temperatures without heavy rare-earth additions. This reduces cost and supply risk.
Trade Analysis of the Rare Earth Magnets Market:
Import, Export, Consumption, and Production Statistics
- The world has observed the greater export of the rare earth magnets through the 594 buyers and 463 exporters with the 14,933 shipments between Jun 2024 and May 2025 as per the published report.
- Vietnam has emerged as a heavy exporter of rare earth magnets with 24,033 shipments, while China (13,146 shipments) and South Korea (1,454 shipments) are following as per the latest observation.
- Also, Vietnam itself has seen under the sophisticated import of rare earth magnets with 27,201 shipments, while the Philippines (3,725 shipments) and Japan have recorded 3,711 shipments as per the reports.
Recent Market Trends:
- The heavy growth of electric vehicles has positioned the industry for the long term expansion. The major manufacturers are actively using these magnets in EV motors to convert electricity into motion, where rare-earth magnets have emerged as the ideal material.
- The establishment and expansion of renewable energy, specifically wind power, has allowed stakeholders to capitalize on growth opportunities in recent years. Also, rare earth magnets have been seen reducing maintenance needs while improving turbine performance.
- The trend towards smaller and smarter devices is likely to emerge as a catalyst for unlocking the sector's full potential during the forecast period. Moreover, by allowing the manufacturers to develop smaller speakers and motors without losing power, the rare earth material is expected to drive strategic industry transformation.
Report Scope
| Report Attribute | Details |
| Market Size in 2026 | USD 24.06 Billion |
| Revenue Forecast in 2035 | USD 42.58 Billion |
| Growth Rate | CAGR 6.55% |
| Forecast Period | 2026 - 2035 |
| Base Year | 2025 |
| Dominant Region | Asia Pacific |
| Segment Covered | By Type, By Manufacturing Process, By End-Use Industry, By Region |
| Key companies profiled | China Northern Rare Earth Group, JL MAG Rare-Earth Co., Ltd., Beijing Zhong Ke San Huan Hi-Tech, Ningbo Yunsheng Co., Ltd., China Rare Earth Resources and Technology, Shenghe Resources Holding Co., Earth-Panda Advance Magnetic Material, Zhejiang Sheensen Magnetics Technology |
Supply Chain Analysis of the Rare Earth Magnets Market:
Distribution to Industrial Users
- Rare earth magnets are distributed to industrial users primarily via direct supply contracts for high-volume sectors like automotive (EV motors) and wind energy.
- Smaller manufacturers source through specialized distributors or Tier-1 component suppliers. Distribution channels increasingly prioritize regional hubs in North America and Europe to mitigate geopolitical risks and supply chain volatility.
Chemical Synthesis and Processing
- Production begins with the chemical extraction of rare earth oxides, which are converted into metals via molten salt electrolysis.
- These metals are alloyed, jet-milled into fine powder, and aligned in a magnetic field. Finally, the material undergoes liquid-phase sintering and heat treatment to achieve maximum density and magnetic strength.
Regulatory Compliance and Safety Monitoring
- Manufacturers must comply with ISO 9001 and ISO 14001 for quality and environmental management. Safety monitoring focuses on REACH and RoHS standards to restrict hazardous substances.
- Additionally, the EU Critical Raw Materials Act and U.S. SEC rules mandate rigorous supply chain auditing to ensure ethical sourcing and radiation safety during processing.
Rare Earth Magnets Market Regulatory Landscape: Global Regulations
| Country Region | Regulatory Body | Key Regulations | Focus Areas |
| United States | Department of Commerce | Section 232 of the Trade Expansion Act of 1962 (specifically Proclamation 11001 issued January 14, 2026). | Onshoring the entire "mine-to-magnet" value chain to reduce dependence on adversarial states. Current actions include a 180-day negotiation period with trading partners to adjust imports, with the threat of future tariffs if domestic supply goals are not met. |
| European Union | ECHA | Critical Raw Materials Act (CRMA) and the REsourceEU Package (early 2026). | Mandating that at least 25% of strategic raw materials come from recycled sources by 2030. New 2026 rules specifically restrict the export of rare earth magnet waste and scrap to keep valuable materials within the EU for local circular processing. |
| China |
Ministry of Industry and Information Technology (MIIT) |
Regulations on the Management of Rare Earths (Effective October 1, 2024) and MOFCOM Announcements No. 61 & 62 (2025). |
Establishing that all rare earth resources belong to the state and strictly controlling the total volume of mining and smelting. Recent "extraterritorial" provisions require government approval for the export of magnets made anywhere in the world if they use Chinese technology. |
Segmental Insights
Product Insights
How did the NdFeB Segment Dominate the Rare Earth Magnets Market in 2025?
The NdFeB segment dominated the market share 66.00% in 2025, due to its advantages, such as offering greater magnetic power at a relatively affordable cost. Moreover, by providing a higher energy density, the NdFeB has been seen to be used in wind turbines, electric vehicles, and electronics, as per the latest survey. Also, the NdFeb has observed delivering better prices and balanced performance in recent years.
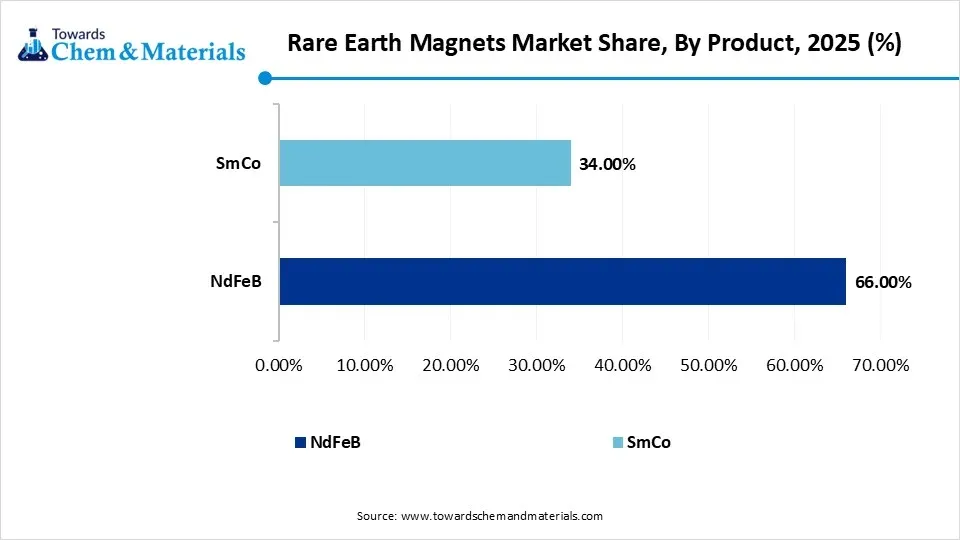
The SmCo segment is expected to grow with a rapid CAGR, owing to they perform better in extreme environments. They offer greater corrosion stability and temperature resistance. Industries such as aerospace, defense, and advanced industrial systems require magnets that work reliably under high heat and pressure. Although SmCo magnets are more expensive than NdFeB, their durability makes them valuable for critical applications.
Rare Earth Magnets Market Share, By Product, 2025 (%)
| By Product | Revenue Share, 2025 (%) |
| NdFeB | 66.00% |
| SmCo | 34.00% |
Manufacturing Process Insights
How did the Sintered Manufacturers Segment Dominate the Rare Earth Magnets Market in 2025?
The sintered manufacturing segment dominated the market share 70.00% in 2025, due to they provide the highest magnetic strength and density. The sintering process aligns magnetic particles strongly, producing powerful magnets suitable for heavy-duty applications. Automotive motors and wind turbines widely use sintered magnets because of their superior performance.
The bonded segment is expected to grow, owing to they are lightweight and flexible in design. They can be molded into complex shapes easily, making them ideal for compact motors and electronic devices. Production cost is lower and faster compared to sintered magnets. As industries focus on miniaturization and customized designs, bonded magnets become more attractive.
Rare Earth Magnets Market Share, By Manufacturing Process, 2025 (%)
| By Manufacturing Process | Revenue Share, 2025 (%) |
| Sintered | 70.00% |
| Bonded | 30.00% |
End Use Industry Insights
How did the Automotive Segment Dominate the Rare Earth Magnets Market in 2025?
The automotive segment dominated the market share 39.00% in 2025, due to vehicles' use of multiple electric motors and sensors. Power steering, braking systems, infotainment systems, and EV propulsion motors all require rare earth magnets. With global vehicle production increasing, demand for magnets continues to grow. Electric vehicles especially depend heavily on high-performance permanent magnets. Automakers focus on improving efficiency and reducing weight, which increases magnet usage.
The industrial segment is expected to grow with a rapid CAGR, owing to automation and robotics growth. Factories are adopting advanced machines and smart manufacturing systems. These systems require efficient electric motors powered by rare-earth magnets. Industrial robots operate continuously and need reliable magnetic components. Energy efficiency regulations also push industries to use high- performance motors.
Rare Earth Magnets Market Share, By End-Use Industry, 2025 (%)
| By End-Use Industry | Revenue Share, 2025 (%) |
| Automotive | 39.00% |
| Consumer Electronics | 18.00% |
| Energy | 15.00% |
| Industrial | 12.00% |
| Aerospace and Defense | 10.00% |
| Other End Use Industries | 6.00% |
Regional Insights
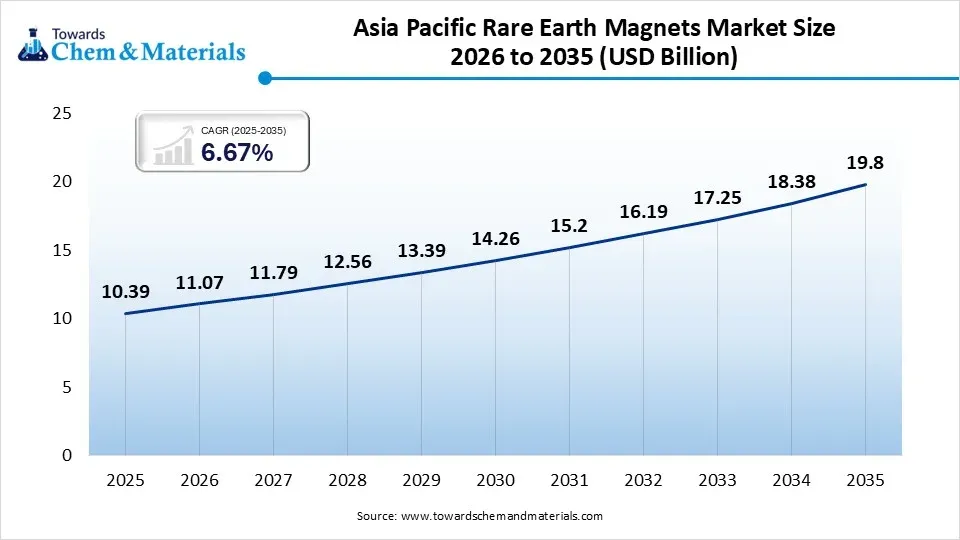
The Asia Pacific rare earth magnets market size was valued at USD 10.39 billion in 2025 and is expected to be worth around USD 19.80 billion by 2035, exhibiting at a compound annual growth rate (CAGR) of 6.67% over the forecast period from 2026 to 2035. Asia Pacific dominated the rare earth magnets market in 2025, due to its strong manufacturing capacity and large demand. The region produces most of the world's electronics and electric vehicles. It also processes a major portion of rare earth materials. Lower labor costs and established supply chains support growth. Rapid industrialization increases demand for magnets in the automotive and renewable energy sectors. Government policies also support domestic production.
China’s Strategic Rare Earth Advantage
China maintained its dominance in the market, owing to its large, rare earth reserves and advanced processing facilities. It controls a major share of global rare earth mining and magnet production. Chinese manufacturers supply magnets to automotive, electronics, and renewable industries worldwide. Government policies focus on strengthening the domestic value chains and managing exports. China also invests heavily in electric vehicles and wind energy, increasing local demand.
Rare Earth Magnets Market Evaluation in North America
The North America rare earth magnets market segment accounted for the major revenue share of 18.00% in 2025. North America is expected to capture a major share of the rare earth magnets market with a rapid CAGR, owing to supply chain diversification and strategic independence. Governments are investing in domestic rare earth mining and magnet manufacturing. Demand from EV production and renewable energy projects is increasing. The region focuses on secure and sustainable supply chains. Research and innovation capabilities are strong, supporting advanced magnet technologies.
Domestic Production Fuels Market Growth in the United States
The United States is expected to emerge as a prominent country for the rare earth magnets market in the coming years, due to its investment in rare earth resource development and local magnet production. It aims to reduce reliance on imports and strengthen supply security. Growth in EV manufacturing and wind energy installations increases magnet demand. The defense and aerospace industries also require high-performance magnets. Government funding supports domestic processing facilities and a research program.
Europe Rare Earth Magnets Market Examination
Europe rare earth magnets market segment accounted for the major revenue share of 20.00% in 2025. Europe is notably growing in industry, owing to strong climate policies and electric vehicle expansion. The region promotes renewable energy and green technologies. Automotive electrification is accelerating across European countries. Sustainability goals are pushing demand for wind turbines and efficient motors. Europe is also focusing on building local supply chains to reduce dependency.
Rare Earth Magnets Market Share, By Regional, 2025 (%)
| Regional | Revenue Share, 2025 (%) |
| North America | 18.00% |
| Europe | 20.00% |
| Asia Pacific | 46.00% |
| Latin America | 7.00% |
| Middle East & Africa | 9.00% |
Germany Drives Future Magnet Demand
Germany is expected to gain a significant market share due to the rising automotive and industrial base. The country leads in electric vehicle manufacturing and engineering innovation. German companies invest heavily in automation and renewable energy systems. Wind energy projects and industrial robotics increase magnet demand. Strict environmental regulations also push the adoption of efficient technologies. Germany focuses on high- quality and advanced engineering solutions.
Recent Developments
- In January 2026, The Kangwon Energy Co., Ltd, Noveon Magnetics, and LG Electronics Co., Ltd have entered in partnership with a strategic agreement of advanced closed-loop recycling of rare-earth permanent magnets. Also, the companies are likely to use Magnet to Magnet technology from Noveon’s as per the published report.(Source: www.prnewswire.com)
- In July 2025, The Rocklink GMBH and BatX Energies established a strategic partnership via signing an MOU to develop India’s first recycling and refining ecosystem for rare earth magnets. Also, this agreement is part of the EU-India trade as per the report released by companies. (Source: www.saurenergy.com)
Top Vendors in the Rare Earth Magnets Market & Their Offerings:
- China Northern Rare Earth Group: Founded in 1961 and based in Baotou, this state-owned giant is the world's largest, rare earth producer. It leverages the massive Bayan Obo deposit to dominate the upstream supply chain, providing rare earth oxides, metals, and magnetic materials.
- JL MAG Rare-Earth Co., Ltd.: A global leader in high-performance NdFeB magnets, JL MAG is dual-listed in Shenzhen and Hong Kong. The company is a critical supplier for the EV, wind power, and robotics sectors, serving major clients like Tesla and BYD.
- Beijing Zhong Ke San Huan Hi-Tech: This company specializes in the R&D and manufacturing of high-end sintered and bonded NdFeB magnets. Its products are essential for computer hard drives, consumer electronics, and automotive motors.
- Ningbo Yunsheng Co., Ltd.: Established in 1994, Ningbo Yunsheng is a leading manufacturer of rare earth permanent magnets and magnetic assemblies. It focuses on high-precision products like servo motor rotors and radiation rings for the industrial and medical sectors.
- China Rare Earth Resources and Technology
- Shenghe Resources Holding Co.
- Earth-Panda Advance Magnetic Material
- Zhejiang Sheensen Magnetics Technology
Segments Covered in the Report
By Type
- NdFeB
- SmCo
By Manufacturing Process
- Sintered
- Bonded
By End-Use Industry
- Automotive
- Consumer Electronics
- Energy
- Industrial
- Aerospace and Defense
- Other End Use Industries
By Region
- North America
- U.S.
- Canada
- Mexico
- Europe
- Germany
- UK
- France
- Italy
- Spain
- Asia Pacific
- China
- India
- Japan
- South Korea
- Latin America
- Brazil
- Argentina
- Middle East & Africa
- Saudi Arabia
- South Africa
A Seven-Phase Framework
Our methodology is designed to be universally applicable across commodity chemicals, specialty chemicals, petrochemicals, construction chemicals, coatings, electronic chemicals, industrial gases, agrochemicals, water treatment chemicals, and performance materials. Each phase builds upon the last, creating a layered validation structure that minimizes estimation error and maximizes analytical confidence.
The framework ensures comprehensive market coverage, robust cross-validation, and reliable long-term forecasting — producing market estimates that withstand scrutiny from investors, regulators, and corporate strategy teams.

Seven-Phase Framework — Analytical Effort Distribution
Relative analytical effort allocated across each phase of the Chemicals & Materials research framework

Phase 1 - Secondary Research: Establishing the Foundation
Secondary research collects and evaluates publicly available information from authoritative sources, establishing the foundational understanding of market structure, value chain dynamics, competitive landscape, and end-use demand patterns. Every source is evaluated for credibility, recency, geographic relevance, and methodological soundness before inclusion.
Industry Associations
Sources include ACC, CEFIC, ICCA, JCIA, CPCIF, and SOCMA providing production volumes, consumption trends, capacity developments, and sustainability initiatives.
Company Disclosures
Annual reports, investor presentations, earnings transcripts, and regulatory filings reveal product portfolios, manufacturing footprints, capacity expansions, and revenue segmentation.
Government Databases
National statistical offices, customs authorities, environmental agencies, and industrial production databases provide verified statistics on output, trade flows, and regulatory compliance.
Trade Databases
UN Comtrade, ITC, Eurostat, and national customs authorities enable assessment of global product movement, import dependency, and export competitiveness across regions.
Our Secondary Research Sources
- Ministry of Chemicals and Fertilizers
- European Chemicals Agency
- United States Department of Energy
- Ministry of Industry and Information Technology
- Ministry of Economy Trade and Industry
- Ministry of Trade Industry and Energy
- National Institute of Standards and Technology
- Council of Scientific and Industrial Research
- Fraunhofer Society
- National Institute for Materials Science
Phase 2 — Supply-Side Assessment: Mapping Production Capabilities
Production Capacity Analysis
All major manufacturers are assessed for existing installed capacity, planned additions, expansions, new plant announcements, and technology adoption — mapped at global, regional, and country levels.
Capacity Utilization Adjustment
Installed capacity is adjusted using utilization rates based on demand conditions, feedstock availability, plant operating rates, maintenance schedules, and regulatory restrictions.
Manufacturer Revenue Analysis
Product-specific revenues, segment-level performance, regional distribution, average selling prices, and margin trends are evaluated to establish market value estimates.
Supply-Side Assessment — Capacity vs. Effective Production by Region
Illustrative comparison of installed capacity vs. effective production volume (after utilization rate adjustment) across major regions

Phase 3 — Demand-Side Assessment: Quantifying Chemical Consumption
Demand-side analysis quantifies chemical consumption across industries, applications, and geographies — identifying where and how chemicals are consumed throughout the value chain with precision.
End-Use Industry Analysis
Chemical demand is evaluated across automotive, construction, packaging, electronics, agriculture, healthcare, consumer goods, industrial manufacturing, energy and utilities, and water treatment. Industry output, production trends, and consumption intensity are analyzed to determine demand patterns.
Consumption Modeling
Demand is estimated using measurable indicators: kilograms per vehicle, kilograms per square meter of construction, dosage per cubic meter of water treated, kilograms per hectare of agricultural land, and kilograms per ton of manufactured products. Consumption factors are validated through industry publications and primary interviews.
Application Analysis
The market is segmented by application area to understand product performance requirements, formulation trends, technology adoption, customer preferences, and regulatory requirements improving demand accuracy and segmentation granularity.
Demand-Side Assessment — End-Use Industry Demand Distribution
Illustrative distribution of chemical & materials demand across key end-use industries

Phase 4 - Trade Flow Analysis: Balancing Regional Supply and Demand
Trade flow analysis reconciles regional supply and demand estimates through import and export data, identifying net supply positions, regional dependencies, and market imbalances. It serves as an independent validation layer that tests the consistency of supply-side and demand-side estimates.
Import Analysis
Import data is evaluated to determine volumes, source countries, product dependency, regional supply gaps, and pricing trends — identifying markets that rely heavily on external supply and where domestic production is insufficient to meet demand.
Export Analysis
Export assessments reveal production surplus, export competitiveness, regional manufacturing strength, and global market participation. Export patterns also help validate domestic production estimates and identify net exporting regions.
Apparent Consumption Model
Regional consumption is assessed using the standard apparent consumption formula:
Results identify net importing regions, net exporting regions, regional deficits, and surpluses — serving as an independent validation of supply and demand estimates.
Trade Flow Analysis — Net Supply Position by Region
Illustrative apparent consumption vs. domestic production across major regions — positive gap indicates net import dependency

Phase 5 — Primary Research: The Critical Validation Layer
Primary research tests and refines findings from secondary research through direct engagement with industry participants across the supply chain, demand side, and expert community. It captures intelligence that no database or published report can provide — the real-world experience of manufacturers, buyers, and specialists operating in the market.

Supply-Side Interviews
Conversations with chemical manufacturers, raw material suppliers, contract manufacturers, technology providers, and plant operators cover production trends, capacity utilization, pricing developments, technology shifts, and competitive dynamics.

Demand-Side Interviews
Engagement with OEMs, industrial consumers, procurement managers, distributors, formulators, and end-use manufacturers focuses on consumption trends, purchasing behavior, product substitution, demand outlook, and emerging applications.

Industry Expert Consultations
Additional interviews with industry consultants, independent experts, regulatory specialists, technical professionals, and research institutions provide deeper market context and validate key analytical assumptions.
Focus Areas of Primary Research:
Market Size & Forecast Validation
Revenue estimates, volume consumption, growth rates, forecast assumptions, regional demand.Supply Chain & Value Chain Assessment
Raw material sourcing, supply chain challenges, distribution networks, procurement practices.Production & Capacity Analysis
Manufacturing capacity, utilization rates, expansion projects, plant investments.Pricing & Cost Structure Analysis
Product pricing trends, feedstock costs, energy costs, margin pressures, pricing outlook.Competitive Landscape Assessment
Volume and value estimates confirmed to be fully consistent with one another before publicationInterview Volume by Market Scope
| Study Scope | Number of Interviews |
|---|---|
| Niche Market | 20 – 30 |
| Mid-Sized Market | 30 – 50 |
| Global Market | 50 – 80 |
| Highly Fragmented Market | 80 – 120 |
Interview Details:
Category : Manufacturers, Suppliers, Distributors, End Users, Experts/Associations
Average Duration : 30–60 Minutes
Interview Mode : Video calls, telephonic interviews, expert consultations
Interview Format : Structured / Semi-Structured questionnaire
Focus Areas of Primary Research:
Market Size & Forecast Validation :
Revenue estimates, volume consumption, growth rates, forecast assumptions, regional demand.
Supply Chain & Value Chain Assessment :
Raw material sourcing, supply chain challenges, distribution networks, procurement practices.
Production & Capacity Analysis :
Manufacturing capacity, utilization rates, expansion projects, plant investments.
Pricing & Cost Structure Analysis :
Product pricing trends, feedstock costs, energy costs, margin pressures, pricing outlook.
Competitive Landscape Assessment :
Market share, competitor positioning, strategic initiatives, partnerships, acquisitions.
Primary Research — Stakeholder Coverage by Category
Distribution of interview respondents across stakeholder categories (% share from PPT data)

Primary Research — Respondent Designation Profile
Seniority breakdown of interview respondents (% share from PPT data)

Primary Research — Geographic Coverage of Interviews
Regional distribution of primary research engagement (% share from PPT data)

Phase 6 — Data Triangulation and Market Validation
No single methodology is relied upon in isolation. Multiple independent estimation approaches are combined and reconciled to ensure consistency, accuracy, and analytical defensibility. Any material deviations between approaches are investigated and adjusted through additional validation cycles.
The final market size is derived through weighted triangulation of all validated methodologies. Any material deviations between approaches are investigated and adjusted through additional validation cycles. The outcome represents the most realistic assessment of the market based on available evidence and expert confirmation ensuring that volume and value estimates are fully consistent with one another.
Triangulation Framework — Input Contribution Weight
Relative weight each sizing input contributes to the final reconciled market estimate

Phase 7 — Forecast Modeling: Projecting Future Market Evolution
Forecasting evaluates the future trajectory of the market using a combination of quantitative indicators and qualitative assessments across economic, industry, and regulatory dimensions. Rather than simple extrapolation, each driver is independently modeled and integrated into a composite forecast.
Macroeconomic Indicators
GDP growth, industrial production, manufacturing output, construction activity, consumer spending, and capital investment form the quantitative foundation of long-term demand projections. These are applied at country, regional, and global levels.
Industry Growth Drivers
Urbanization, infrastructure development, industrialization, technological innovation, sustainability initiatives, and evolving product performance requirements are assessed at regional and industry levels — capturing both structural and cyclical demand drivers.
Capacity Expansion Analysis
Announced plant expansions, new manufacturing facilities, technology upgrades, and strategic investments are evaluated to determine future supply-demand dynamics and potential market tightness or oversupply situations.
Regulatory & Sustainability
Environmental regulations, chemical safety standards, emission reduction targets, circular economy initiatives, and sustainability requirements are incorporated as they often influence product adoption rates and market growth trajectories.
Scenario Forecast Range — Indexed Market Growth (Year 1–10)
Illustrative indexed growth trajectories across Base, Optimistic, and Pessimistic scenarios over a 10-year forecast horizon

Forecast Drivers — Relative Impact Score by Category
Impact score (0–100) of each driver type on chemicals & materials market forecast




Comments
Share your thoughts, ask a question, or provide feedback about this report.