
Marble Market Size Analysis Report 2035
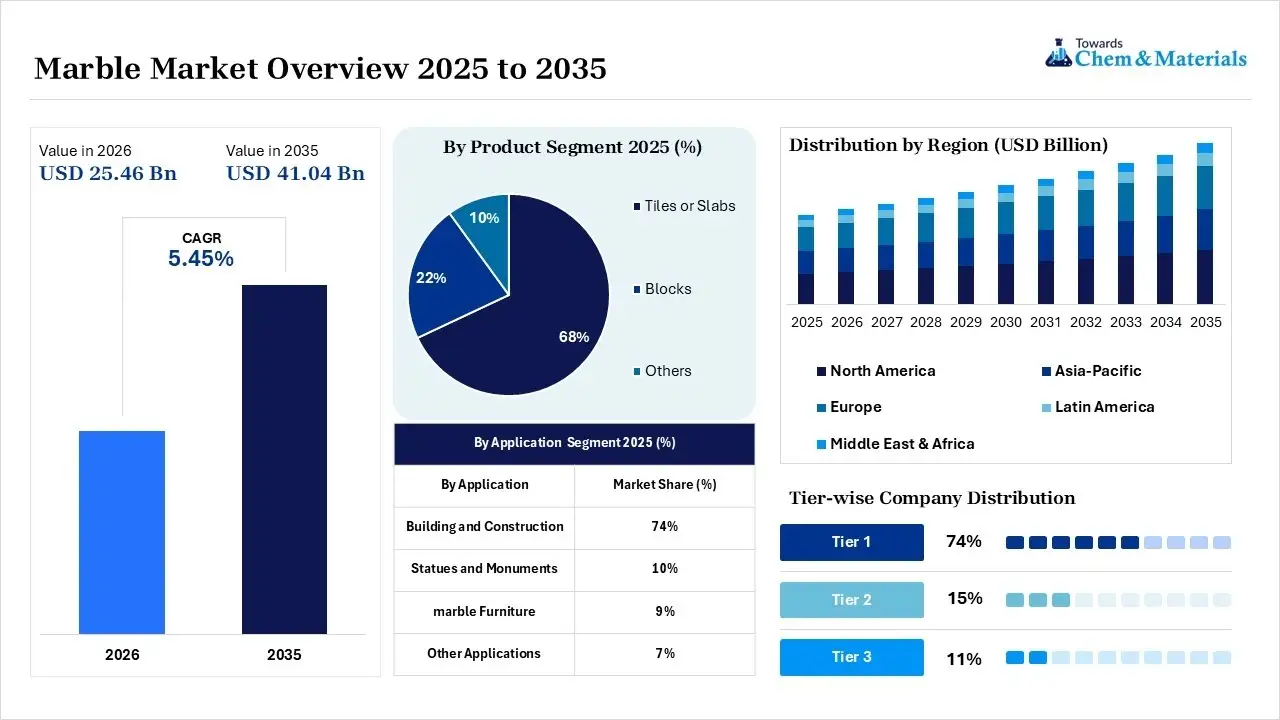
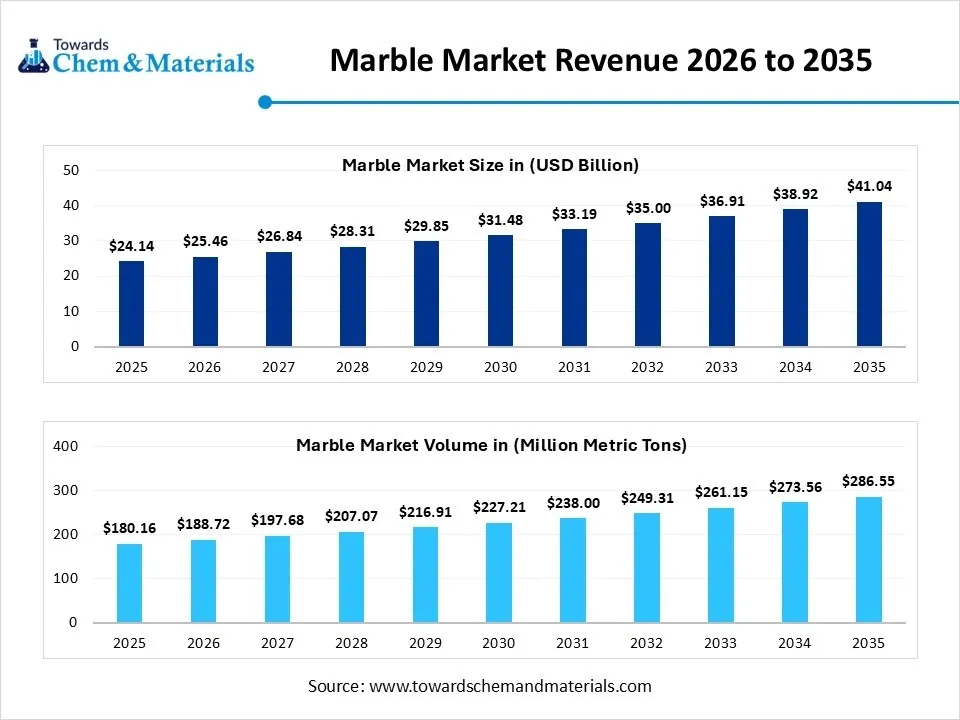
The global marble market size was valued at USD 24.14 billion in 2025, is estimated to reach USD 25.46 billion in 2026, and is projected to reach USD 41.04 billion by 2035, exhibiting a compound annual growth rate (CAGR) of 5.45% over the forecast period from 2026 to 2035.Asia Pacific dominated the marble market with the largest revenue share of 41.0% in 2025 and is expected to grow at the fastest CAGR of 5.57% during the forecast period. Growing consumer disposable income is the key factor driving market growth. Also, ongoing expansion of commercial infrastructure coupled with the rapid urbanisation across the globe can fuel market growth further.
Key Takeaways
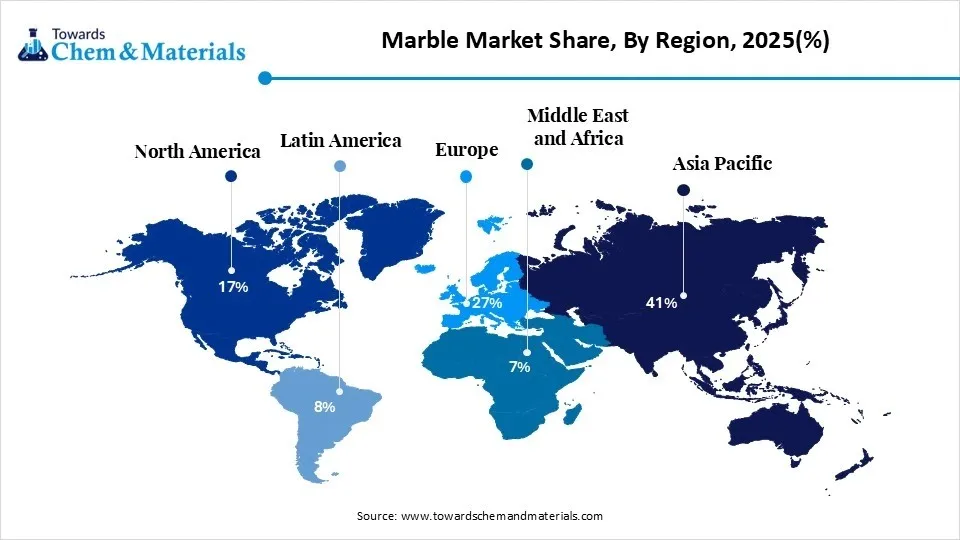
- By region, Asia Pacific dominated the market with the largest share of 41.0% in 2025. The dominance of the region can be attributed to the surge in investments in government infrastructure projects, ongoing urbanisation and an expanding luxury real estate and hospitality sector.
- By region, North America held the market share of 17.00% in 2025 and is expected to grow at the fastest CAGR of 6.2% over the forecast period. The growth of the region can be credited to the robust cultural preference for sustainable, premium natural stone in architecture.
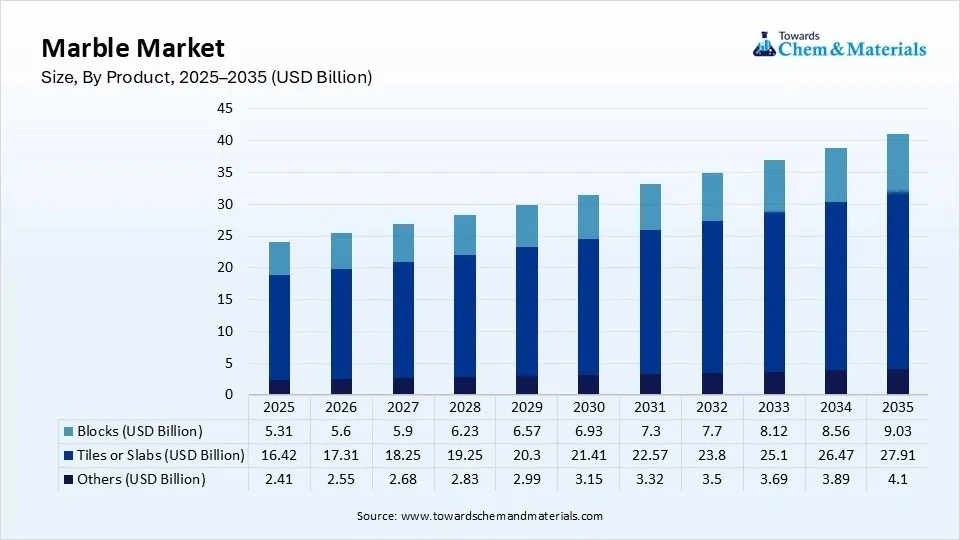
- By product, the tiles or slabs segment dominated the market with the largest share of 68.0% in 2025 and is expected to grow at the fastest CAGR of 5.8% over the forecast period. The growth of the segment is due to growing demand from the residential and commercial sectors.
- By application, the building and construction segment dominated the market with the largest share of 74.0% in 2025. The dominance can be attributed to growing demand for premium building materials.
- By application, the marble furniture segment held a market share of 9.00% in 2025 and is expected to grow at the fastest CAGR of 5.7% over the forecast period. The growth of the segment is owing to the growing trend of premium interiors.
According to Towards Chemicals and Materials Analytics and Consulting, the global marble market volume was valued at 180.16 million metric tons in 2025 and is expected to surpass around 286.55 million metric tons by 2035, accelerating a compound annual growth rate (CAGR) of 4.75% over the forecast period from 2026 to 2035.
Increasing Disposable Incomes
A rise in disposable incomes in emerging economies is presenting lucrative opportunities in the market soon. As there is an ongoing inclination towards renovations and luxury home improvements. This trend suggests that consumers are focusing on quality and luxury in their living spaces.
In December 2025, Shree Cement introduced its premium Portland-slag cement (PSC), "Bangur Marble Cement", to the Odisha market, broadening its footprint across Eastern India. Available statewide through retail networks, this offering is designed for high-durability projects that require superior strength, crack resistance, and an immaculate finish.(Source: www.cemnet.com)
The market also benefits from the increasing trend of luxury living spaces, where marble is the favoured choice for countertops, flooring and facades.
What Are the Key Trends Influencing the Marble Market?
- The increasing focus on sustainability in the construction sector is substantially impacting material choices and also emerging as a more preferred choice. More architects and builders are emphasizing sustainable practices, and natural materials like marble are gaining traction because of their durability and eco-friendly nature.
- The products higher shelf life is also a key trend impacting market growth positively. Structures and buildings built from marble tend to need less maintenance and have higher longevity as compared to those built with less durable materials. This factor lessens the need for frequent replacements and also decreases overall waste.
- There is also a growing demand for durable and aesthetic construction materials that substantially boost market expansion, especially in the real estate and infrastructure sector. Marble, known for its strength and beauty, fulfills this need, which makes it a popular choice in high-end commercial and residential developments.
Report Scope
| Report Attributes | Details |
| Market Size in 2025 | USD 73.76 Billion |
| Market Size by 2034 | USD 111.52 Billion |
| Growth Rate from 2025 to 2034 | CAGR 4.70% |
| Base Year of Estimation | 2024 |
| Forecast Period | 2025 - 2034 |
| High Impact Region | North Ameica |
| Segment Covered | By Product, By Application, By Region |
| Key Companies Profiled | Antolini Luigi & C SpA, BC Marble Products Ltd, Levantina y Asociados de Minerales, S.A., Fox Marble, Kangli stone group, Best Cheer Stone, Kingstone Mining Holdings Ltd., China Kingstone Mining Holdings Ltd., Daltile, HELLENIC GRANITE Co., Topalidis SA, Santucci Group Srl |
Supply Chain Analysis of the Marble Market
Production & Processing
- It includes the extraction of raw metamorphic stone and its subsequent transformation into commercial products, such as slabs, tiles, and countertops. This complex value chain effectively fills heavy mining operations with advanced manufacturing technologies.
- Antolini Luigi & C SpA: Based in Italy, Antolini is renowned globally for its luxury natural stones, unique finishing techniques, and premium global distribution network.
- Other Key Players: Classic Marble Company, Temmer Marble
Quality Testing and Certification
- It involves the systematic evaluation of natural and synthetic stone materials to verify their physical durability, classify their aesthetic properties, and ensure strict adherence to established construction and architectural specifications.
- Levantina y Asociados de Minerales, S.A. (Spain): Controls the world’s largest Crema Marfil marble reserves. They are highly integrated across quarrying, testing, and distribution.
- Other Key Players: Best Cheer Stone Group, Polycor Inc.
Distribution to Industrial Users
- It involves the logistics of sourcing raw, crushed, and block marble directly from quarries and processors for large-scale industrial buyers. It also assesses the dominant market leaders shaping the international trade of this material. It emphasises heavily massive volume contracts and raw material sourcing.
- Temmer Marble: Operates one of the worlds largest integrated marble processing plants. Direct exporter to over 45 countries for high-volume urban landscaping.
- Other Key Players: Xishi Group, Daltile
How is the Government Supporting the Marble Market?
The Indian government supports the market through policies such as imposing strict import duties to safeguard domestic producers and optimizing infrastructure development through strategic initiatives such as the "Smart Cities Mission" and "Housing for All" to offer infrastructure financing through the PM Gati Shakti Master Plan. The government of India has also raised import duties on travertine and marble blocks, increasing them up to four times from 10% to 40% to safeguard local manufacturers.
The US government promotes the market through a combination of construction initiatives, trade policies, and technological advancements. Government initiatives supporting eco-friendly building practices like green building certifications, also impact positively the demand for marble and other stones. Import duties on marble are less, ranging from 0% to 5%.
Market Opportunity
Surge in Luxury Real Estate Projects
Expanding infrastructure and luxury real estate are projected to create significant opportunities in the market. Marble is constantly being utilized as a design element in major architectural projects like government buildings, museums, and cultural centers. Furthermore, countries like India, China, and the UAE have substantially invested in large-scale projects that require high-quality marble, boosting marble market growth soon.
- In February 2025, European developer Mr. Eight Development unveiled its first building project in the UAE called Villa del DIVOS on the Dubai Islands. This is the first-ever development on the island. The development is the first project of MR Eight; each residence is created with interior finishes and features marble and stone surfaces.(Source: meconstructionnews )
Market Challenge
Fluctuating Costs and Resource Challenges
Marble is a natural resource typically found in limited locations in a specific region, and the availability and quality of these deposits can fluctuate. The energy-requiring processes need digging, transportation, and processing which can lead to fluctuating manufacturing costs. However, economic and political instability in major marble-manufacturing regions can disrupt the whole supply chain operations, hindering market growth further.
Segmental Insights
Product Insights
The tiles or slabs segment dominated the market in 2025. The dominance of the segment can be attributed to the cost-effective and durable nature of tiles and slabs as compared to other materials. Tiles are more affordable than slabs, which makes them a budget-friendly option. Additionally, marble can be utilized in different applications such as bathrooms, kitchens, flooring, and accent walls. Marble kitchen slabs are convenient for both commercial and residential kitchens.
- In June 2025, Walnut Building Solutions unveiled Zeoclean, the latest collection of stone & tile cleaners specially created by top experts in India. Through years of R&D, the company has designed different products depending on nearly 25 years of experience in chemical, construction, and materials.(Source: ahmedabadmirror)
The blocks segment is expected to grow at the fastest CAGR over the forecast period. The growth of the segment can be credited to the rising use of blocks in construction and in the carving & arts industries. Blocks allow for efficient quarrying, precise customization, and simpler logistics, which makes them a popular choice for commercial and residential projects. Moreover, marbles long lifespan and renewable nature contribute to its adoption in sustainable construction.
Marble Market Share, By Product, 2025(%)
| By Product | Market Share (%) |
| Tiles or Slabs | 68% |
| Blocks | 22% |
| Others | 10% |
Application Insights
The building and construction segment held the largest market share in 2025. The dominance of the segment can be linked to the aesthetic appeal, durability, and versatility of marble as a building material. Also, marble is commonly used in construction for wall cladding, facades, flooring, and ornamental features. The growing trend of luxury living along with the preference for natural materials in construction further propels the segments expansion.
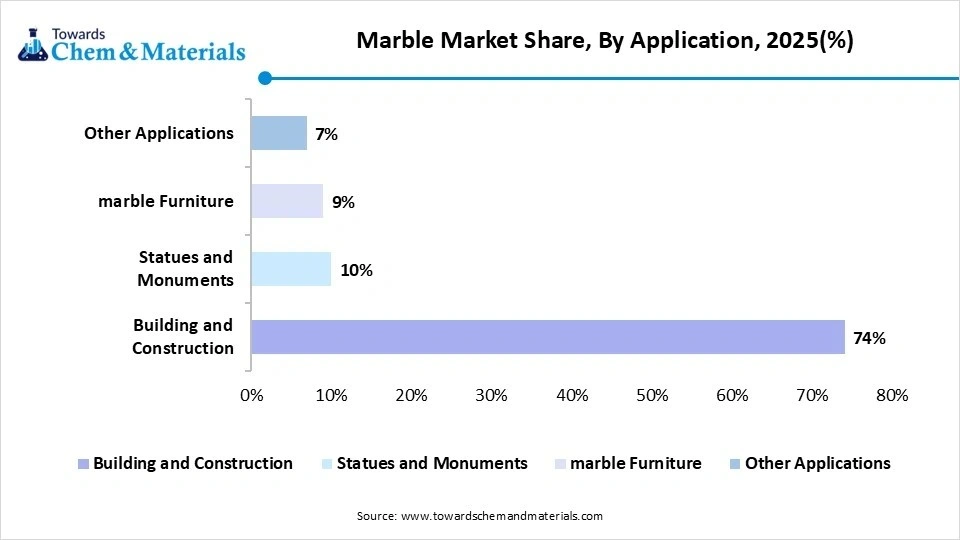
The marble furniture segment is expected to grow at the fastest CAGR during the projected period. The growth of the segment can be driven by the durability, aesthetic appeal, and versatility of marble furniture in different applications like countertops, tabletops, and decorative pieces for commercial and residential spaces. Furthermore, the availability of marble in numerous patterns and colors allows for customization specific to various design preferences.
Marble Market Share, By Application, 2025(%)
| By Application | Market Share (%) |
| Building and Construction | 74% |
| Statues and Monuments | 10% |
| marble Furniture | 9% |
| Other Applications | 7% |
Regional Insights
How Did Asia Pacific dominate the Marble Market in 2025?
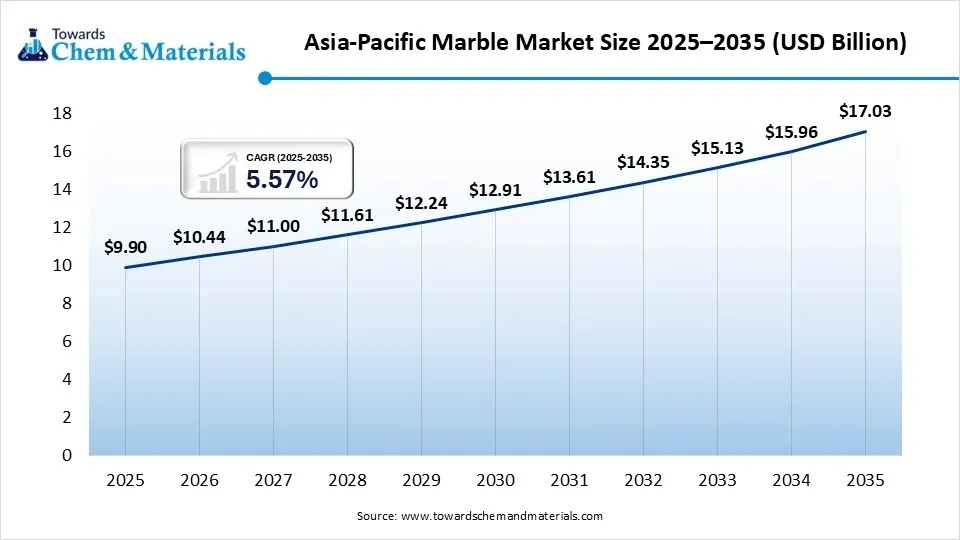
The Asia Pacific marble market size was estimated at USD 9.90 billion in 2025 and is projected to reach USD 17.03 billion by 2035, growing at a CAGR of 41% from 2026 to 2035.Asia Pacific dominated the market with the largest share of 41.0% in 2025. The dominance of the region can be attributed to the surge in investments in government infrastructure projects, ongoing urbanisation and an expanding luxury real estate and hospitality sector across emerging regions. In addition, the region benefits from abundant natural stone deposits combined with highly competitive local labour and processing expenses, which collectively facilitate robust production volumes and international export levels.
China
Government policies supporting urban development have optimised the significant investments in airports, shopping malls, high-rise offices, and public facilities.Increasing disposable incomes have shifted preferences towards luxury home décor, with marble increasingly utilised as a status symbol in high-end residential and hospitality projects.
India
The increasing luxury tourism and hospitality sectors heavily use marble to create opulent interiors in hotels, resorts, and corporate offices.India is a major global player, processing and exporting massive volumes (especially green marble) to East Asia, the US, and Europe, generating substantial revenue for domestic industry players.
North America held the market share of 17.00% in 2025 and was expected to grow at the fastest CAGR of 6.2% over the forecast period. The growth of the region can be credited to the robust cultural preference for sustainable, premium natural stone in architecture. Sustained demand for custom marble finishes in residential kitchens and bathrooms is driving a substantial demographic of affluent homeowners and a robust home renovation sector, leading to regional growth soon.
United States
The expanding residential and corporate sectors, specifically luxury homes, hotels, and corporate offices, are the largest consumers of marble in the country.Consumers view marble as a timeless status symbol. Its unique veining and natural patterns enhance interior elegance and significantly boost property value.
Canada
Increasing disposable incomes and an affinity for home improvement shows have fuelled a surge in home renovations, particularly in urban hubs like Toronto, Vancouver, and Montreal.Canadas focus on preserving historical landmarks and government buildings sustains a consistent demand for specialised, high-grade marble.
Europe held the market share of 27.00% in 2025. The growth of the region can be linked to the growing demand for heritage restoration, the adoption of environmentally conscious extraction and processing methodologies, and deeply established traditions in luxury architecture. Furthermore, advanced material extraction and processing techniques reduce material waste and expand the availability of premium slabs, rendering high-end materials increasingly cost-effective for upscale architectural applications.
Germany
High-net-worth individuals and corporate investments fuel consistent demand for imported luxury marble in premium residential flooring, countertops, and bathroom installations.Germanys strong base of skilled stonemasons and architects needs premium raw marble blocks for custom-cut monumental architecture.
France
Increasing consumer preference for bespoke aesthetics, particularly in luxury bathrooms and kitchens, drives steady demand for high-end natural marble.The integration of advanced fabrication tools allows local manufacturers to deliver highly customised finishes that add value to construction projects.
Latin America held the market share of 8.00% in 2025. The growth of the region can be driven by ongoing urbanisation, an expanding middle class, and heightened capital allocation toward commercial real estate and tourism infrastructure. Also, the region possesses an abundance of natural resources. Specifically, nations such as Brazil serve as primary producers of natural stone, a status that has driven significant technological innovation in quarrying methodologies, precision cutting instrumentation, and environmentally sustainable polishing techniques.
Brazil
Brazil is globally renowned as one of the largest reserve-holders and exporters of natural stones. Easy access to domestic raw materials keeps costs down compared to imported alternatives.The integration of modern tools such as multi-wire saws and resin treatments has dramatically increased productivity, which makes it possible to extract and process harder rocks efficiently.
Argentina
Expanding urban development and luxury residential/commercial projects are the primary catalysts, fuelling demand for marble in flooring, countertops, and monumental architecture.Natural marble is highly sought after for key interior spaces like kitchens, bathrooms, and living rooms due to its durability, unique patterns, and perceived luxury status.
The Middle East & Africa held a market share of 7.00% in 2025. The growth of the region can be attributed to the growing urban infrastructure and high-end residential developments coupled with the expansion in luxury hospitality and tourism. Furthermore, distinctive variants like yellow marble are in high demand for indigenous cultural architecture, historical restoration initiatives, and sacred religious edifices such as mosques.
Saudi Arabia
Rapid urbanisation and a growing affluent middle class are spiking the demand for unique, high-end, and durable finishes in residential and commercial spaces.Innovations in quarrying, such as laser-guided cutters and CNC machinery, have improved the quality, edge precision, and supply efficiency of bespoke marble products.
UAE
The UAE’s status as a global tourism and leisure hub boosts the demand for premium natural stones in the construction and renovation of five-star hotels, luxury shopping malls, and cultural landmarks.
High-income consumers and commercial developers are rapidly requesting specialised finishes, laser-guided cutting, and CNC fabrications tailored to unique architectural requirements.
Recent Developments
- In June 2026, Kansai Nerolac Paint Ltd is expanding its premium decorative portfolio in India with the introduction of Excel Mica Marble, a ready-to-tint, designer interior wall finish. Engineered for living areas and accent walls, this water-based acrylic product replicates the visual aesthetic of natural mica stone without the structural demands, high costs, or logistical challenges of traditional stone cladding.(Source:www.ad-hoc-news.de)
Top Companies List
- Antolini Luigi & C SpA
- BC Marble Products Ltd
- Levantina y Asociados de Minerales, S.A.
- Fox Marble
- Kangli stone group
- Best Cheer Stone
- Kingstone Mining Holdings Ltd.
- China Kingstone Mining Holdings Ltd.
- Daltile
- HELLENIC GRANITE Co.
- Topalidis SA
- Santucci Group Srl
Segments Covered
By Product
- Tiles or Slabs
- Marble Tiles
- Polished Tiles
- Honed Tiles
- Textured Tiles
- Marble Slabs
- Gang Saw Slabs
- Cutter Slabs
- Bookmatched Slabs
- Marble Tiles
- Blocks
- Rough Marble Blocks
- Dimension Stone Blocks
- Quarry Blocks
- Others
- Marble Chips
- Marble Powder
- Marble Aggregates
- Decorative Marble Pieces
By Application
- Building and Construction
- Flooring
- Wall Cladding
- Staircases
- Countertops
- Facades
- Statues and Monuments
- Sculptures
- Memorials
- Heritage Restoration
- Furniture
- Table Tops
- Decorative Furniture
- Kitchen & Bathroom Vanity Tops
- Other Applications
- Interior Decoration
- Landscaping
- Handicrafts
- Industrial Fillers
By Region
- North America
- U.S.
- Canada
- Europe
- Germany
- UK
- France
- Italy
- Spain
- Sweden
- Denmark
- Norway
- Asia Pacific
- China
- Japan
- India
- South Korea
- Thailand
- Latin America
- Brazil
- Mexico
- Argentina
- Middle East and Africa (MEA)
- South Africa
- UAE
- Saudi Arabia
- Kuwait
A Seven-Phase Framework
Our methodology is designed to be universally applicable across commodity chemicals, specialty chemicals, petrochemicals, construction chemicals, coatings, electronic chemicals, industrial gases, agrochemicals, water treatment chemicals, and performance materials. Each phase builds upon the last, creating a layered validation structure that minimizes estimation error and maximizes analytical confidence.
The framework ensures comprehensive market coverage, robust cross-validation, and reliable long-term forecasting — producing market estimates that withstand scrutiny from investors, regulators, and corporate strategy teams.

Seven-Phase Framework — Analytical Effort Distribution
Relative analytical effort allocated across each phase of the Chemicals & Materials research framework

Phase 1 - Secondary Research: Establishing the Foundation
Secondary research collects and evaluates publicly available information from authoritative sources, establishing the foundational understanding of market structure, value chain dynamics, competitive landscape, and end-use demand patterns. Every source is evaluated for credibility, recency, geographic relevance, and methodological soundness before inclusion.
Industry Associations
Sources include ACC, CEFIC, ICCA, JCIA, CPCIF, and SOCMA providing production volumes, consumption trends, capacity developments, and sustainability initiatives.
Company Disclosures
Annual reports, investor presentations, earnings transcripts, and regulatory filings reveal product portfolios, manufacturing footprints, capacity expansions, and revenue segmentation.
Government Databases
National statistical offices, customs authorities, environmental agencies, and industrial production databases provide verified statistics on output, trade flows, and regulatory compliance.
Trade Databases
UN Comtrade, ITC, Eurostat, and national customs authorities enable assessment of global product movement, import dependency, and export competitiveness across regions.
Our Secondary Research Sources
- Ministry of Chemicals and Fertilizers
- European Chemicals Agency
- United States Department of Energy
- Ministry of Industry and Information Technology
- Ministry of Economy Trade and Industry
- Ministry of Trade Industry and Energy
- National Institute of Standards and Technology
- Council of Scientific and Industrial Research
- Fraunhofer Society
- National Institute for Materials Science
Phase 2 — Supply-Side Assessment: Mapping Production Capabilities
Production Capacity Analysis
All major manufacturers are assessed for existing installed capacity, planned additions, expansions, new plant announcements, and technology adoption — mapped at global, regional, and country levels.
Capacity Utilization Adjustment
Installed capacity is adjusted using utilization rates based on demand conditions, feedstock availability, plant operating rates, maintenance schedules, and regulatory restrictions.
Manufacturer Revenue Analysis
Product-specific revenues, segment-level performance, regional distribution, average selling prices, and margin trends are evaluated to establish market value estimates.
Supply-Side Assessment — Capacity vs. Effective Production by Region
Illustrative comparison of installed capacity vs. effective production volume (after utilization rate adjustment) across major regions

Phase 3 — Demand-Side Assessment: Quantifying Chemical Consumption
Demand-side analysis quantifies chemical consumption across industries, applications, and geographies — identifying where and how chemicals are consumed throughout the value chain with precision.
End-Use Industry Analysis
Chemical demand is evaluated across automotive, construction, packaging, electronics, agriculture, healthcare, consumer goods, industrial manufacturing, energy and utilities, and water treatment. Industry output, production trends, and consumption intensity are analyzed to determine demand patterns.
Consumption Modeling
Demand is estimated using measurable indicators: kilograms per vehicle, kilograms per square meter of construction, dosage per cubic meter of water treated, kilograms per hectare of agricultural land, and kilograms per ton of manufactured products. Consumption factors are validated through industry publications and primary interviews.
Application Analysis
The market is segmented by application area to understand product performance requirements, formulation trends, technology adoption, customer preferences, and regulatory requirements improving demand accuracy and segmentation granularity.
Demand-Side Assessment — End-Use Industry Demand Distribution
Illustrative distribution of chemical & materials demand across key end-use industries

Phase 4 - Trade Flow Analysis: Balancing Regional Supply and Demand
Trade flow analysis reconciles regional supply and demand estimates through import and export data, identifying net supply positions, regional dependencies, and market imbalances. It serves as an independent validation layer that tests the consistency of supply-side and demand-side estimates.
Import Analysis
Import data is evaluated to determine volumes, source countries, product dependency, regional supply gaps, and pricing trends — identifying markets that rely heavily on external supply and where domestic production is insufficient to meet demand.
Export Analysis
Export assessments reveal production surplus, export competitiveness, regional manufacturing strength, and global market participation. Export patterns also help validate domestic production estimates and identify net exporting regions.
Apparent Consumption Model
Regional consumption is assessed using the standard apparent consumption formula:
Results identify net importing regions, net exporting regions, regional deficits, and surpluses — serving as an independent validation of supply and demand estimates.
Trade Flow Analysis — Net Supply Position by Region
Illustrative apparent consumption vs. domestic production across major regions — positive gap indicates net import dependency

Phase 5 — Primary Research: The Critical Validation Layer
Primary research tests and refines findings from secondary research through direct engagement with industry participants across the supply chain, demand side, and expert community. It captures intelligence that no database or published report can provide — the real-world experience of manufacturers, buyers, and specialists operating in the market.

Supply-Side Interviews
Conversations with chemical manufacturers, raw material suppliers, contract manufacturers, technology providers, and plant operators cover production trends, capacity utilization, pricing developments, technology shifts, and competitive dynamics.

Demand-Side Interviews
Engagement with OEMs, industrial consumers, procurement managers, distributors, formulators, and end-use manufacturers focuses on consumption trends, purchasing behavior, product substitution, demand outlook, and emerging applications.

Industry Expert Consultations
Additional interviews with industry consultants, independent experts, regulatory specialists, technical professionals, and research institutions provide deeper market context and validate key analytical assumptions.
Focus Areas of Primary Research:
Market Size & Forecast Validation
Revenue estimates, volume consumption, growth rates, forecast assumptions, regional demand.Supply Chain & Value Chain Assessment
Raw material sourcing, supply chain challenges, distribution networks, procurement practices.Production & Capacity Analysis
Manufacturing capacity, utilization rates, expansion projects, plant investments.Pricing & Cost Structure Analysis
Product pricing trends, feedstock costs, energy costs, margin pressures, pricing outlook.Competitive Landscape Assessment
Volume and value estimates confirmed to be fully consistent with one another before publicationInterview Volume by Market Scope
| Study Scope | Number of Interviews |
|---|---|
| Niche Market | 20 – 30 |
| Mid-Sized Market | 30 – 50 |
| Global Market | 50 – 80 |
| Highly Fragmented Market | 80 – 120 |
Interview Details:
Category : Manufacturers, Suppliers, Distributors, End Users, Experts/Associations
Average Duration : 30–60 Minutes
Interview Mode : Video calls, telephonic interviews, expert consultations
Interview Format : Structured / Semi-Structured questionnaire
Focus Areas of Primary Research:
Market Size & Forecast Validation :
Revenue estimates, volume consumption, growth rates, forecast assumptions, regional demand.
Supply Chain & Value Chain Assessment :
Raw material sourcing, supply chain challenges, distribution networks, procurement practices.
Production & Capacity Analysis :
Manufacturing capacity, utilization rates, expansion projects, plant investments.
Pricing & Cost Structure Analysis :
Product pricing trends, feedstock costs, energy costs, margin pressures, pricing outlook.
Competitive Landscape Assessment :
Market share, competitor positioning, strategic initiatives, partnerships, acquisitions.
Primary Research — Stakeholder Coverage by Category
Distribution of interview respondents across stakeholder categories (% share from PPT data)

Primary Research — Respondent Designation Profile
Seniority breakdown of interview respondents (% share from PPT data)

Primary Research — Geographic Coverage of Interviews
Regional distribution of primary research engagement (% share from PPT data)

Phase 6 — Data Triangulation and Market Validation
No single methodology is relied upon in isolation. Multiple independent estimation approaches are combined and reconciled to ensure consistency, accuracy, and analytical defensibility. Any material deviations between approaches are investigated and adjusted through additional validation cycles.
The final market size is derived through weighted triangulation of all validated methodologies. Any material deviations between approaches are investigated and adjusted through additional validation cycles. The outcome represents the most realistic assessment of the market based on available evidence and expert confirmation ensuring that volume and value estimates are fully consistent with one another.
Triangulation Framework — Input Contribution Weight
Relative weight each sizing input contributes to the final reconciled market estimate

Phase 7 — Forecast Modeling: Projecting Future Market Evolution
Forecasting evaluates the future trajectory of the market using a combination of quantitative indicators and qualitative assessments across economic, industry, and regulatory dimensions. Rather than simple extrapolation, each driver is independently modeled and integrated into a composite forecast.
Macroeconomic Indicators
GDP growth, industrial production, manufacturing output, construction activity, consumer spending, and capital investment form the quantitative foundation of long-term demand projections. These are applied at country, regional, and global levels.
Industry Growth Drivers
Urbanization, infrastructure development, industrialization, technological innovation, sustainability initiatives, and evolving product performance requirements are assessed at regional and industry levels — capturing both structural and cyclical demand drivers.
Capacity Expansion Analysis
Announced plant expansions, new manufacturing facilities, technology upgrades, and strategic investments are evaluated to determine future supply-demand dynamics and potential market tightness or oversupply situations.
Regulatory & Sustainability
Environmental regulations, chemical safety standards, emission reduction targets, circular economy initiatives, and sustainability requirements are incorporated as they often influence product adoption rates and market growth trajectories.
Scenario Forecast Range — Indexed Market Growth (Year 1–10)
Illustrative indexed growth trajectories across Base, Optimistic, and Pessimistic scenarios over a 10-year forecast horizon

Forecast Drivers — Relative Impact Score by Category
Impact score (0–100) of each driver type on chemicals & materials market forecast




Comments
Share your thoughts, ask a question, or provide feedback about this report.