
Videsh Swar says that after in-depth analysis, there are good prospects for the global bio-acetic acid market growth. In 2025, the bio-acetic acid market is projected to reach a size of USD 1.28 billion, followed by a CAGR of 12.84% during 2025-2035. His analysis highlights the fact that the market is becoming larger because of the use of renewable feedstocks, the rise in bio-based chemicals production, the development of fermentation technologies, and the development of higher purity and higher value applications. In 2025, the market volume amounted to 812.40 thousand metric tons. Some key players in the market are LanzaTech, SEKAB, Celanese Corporation, Gujarat Narmada Valley Fertilizers & Chemicals, INEOS Acetyls, and Jiangsu Sopo.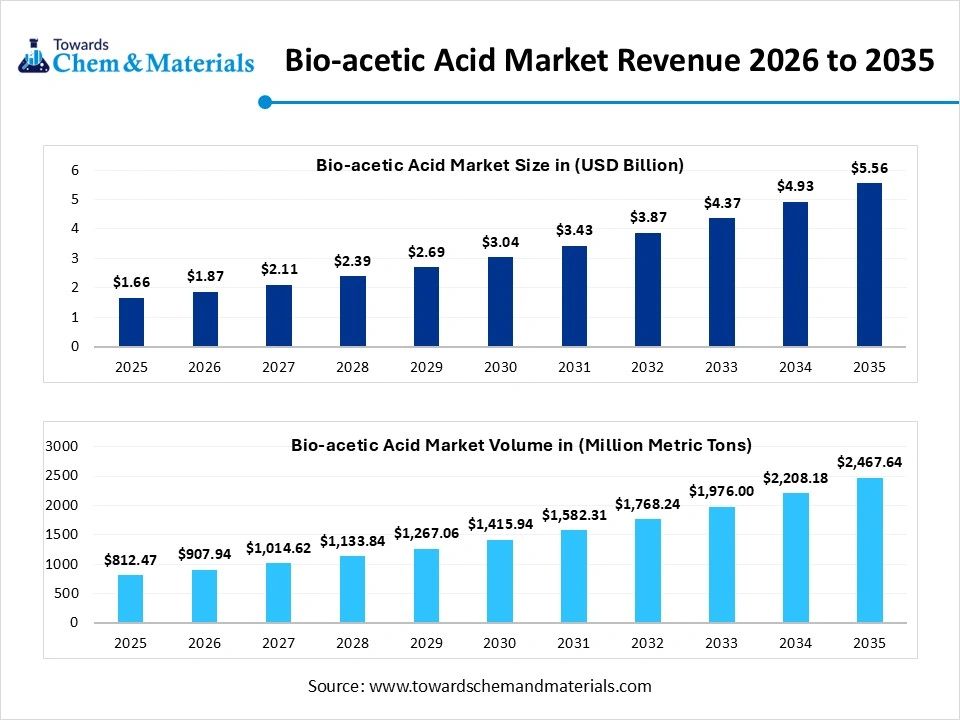
Key Takeaways
- Asia Pacific dominated the market with a 37% share in 2025.
- Europe held a 28% market share in 2025 and is expected to grow at the fastest CAGR of 12.68% during the forecast period.
- By feedstock, the sugarcane segment dominated the market with a 36% share in 2025.
- By production technology, the fermentation segment dominated the market with a 62% share in 2025.
- By purity, the standard industrial purity (99%-99.8%) segment dominated the market with a 51% share in 2025.
- By application, the vinyl acetate monomer (VAM) segment dominated the market with a 33% share in 2025.
- By end-use industry, the chemicals segment dominated the market with a 42% share in 2025.
Market Overview
Global Bio-Acetic Acid Market Reaches USD 1.28 Billion in 2025
The global bio-acetic acid market is expected to grow at a steady pace till 2035. Bio-acetic acid can be produced using renewable raw materials like sugarcane, corn, cellulosic biomass, and food waste, in a bio-based production process. Applications include vinyl acetate monomer, production of esters, purified terephthalic acid, food and beverage, and pharmaceuticals. The global bio-acetic acid market is estimated to generate USD 1.28 billion of revenue in 2025, rising 12.84% annually throughout 2025-2035. The volume recorded in the market was 812.40 thousand tons in 2025. It is driven by the expansion of bio-based chemical production, increased application of renewable feedstocks, development of fermentation and catalytic conversion-based production, development of gasification-based production, and development of hybrid biorefinery technologies.
- Key Insights: The market is moving into a robust commercialization stage, and value will more than triple by 2035.
A Decade of Rapid Compounding: The 2025-2035 Revenue Curve
The global bio-acetic acid market was worth USD 1.28 billion in 2025 and is expected to grow to around USD 4.28 billion by 2035, growing at 12.84% CAGR during the forecast period. This is equivalent to a 10 percent growth in revenue over the 10-year period, driven by rising use of renewable feedstocks, growth in production of bio-based chemicals, and the development of fermentation and other biological production technologies. The market is also shifting towards higher purity products and higher value applications such as pharmaceuticals and ester production. The revenue curve is thus a combination of rising production volumes as well as the steady transition to more value-added bio-acetic acid applications.
- Key Insights- The Bio-acetic acid market is expected to grow by more than triple by 2035, driven by an annual growth of more than 10%.
Celanese: The Worlds Largest Acetic Acid Producer
The worlds largest producer of conventional acetic acid and vinyl acetate monomer (VAM) is Celanese Corporation, with about 1.95 million tonnes per year (TPA) capacity for acetic acid, accounting for about 20% of the worlds conventional acetic acid capacity. It noted that its FY2024 revenue was $10.28 billion, while it has 56 production facilities in the world. The 1.3-million-ton capacity expansion of acetic acid capacity at Celaneses Clear Lake, Texas, plant took place in April 2024. The expansion combines carbon capture and will ensure a long-term supply of carbon monoxide to enable lower-carbon conventional acetic acid production. The scale of Celanese conventional capacity is a useful competitive comparison to the new bio-acetic acid market.
- Key Insights- Celaneses extensive manufacturing facilities and growth plans based on carbon-capture-integrated production position it in the wider acetic acid market.
LanzaTechs Gas Fermentation Platform Scales to Six Commercial Facilities
LanzaTech has created a gas and carbon fermentation technology platform to produce ethanol and other downstream chemicals from industrial waste gases and biomass. The company has six commercial gas fermentation facilities, indicating commercial scale-up of its technology. It has a Shougang facility in China to produce 48,000 tons of ethanol a year, and the platform is at Technology Readiness Level 10. LanzaTech announced successful operating results at its pilot plant for converting municipal solid waste (MSW) to ethanol in Kuji City, Japan, in January 2026, in collaboration with SEKISUI Chemical. The pilot ran for almost four years, enabling them to achieve unsorted processing of non-recyclable waste streams.
- Key Insights: Commercial facilities prove that LanzaTechs technology for waste- and biomass-based fermentation technologies is becoming more scalable.
INEOS-GNFC to Build Indias Second Acetic Acid Plant: 600 Kilotons/Year
In November 2024, INEOS and Gujarat Narmada Valley Fertilizers & Chemicals signed an MOU to discuss the construction of a new 600 kiloton per year acetic acid plant at GNFCs Plant in Bharuch, Gujarat. The proposed plant will be the second commercial acetic acid plant in India. The proposed plant is an important capacity addition to the country, as GNFC is the only commercial acetic acid manufacturer in India. The chemical manufacturing base is also boosted with the development, which also offers further infrastructure to support the future development of bio-based acetic acid and its downstream chemical production in India.
- Key Insight: The proposed 600-kiloton facility would provide a substantial boost to the countrys acetic acid production.
Segmental Analysis
By Feedstock: Sugarcane Dominates Feedstock Mix With a 36% Market Share
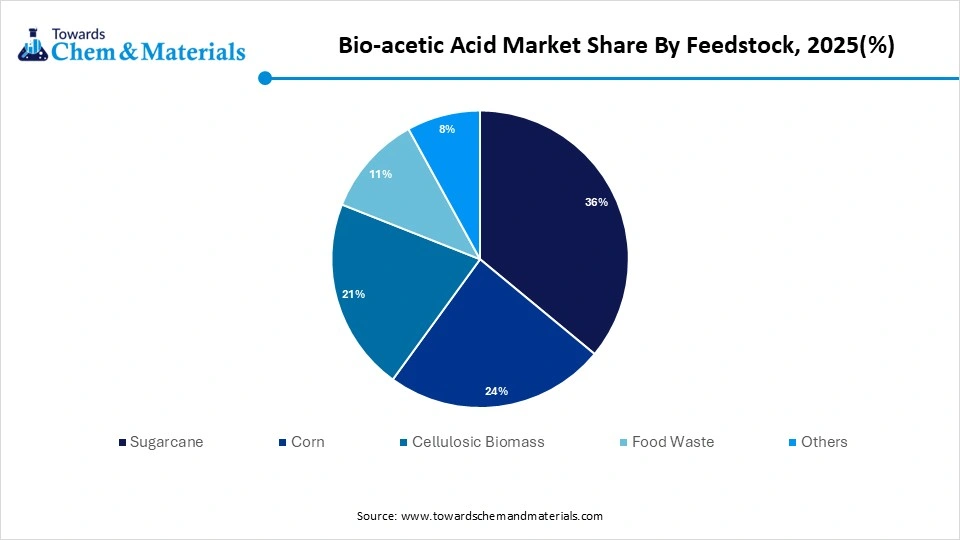 Sugarcane accounted for 36% of the bio-acetic acid feedstocks market in 2025, benefiting from its well-established supply and association with bioethanol production. Cellulosic biomass was the second largest at 21%, followed by corn at 24%. Other feedstocks, like food waste, and others held lesser shares. The cellulosic biomass is anticipated to grow at the fastest rate in 2025-2035, with a CAGR of 14.92%. A 13.54% CAGR for Food Waste follows. The increased growth of non-food feedstocks is indicative of the rising interest in second-generation biofuels and waste-generated production methods. Sugarcane and corn provide 60% of the feedstock mix and continue to be significant sources in the marketplace.
- Key Insights: The demand for sugarcane as feedstock is highest, and cellulosic biomass is the fastest-growing sector.
Source: Towards Chem and Materials Database
By Production Technology: Fermentation Dominates Production Technology With a 62% Market Share
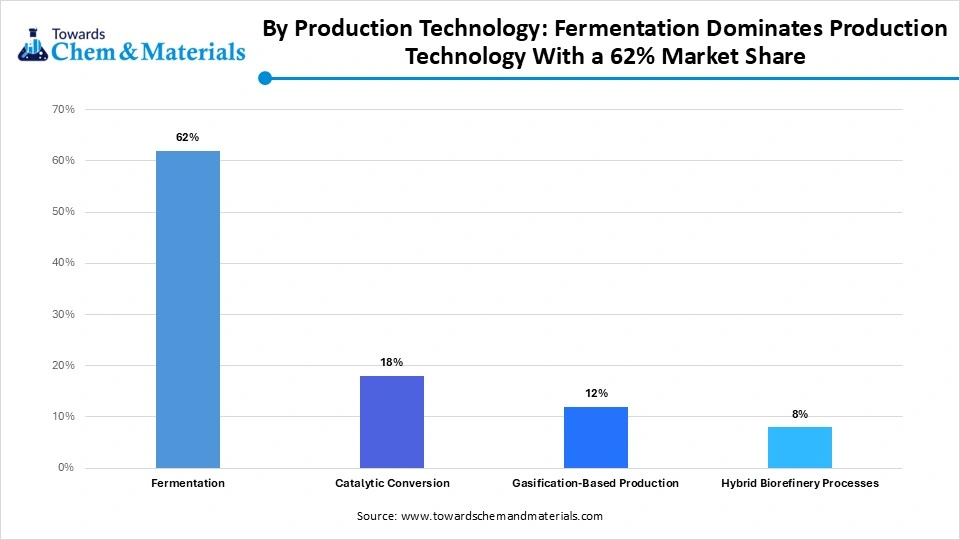 In 2025, the bio-acetic acid production technology market was dominated by fermentation, accounting for 62% of its share. This is because it has taken the top spot due to its maturity and proven track record of commercial production of biologicals. Catalytic conversion accounted for 18% of the market share, while gasification-based processes came in at 12%, and hybrid biorefinery processes at 8%. Production using gasification is projected to show the highest CAGR of 14.18% in 2025-2035. This is followed by a hybrid biorefinery process with a growth rate of 13.72% and fermentation with a growth rate of 13.08%. This is the result of growing interest in biomass gasification and syngas fermentation, as reflected by the increased growth rate of gasification-based production.
- Key Insights: The majority of the production now takes place by fermentation, and the fastest-growing production process is gasification-based production.
Source: Towards Chem and Materials Database
By Purity: Standard Industrial Purity (99%-99.8%) Holds a Majority 51% Share
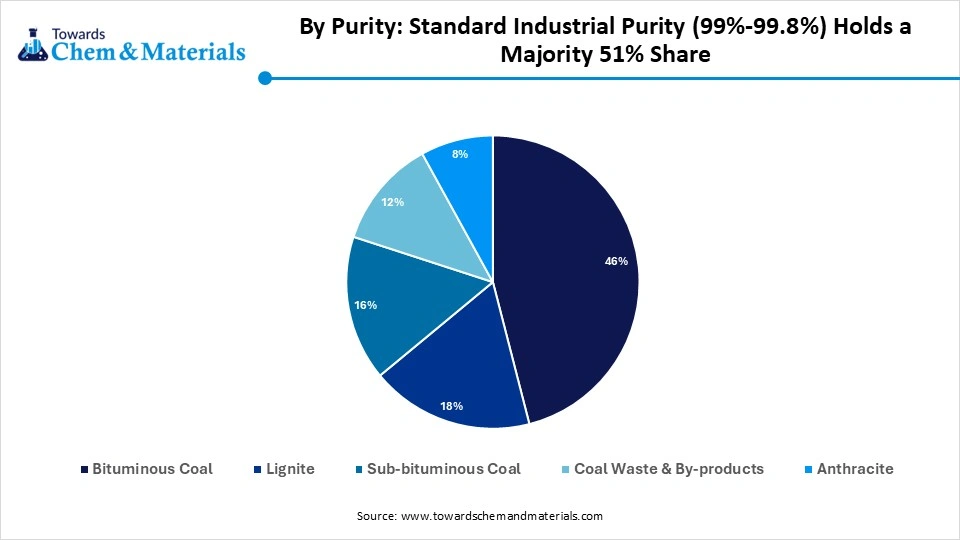 In 2025, the 99% - 99.8% bio-acetic acid purity category had the largest share, accounting for 51%. The standard industrial purity range is the biggest part of the present market production. The other 18% was recorded as purity less than 99%, and 31% as more than 99.8%. The above 99.8% category is projected to be the fastest growing segment with 13.92% CAGR over the 2025-35 forecast period. The 99% - 99.8% category follows with a 12.76% CAGR, while below 99% purity is projected to grow at 11.52%. The premium purity segment is growing more quickly due to increased demand for high-purity applications, while the middle tier is seeing steady growth.
- Key Insights: Standard industrial purity continues to be the primary market, and above 99.8% purity is the fastest growing.
Source: Towards Chem and Materials Database
By Application: Vinyl Acetate Monomer (VAM) Leads Application Demand at 33% Share
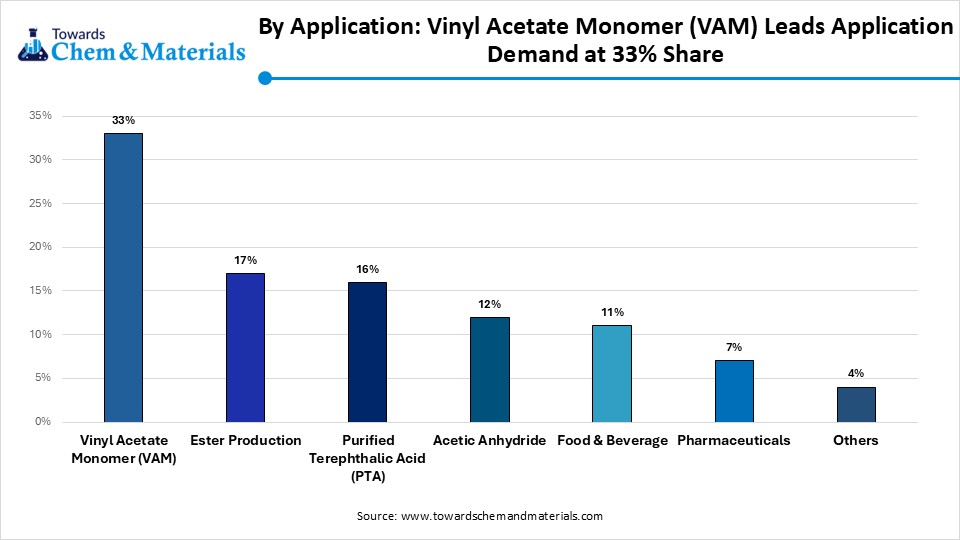 In 2025, the market was dominated by the vinyl acetate monomer application segment, accounting for 33% of the market share. Production of ester and purified terephthalic acid was 17% and 16%, respectively. The rest of the market demand was for acetic anhydride, food and beverage, pharmaceuticals, and others. The growth of Ester is expected to be the fastest between 2025 and 2035 at a CAGR of 13.88%. Pharmaceuticals are expected to be next with 13.42% growth, followed by food and beverage at 13.24%. The growth of ester production indicates the rising demand for bio-based solvents and fragrances, which is another growth point, apart from the frontrunner VAM application.
- Key insights: VAM dominates the application demand, and the production of esters is the fastest-growing application.
Source: Towards Chem and Materials Database
By End-use Industry: Chemicals is the Dominant End-Use Industry at 42% Share
The chemicals industry dominated the bio-acetic acid end-use segment with a 42% market share in 2025. The pharmaceutical industry came a close second at 13%, followed by food and beverage at 17%. The balance of demand was in textile (11 per cent), packaging (9 per cent), and other industries. During the forecast period, 2025-2035, the fastest-growing end-use industry is expected to be pharmaceuticals with a 13.96% CAGR. Food and beverage has the highest CAGR at 13.21%, and packaging is expected to grow at 12.88%. Pharmaceutical growth has been strong and complementary to the trend of higher-value bio-acetic acid applications, due to demand for high-purity products.
- Key Insight: Chemicals are the most dominant end-use demand, and pharmaceuticals are the fastest-growing industry.
Source: Towards Chem and Materials Database
Regional Analysis
Asia-Pacific Leads With 37% Share and the Fastest Regional Growth at 13.84%
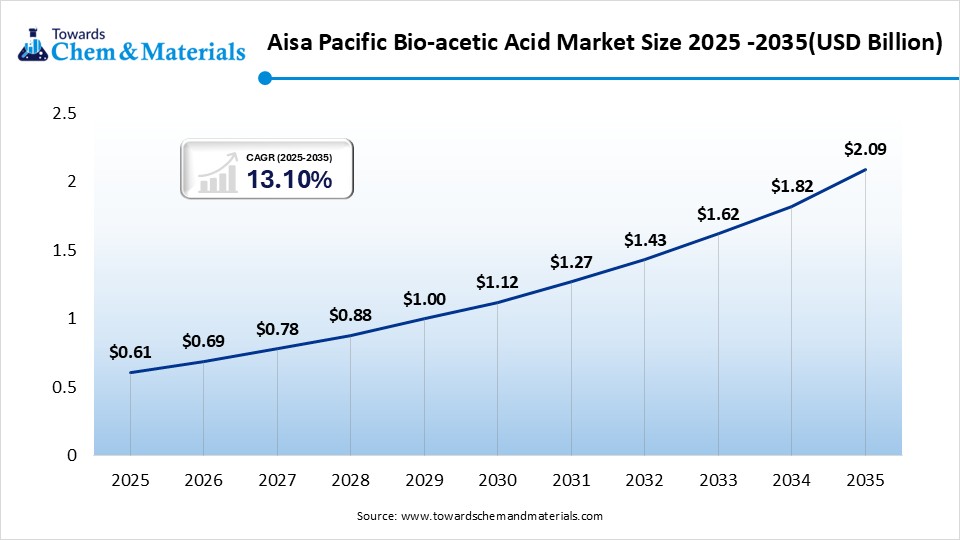
Asia-Pacific occupied the leading position in the global bio-acetic acid market, accounting for 37% of the market in 2025, and had the highest CAGR of 13.84% in the region during the forecast period. The region is the largest current market size and also has the fastest forecast growth rate. The Chinese, Indian, and Japanese market is determined as key markets for the development of the region through biorefinery investments and the development of biomass-based infrastructure. The ethanol program also offers a relevant feedstock and processing location for future bio-acetic acid production in India. The position of the region is projected to improve in the forecast period due to continued growth in the production of bio-based chemicals and the use of renewable feedstocks.
- Key Insights- Asia-Pacific is the region with the maximum market share and growth.
Europe Holds the Second-Largest Share at 28%
Source: Towards Chem and Materials Database
The regional share of Europe was 28% in 2025 and is projected to rise at a CAGR of 12.68% for the period 2025–2035. There are strict environmental regulations and preferences for procurement in line with the Green Deal that foster the development of the market in the region. These factors make bio-based chemical products more attractive and drive the creation of lower-carbon production pathways. The growth rate of the European market is also close to the global market at 12.84%, which shows that the growth is steady in the European market as compared to the Asia-Pacific market. Germany, France, the UK, the Netherlands, and Italy are part of the key countries in Europes market segmentation.
- Key insight: Europe continues to be a significant market driven by the EU environment and sustainability agenda in procurement.
Source: Towards Chem and Materials Database
North America: 24% Share, Anchored by Corporate Sustainability Commitments
North America was the largest bio-acetic acid market in 2025, occupying 24% of the global market, and is expected to grow at a CAGR of 12.22% during the forecast period. The areas market position is bolstered by sound biorefining capabilities and business sustainability initiatives. The growth rate is marginally lower than the global CAGR, indicating that the market is fairly developed and has a deeper biorefining base than the Asia-Pacific region, which is experiencing higher growth rates. The regional segmentation includes the United States, Canada, and Mexico. It also has significant conventional acetic acid production capacity, such as Celaneses scale and lower-carbon production investments, which give important context to the new bio-based production.
- Key Insights- North America has a strong base of biorefining facilities and emerging demand due to sustainability.
Source: Towards Chem and Materials Database
Latin America: Smallest Growth Rate Despite Sugarcane Feedstock Advantage
In 2025, Latin America accounted for 6 percent of the market and is projected to experience a CAGR of 11.95% from 2025 to 2035. The region enjoys a feedstock advantage because it is based on Brazils sugarcane industry, but growth is the slowest of all the major regions. Upstream feedstock production seems to be lagging behind market expansion, suggesting there is still a significant development opportunity for biochemical processing infrastructure. Regional segmentation includes Brazil, Argentina, and Chile. Brazil has an appropriate foundation for bio-based chemical production, and with more development downstream, that foundation can be expanded by using the countrys sugarcane resources.
- Key Insights: The strength of Latin Americas feedstock is a potential, and downstream processing is still significant for expansion.
Source: Towards Chem and Materials Database
Middle East & Africa: The Smallest Base, Still Growing Above 11.6%
The Middle East & Africa was the smallest market segment in 2025 with 5% market share, and is expected to witness 11.63% CAGR. The region, which has a smaller market size, still demonstrates double-digit growth during the forecast period. The regional segmentation includes Saudi Arabia, the UAE, South Africa, and Egypt. Domestic production of acetic acid is also starting in Africa. An example of emerging regional production activity can be cited as the first commercial acetic acid plant, which has a capacity of 30,000 tons per year in Kenya.
- Key Insights: Despite having a small number of buyers, the region is seeing widespread double-digit growth.
Source: Towards Chem and Materials Database
Recent Developments:
- In January 2026, LanzaTech announced positive test outcome results at an ethanol pilot plant built with SEKISUI Chemical at a municipal solid waste facility in Kuji City, Japan. The pilot was conducted for almost four years and confirmed the processing capabilities of the platform for unsorted mixed non-recyclable waste streams for the production of bio-based chemicals. (Source:ir.lanzatech.com)
- In July 2026, India announced it had reached 20% ethanol blending in petrol five years ahead of its target of 2030. The development extends the countrys base of biomass-to-chemicals resources and processing capabilities, and offers relevant infrastructure for future bio-acetic acid production.(Source:www.pib.gov.in)
- In November 2024, INEOS and Gujarat Narmada Valley Fertilizers & Chemicals signed an MoU to look into a new 600 kiloton per year acetic acid plant at GNFCs plant in Bharuch, Gujarat. The proposed plant will be the second commercial acetic acid plant in India.(Source:www.ineos.com)
- In April 2024, Celaneses Clear Lake, Texas, facility underwent a 1.3 million ton per year acetic acid capacity increase. The expansion combines carbon capture and provides a long-term carbon monoxide supply to enable conventional acetic acid production with lower carbon emissions. (https://www.celanese.com/news-and-media/2024/april/celanese-completes-series-of-strategic-actions-across-its-global-acetyl-chain)
- In May 2023, SEKAB increased the production of 100% bio-based acetic acid. The development allows to reduce CO2 emissions by 50% compared to conventional acetic acid, thus increasing the sustainability argument for the bio-based production.(Source:www.sekab.com)
- In February 2025, Solberg Industri announced a partnership for growing its chemical recycling and circular solutions. It is a project that looks at turning industrial acid waste into a resource and the general development of circular approaches to the production of chemicals.
| Date | Development | Source |
| Jan-26 | LanzaTech confirmed successful operational results at its municipal solid waste (MSW)-to-ethanol pilot plant in Kuji City, Japan (with SEKISUI Chemical), which ran for nearly four years, demonstrating the platform can process unsorted mixed non-recyclable waste streams. | LanzaTech corporate press release, January 2026 |
| Jul-25 | India confirmed it achieved 20% ethanol blending in petrol, five years ahead of its original 2030 target — directly expanding the biomass-to-chemicals feedstock and processing base relevant to bio-acetic acid. | Govt. of India, Ministry of Petroleum & Natural Gas, via newsonair.gov.in |
| Nov-24 | INEOS and Gujarat Narmada Valley Fertilizers & Chemicals (GNFC) signed an MoU to explore building a new 600-kiloton/year acetic acid plant at GNFCs site in Bharuch, Gujarat — Indias second commercial acetic acid facility. | Grand View Research, Acetic Acid Market Report |
| Apr-24 | Celanese completed a 1.3 million-ton acetic acid capacity expansion at its Clear Lake, Texas, facility, integrating carbon capture and securing a long-term carbon monoxide supply. | Mordor Intelligence, Acetic Acid Market report |
| May-23 | SEKAB (Svensk Etanolkemi AB, Sweden) expanded production of 100% bio-based acetic acid, enabling downstream users to cut their CO2 emissions by 50% versus conventional acetic acid. | Mordor Intelligence, Acetic Acid Market Report |
| Feb-25 | Solberg Industri AS (Norway) announced a new partnership to expand its chemical recycling and circular solutions, specializing in reusing industrial acid waste as a resource. | Research Nester, Acetic Acid Market Report |
Expert Insights
From my research, the bio-acetic acid market is evolving towards wider commercial use with the continued evolution of renewable feedstocks and bio-based production technologies. Cellulosic biomass, gasification-based production, higher purity grades, ester production, and pharmaceutical applications are good prospects. The future success of the market will be determined by production scale, feedstock availability, cost competitiveness, and technology development. Collaborations between companies that develop bio-based technology and companies with long-standing chemical expertise are hoped to facilitate market growth.
Our Experts
Videsh Swar handled the primary research, market trends, competition, strategic opportunities, methodology, segmentation, and forecasts.
Aman has collected regulations, feedstock data, company information, partnerships, and other quantitative data that aid in bolstering market estimations.
Aditi has gone through the overall research document, verified the findings, corrected inconsistencies, conducted quality checks, and finished the entire set of research work in such a manner as to make it clear for readers and publication-ready.
Key Companies:
| Company | HQ | Core Business | Relevant Public Information |
| LanzaTech (NASDAQ: LNZA) | Chicago, Illinois, USA | Gas/carbon fermentation platform producing ethanol and downstream chemicals from industrial waste gases and biomass | 6 commercial gas fermentation facilities operating; Shougang, China plant produces 48,000 tons/yr ethanol; technology at TRL 10; MSW-to-ethanol pilot with SEKISUI in Japan completed 4-year run (Jan 2026) |
| SEKAB (Svensk Etanolkemi AB) | Sweden | Bio-based chemicals and cellulosic ethanol technology | Produces 100% bio-based acetic acid; downstream users achieve a verified 50% cut in CO2 emissions versus conventional acetic acid (May 2023) |
| Celanese Corporation | Irving, Texas, USA | Worlds largest producer of conventional (petrochemical) acetic acid and vinyl acetate monomer (VAM) | ~1.95M tonnes/yr acetic acid capacity (~20% of global capacity); FY2024 revenue $10.28B; 56 global production facilities; completed 1.3M-ton carbon-capture-integrated expansion at Clear Lake, TX (Apr 2024) |
| Gujarat Narmada Valley Fertilizers & Chemicals (GNFC) | Gujarat, India | Fertilizers and chemicals, including Indias only current acetic acid production | Currently Indias sole commercial acetic acid producer; subject of a Nov 2024 MoU with INEOS to build a second, 600 KT/year plant at its Bharuch site |
| INEOS Acetyls | Europe (INEOS Group, UK/Switzerland) | Global acetic acid and acetyls production | Signed Nov 2024 MoU with GNFC to explore a new world-scale 600 KT/year acetic acid plant in India, indicating an active regional expansion strategy |
| Jiangsu Sopo (Group) Co., Ltd. | Jiangsu, China | Major Chinese producer of glacial acetic acid and derivatives | One of Chinas largest glacial acetic acid providers, with a capacity cited at approximately 12,000 kilotons per annum |
| Solberg Industri AS | Norway | Chemical recycling and circular industrial-waste solutions | Expanding chemical recycling and circular solutions, specializing in reusing industrial acid waste as a resource (Feb 2025 partnership announcement) |
Segments Covered
| Category | Segments |
| By Feedstock | Sugarcane (Sugarcane Juice; Molasses) · Corn (Corn Starch; Corn Syrup) · Cellulosic Biomass (Agricultural Residues; Forestry Residues; Energy Crops) · Food Waste (Organic Municipal Waste; Industrial Food Waste) · Others (Algae Biomass; Glycerol; Mixed Biomass) |
| By Production Technology | Fermentation (Aerobic; Anaerobic) · Catalytic Conversion (Bioethanol-to-Acetic Acid; Biomass-derived Syngas Conversion) · Gasification-Based Production (Biomass Gasification; Syngas Fermentation) · Hybrid Biorefinery Processes |
| By Purity | Below 99% · 99%–99.8% · Above 99.8% |
| By Application | Vinyl Acetate Monomer (VAM) · Purified Terephthalic Acid (PTA) · Acetic Anhydride · Ester Production · Food & Beverage · Pharmaceuticals · Others (Textile Chemicals; Dyes & Pigments; Industrial Solvents) |
| By End-use Industry | Chemicals · Food & Beverage · Pharmaceuticals · Textile · Packaging · Others |
| Region - North America | U.S.; Canada; Mexico |
| Region - Europe | Germany; U.K.; France; Italy; Spain; Netherlands; Rest of Europe |
| Region - Asia-Pacific | China; Japan; India; South Korea; Thailand; Australia; Rest of Asia-Pacific |
| Region - Latin America | Brazil; Argentina; Rest of Latin America |
| Region - Middle East & Africa | GCC; South Africa; Rest of Middle East & Africa |
References
- Client-supplied Bio-Acetic Acid Market dataset (market size, volume, pricing, full segmentation hierarchy), 2025.
- ResearchNester — Acetic Acid Market Size, Price, Demand and Forecast, 2034 (global market benchmark, 2025 data).
- Mordor Intelligence — Acetic Acid Market Size, Growth, Share & Trends Report 2030 (Celanese Clear Lake expansion; SEKAB bio-based acetic acid).
- MarketGrowthReports — Acetic Acid Market Size | Global Report [2035] (China/global capacity; Kenya plant), January 2026.
- Grand View Research — Acetic Acid Market Size And Share, Industry Report 2033 (INEOS-GNFC MoU, November 2024).
- Wikipedia / corporate disclosure aggregation — Celanese Corporation (production capacity, revenue, headquarters).
- LanzaTech corporate disclosures and press releases, including Kuji City, Japan MSW-to-ethanol results (January 2026).
- We Mean Business Coalition — LanzaTech interview on gas fermentation technology and commercial deployment.
- U.S. Department of Energy, Bioenergy Technologies Office (BETO) — LanzaTech Project Peer Review, April 2023.
- UK Parliament Committees — LanzaTech written evidence submission on gas fermentation and steel decarbonization.
- Government of India, Ministry of Petroleum & Natural Gas / Press Information Bureau — 20% ethanol blending achievement, July 2025.
- KPIAS Academy — Ethanol Blending Programme India: Policy & Challenges (installed capacity data), 2026.
- Research Nester — Acetic Acid Market report, citing Solberg Industri AS partnership, February 2025.
A Seven-Phase Framework
Our methodology is designed to be universally applicable across commodity chemicals, specialty chemicals, petrochemicals, construction chemicals, coatings, electronic chemicals, industrial gases, agrochemicals, water treatment chemicals, and performance materials. Each phase builds upon the last, creating a layered validation structure that minimizes estimation error and maximizes analytical confidence.
The framework ensures comprehensive market coverage, robust cross-validation, and reliable long-term forecasting — producing market estimates that withstand scrutiny from investors, regulators, and corporate strategy teams.

Seven-Phase Framework — Analytical Effort Distribution
Relative analytical effort allocated across each phase of the Chemicals & Materials research framework

Phase 1 - Secondary Research: Establishing the Foundation
Secondary research collects and evaluates publicly available information from authoritative sources, establishing the foundational understanding of market structure, value chain dynamics, competitive landscape, and end-use demand patterns. Every source is evaluated for credibility, recency, geographic relevance, and methodological soundness before inclusion.
Industry Associations
Sources include ACC, CEFIC, ICCA, JCIA, CPCIF, and SOCMA providing production volumes, consumption trends, capacity developments, and sustainability initiatives.
Company Disclosures
Annual reports, investor presentations, earnings transcripts, and regulatory filings reveal product portfolios, manufacturing footprints, capacity expansions, and revenue segmentation.
Government Databases
National statistical offices, customs authorities, environmental agencies, and industrial production databases provide verified statistics on output, trade flows, and regulatory compliance.
Trade Databases
UN Comtrade, ITC, Eurostat, and national customs authorities enable assessment of global product movement, import dependency, and export competitiveness across regions.
Our Secondary Research Sources
- Ministry of Chemicals and Fertilizers
- European Chemicals Agency
- United States Department of Energy
- Ministry of Industry and Information Technology
- Ministry of Economy Trade and Industry
- Ministry of Trade Industry and Energy
- National Institute of Standards and Technology
- Council of Scientific and Industrial Research
- Fraunhofer Society
- National Institute for Materials Science
Phase 2 — Supply-Side Assessment: Mapping Production Capabilities
Production Capacity Analysis
All major manufacturers are assessed for existing installed capacity, planned additions, expansions, new plant announcements, and technology adoption — mapped at global, regional, and country levels.
Capacity Utilization Adjustment
Installed capacity is adjusted using utilization rates based on demand conditions, feedstock availability, plant operating rates, maintenance schedules, and regulatory restrictions.
Manufacturer Revenue Analysis
Product-specific revenues, segment-level performance, regional distribution, average selling prices, and margin trends are evaluated to establish market value estimates.
Supply-Side Assessment — Capacity vs. Effective Production by Region
Illustrative comparison of installed capacity vs. effective production volume (after utilization rate adjustment) across major regions

Phase 3 — Demand-Side Assessment: Quantifying Chemical Consumption
Demand-side analysis quantifies chemical consumption across industries, applications, and geographies — identifying where and how chemicals are consumed throughout the value chain with precision.
End-Use Industry Analysis
Chemical demand is evaluated across automotive, construction, packaging, electronics, agriculture, healthcare, consumer goods, industrial manufacturing, energy and utilities, and water treatment. Industry output, production trends, and consumption intensity are analyzed to determine demand patterns.
Consumption Modeling
Demand is estimated using measurable indicators: kilograms per vehicle, kilograms per square meter of construction, dosage per cubic meter of water treated, kilograms per hectare of agricultural land, and kilograms per ton of manufactured products. Consumption factors are validated through industry publications and primary interviews.
Application Analysis
The market is segmented by application area to understand product performance requirements, formulation trends, technology adoption, customer preferences, and regulatory requirements improving demand accuracy and segmentation granularity.
Demand-Side Assessment — End-Use Industry Demand Distribution
Illustrative distribution of chemical & materials demand across key end-use industries

Phase 4 - Trade Flow Analysis: Balancing Regional Supply and Demand
Trade flow analysis reconciles regional supply and demand estimates through import and export data, identifying net supply positions, regional dependencies, and market imbalances. It serves as an independent validation layer that tests the consistency of supply-side and demand-side estimates.
Import Analysis
Import data is evaluated to determine volumes, source countries, product dependency, regional supply gaps, and pricing trends — identifying markets that rely heavily on external supply and where domestic production is insufficient to meet demand.
Export Analysis
Export assessments reveal production surplus, export competitiveness, regional manufacturing strength, and global market participation. Export patterns also help validate domestic production estimates and identify net exporting regions.
Apparent Consumption Model
Regional consumption is assessed using the standard apparent consumption formula:
Results identify net importing regions, net exporting regions, regional deficits, and surpluses — serving as an independent validation of supply and demand estimates.
Trade Flow Analysis — Net Supply Position by Region
Illustrative apparent consumption vs. domestic production across major regions — positive gap indicates net import dependency

Phase 5 — Primary Research: The Critical Validation Layer
Primary research tests and refines findings from secondary research through direct engagement with industry participants across the supply chain, demand side, and expert community. It captures intelligence that no database or published report can provide — the real-world experience of manufacturers, buyers, and specialists operating in the market.

Supply-Side Interviews
Conversations with chemical manufacturers, raw material suppliers, contract manufacturers, technology providers, and plant operators cover production trends, capacity utilization, pricing developments, technology shifts, and competitive dynamics.

Demand-Side Interviews
Engagement with OEMs, industrial consumers, procurement managers, distributors, formulators, and end-use manufacturers focuses on consumption trends, purchasing behavior, product substitution, demand outlook, and emerging applications.

Industry Expert Consultations
Additional interviews with industry consultants, independent experts, regulatory specialists, technical professionals, and research institutions provide deeper market context and validate key analytical assumptions.
Focus Areas of Primary Research:
Market Size & Forecast Validation
Revenue estimates, volume consumption, growth rates, forecast assumptions, regional demand.Supply Chain & Value Chain Assessment
Raw material sourcing, supply chain challenges, distribution networks, procurement practices.Production & Capacity Analysis
Manufacturing capacity, utilization rates, expansion projects, plant investments.Pricing & Cost Structure Analysis
Product pricing trends, feedstock costs, energy costs, margin pressures, pricing outlook.Competitive Landscape Assessment
Volume and value estimates confirmed to be fully consistent with one another before publicationInterview Volume by Market Scope
| Study Scope | Number of Interviews |
|---|---|
| Niche Market | 20 – 30 |
| Mid-Sized Market | 30 – 50 |
| Global Market | 50 – 80 |
| Highly Fragmented Market | 80 – 120 |
Interview Details:
Category : Manufacturers, Suppliers, Distributors, End Users, Experts/Associations
Average Duration : 30–60 Minutes
Interview Mode : Video calls, telephonic interviews, expert consultations
Interview Format : Structured / Semi-Structured questionnaire
Focus Areas of Primary Research:
Market Size & Forecast Validation :
Revenue estimates, volume consumption, growth rates, forecast assumptions, regional demand.
Supply Chain & Value Chain Assessment :
Raw material sourcing, supply chain challenges, distribution networks, procurement practices.
Production & Capacity Analysis :
Manufacturing capacity, utilization rates, expansion projects, plant investments.
Pricing & Cost Structure Analysis :
Product pricing trends, feedstock costs, energy costs, margin pressures, pricing outlook.
Competitive Landscape Assessment :
Market share, competitor positioning, strategic initiatives, partnerships, acquisitions.
Primary Research — Stakeholder Coverage by Category
Distribution of interview respondents across stakeholder categories (% share from PPT data)

Primary Research — Respondent Designation Profile
Seniority breakdown of interview respondents (% share from PPT data)

Primary Research — Geographic Coverage of Interviews
Regional distribution of primary research engagement (% share from PPT data)

Phase 6 — Data Triangulation and Market Validation
No single methodology is relied upon in isolation. Multiple independent estimation approaches are combined and reconciled to ensure consistency, accuracy, and analytical defensibility. Any material deviations between approaches are investigated and adjusted through additional validation cycles.
The final market size is derived through weighted triangulation of all validated methodologies. Any material deviations between approaches are investigated and adjusted through additional validation cycles. The outcome represents the most realistic assessment of the market based on available evidence and expert confirmation ensuring that volume and value estimates are fully consistent with one another.
Triangulation Framework — Input Contribution Weight
Relative weight each sizing input contributes to the final reconciled market estimate

Phase 7 — Forecast Modeling: Projecting Future Market Evolution
Forecasting evaluates the future trajectory of the market using a combination of quantitative indicators and qualitative assessments across economic, industry, and regulatory dimensions. Rather than simple extrapolation, each driver is independently modeled and integrated into a composite forecast.
Macroeconomic Indicators
GDP growth, industrial production, manufacturing output, construction activity, consumer spending, and capital investment form the quantitative foundation of long-term demand projections. These are applied at country, regional, and global levels.
Industry Growth Drivers
Urbanization, infrastructure development, industrialization, technological innovation, sustainability initiatives, and evolving product performance requirements are assessed at regional and industry levels — capturing both structural and cyclical demand drivers.
Capacity Expansion Analysis
Announced plant expansions, new manufacturing facilities, technology upgrades, and strategic investments are evaluated to determine future supply-demand dynamics and potential market tightness or oversupply situations.
Regulatory & Sustainability
Environmental regulations, chemical safety standards, emission reduction targets, circular economy initiatives, and sustainability requirements are incorporated as they often influence product adoption rates and market growth trajectories.
Scenario Forecast Range — Indexed Market Growth (Year 1–10)
Illustrative indexed growth trajectories across Base, Optimistic, and Pessimistic scenarios over a 10-year forecast horizon

Forecast Drivers — Relative Impact Score by Category
Impact score (0–100) of each driver type on chemicals & materials market forecast



Comments
Share your thoughts, ask a question, or provide feedback about this report.