
U.S. AI in Chemicals Market Size, Trends, and Forecast 2026-2035
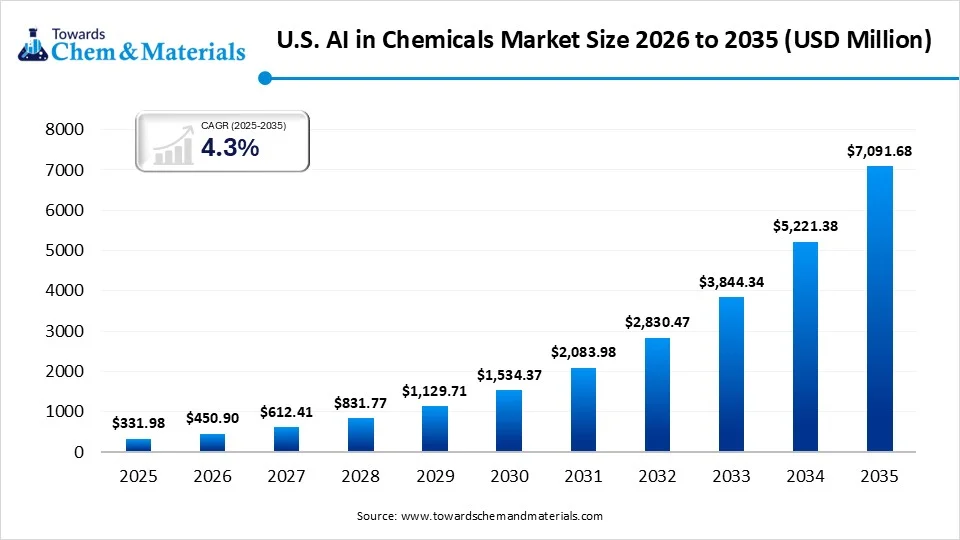
The U.S. AI in chemicals market size was valued at USD 331.98 million in 2025, is estimated to reach USD 450.9 million in 2026, and is projected to reach USD 7,091.68 million by 2035, exhibiting a compound annual growth rate (CAGR) of 4.30% over the forecast period from 2026 to 2035. The analysis provides market intelligence and strategic insights into the evolving AI landscape in the chemical industry in the United States.
Key Takeaway
- By offering, the AI software segment dominated the market with a 50.40% share in 2025 and is expected to grow at a CAGR of 36.70% over the forecast period.
- By offering, the AI services segment held a 25.10% market share in 2025 and is expected to have the fastest growth with a CAGR of 39.20% in the forecast period.
- By application, the production optimization segment dominated the market with a 38.20% share in 2025 and is expected to grow at a CAGR of 34.60% over the forecast period.
- By application, the new material innovation segment held an 18.60% market share in 2025 and is expected to have the fastest growth with a CAGR of 40.80% in the forecast period.
- By end use, the petrochemicals segment dominated the market with a 31.80% share in 2025 and is expected to grow at a CAGR of 33.90% over the forecast period.
- By end use, the speciality chemicals segment held 22.70% market share in 2025 and is expected to have the fastest growth with a CAGR of 39.80% in the forecast period.
Next-Level Precision in US Chemical Manufacturing
The industry is aligned with evolving global industry and consumer preferences while offering fresh prospects in recent years, as per the regional survey. Since artificial intelligence has become part of everyday decision-making, every industry manufacturer is actively looking to implement it in their facilities to tackle expenses and maintain product expertise from the past few years. Moreover, chemical manufacturers in the United States have been seen using AI for better automation, more precise laboratory results, and to compare thousands of chemical possibilities, according to a recent regional industry observation.
For instance, on 21st September 2026, Microsoft Research established a collaboration with GSK and Novartis and introduced the latest AI model called RetroChimera. Also, this newly introduced AI model is specifically designed to help with the development of new medicines, as per the published report.
Investment Flow for U.S. AI in the Chemicals Market 2026
- Chemical manufacturers are actively investing in advanced and better artificial intelligence models that can help researchers to decide on better and suitable chemical ideas. Also, by organizing and identifying promising options, AI has gained major industry attention in recent years.
- Several stakeholders and producers in the United States are observed investing in heavy robotics in their production facilities, which is likely to reduce human errors and deliver better outputs during the forecast period.
- Moreover, the modern chemical hubs in the United States have seen investment in advanced AI-interpreted machinery to enhance quality control and observe exact chemical accuracy in the current period, as per the recent regional survey by our industry experts.
- For instance, on 3rd July 2026, Air Liquide invested a large amount in the development of an AI chip. Also, this large investment is around $170 million, as per the reports.
U.S. AI in Chemicals Market Growth Trends:
- The researchers and scientists in the chemical industry are using artificial intelligence as their daily working assistants. Also, by efficiently organizing experiments, investigating plant problems, and others, artificial intelligence has become the first choice of chemical manufacturers in the past few years.
- Artificial intelligence has also gained major attention from modern production facilities while providing exact plant conditions, energy use, and equipment signals, as producers are moving their AI expertise models from office work to their facilities in recent years.
- Ideas testing with the help of artificial intelligence is likely to drive strategic transformation and sectoral scalability in the upcoming years. Manufacturers and chemical researchers are actively testing their chemical ideas through automated laboratory systems, which save experimental costs while providing precise results.
Shift From Separate Tools to Connected Systems
The industry is actively observing a shift from separate AI tools toward connected AI systems. Also, projects are likely to have focused on one task, such as predicting equipment failure or studying a chemical formula. Moreover, the newer approach connects information sources and uses them together. Laboratory results, plant data, maintenance records, supply information, and business needs can become part of one decision process.
Sustainability Promotions and Alternatives
In the United States, the use of AI in the chemicals industry is increasingly promoting sustainability because the technology makes it possible for chemical manufacturers to make their processes more efficient in terms of energy consumption and raw materials used, as well as waste generation. Predictive analytics can identify the best operating conditions that help the companies to increase the yield while minimizing waste and reducing emissions. AI can also help in creating greener chemicals, catalysts, and production processes because the technology allows for a quick analysis of large amounts of data and identification of alternatives that have lower environmental impact.
Uses and Applications of AI in the Chemical Industry
The application of artificial intelligence (AI) in the field of chemistry is becoming more common, from research through production to quality assurance and operation. Key applications are as follows:
- Drug and Chemical Discovery: AI analyzes big data in chemistry to discover molecules and properties of molecules and speeds up the process of finding new substances and pharmaceutical compounds. In this way, laboratory experiments could be avoided.
- Process Optimization: AI supports the chemical industry in optimizing its production process by using real-time data obtained from the reactor and other machines. It will assist in identifying the best temperature, pressure, reaction time, and ratio of raw materials.
- Predictive Maintenance: Artificial intelligence-enabled tools measure how well machines perform and identify any anomalies in their performance patterns. In anticipation of any failure of equipment, manufacturers can schedule maintenance in order to avoid any unexpected downtime.
- Quality Control and Product Development: AI can identify quality differences and even predict the properties of the products through analysis of laboratory and production information. Through AI, it is possible to create chemicals having the properties that you want.
How Does Analytics Elevate Chemical Value?
The United States market for AI in chemicals can charge a premium price because of the added value of artificial intelligence-based solutions in such sectors as chemical discovery, optimization of processes, predictive maintenance, quality control, and automation of production. Premium prices are mainly for AI systems featuring machine learning capabilities, predictive analytics, digital twins, real-time process monitoring, and specific chemical datasets. The factors affecting pricing include deployment complexity, customization, data integration, cybersecurity, and technical support.
U.S. AI in Chemicals Industry Regulatory Landscape
| Country / Region | Regulatory Body | Key Regulations | Focus Areas |
| United States | EPA (Environmental Protection Agency) |
TSCA (Toxic Substances Control Act) EPA AI Compliance Plan & Strategy Executive Orders (EO 14179 / 14110) |
New Chemical Approvals: Accelerating pesticide and toxic substance evaluations. Environmental Compliance: Tracking emissions, hazardous wastes, and air quality using predictive modeling. |
U.S. AI in Chemicals Market Dynamics
Driver
Transforming Industrial Efficiency with AI Technology
The greater need for faster chemical work with more safety and accuracy is strengthening the foundation for future industry growth in recent years. Also, by handling larger amounts of data while providing plant precision, artificial intelligence has created its own presence in the United States chemical industry nowadays. Furthermore, several manufacturers are using AI in their research and development activities to maintain modern sustainability and eco-friendly standards, as per recent information from the region.
Restraint
Traditional Plant Suitability
The concern regarding AI implementation and the suitability of traditional plant setups is expected to hamper industry growth during the projected period. Also, several manufacturers have old setups and equipment where automation and robotics do not suit or are difficult to install, and the expense of new machinery and plant setups is a little bit challenging for the producers, as per our analysis.
Opportunity
Improvisation of Supply Chain Through Advancement
Usage of AI to improve the chemical supply chain is anticipated to create lucrative opportunities during the forecast period. In the upcoming years, research teams are expected to discover a useful material while production teams separately manage process conditions and quality. AI can connect these areas and help companies learn from both scientific and factory data. This can support faster product development, better formulations, lower waste, and more reliable production. Furthermore, using AI with digital twins and automated laboratories to test ideas before physical work begins. As companies build better data systems, AI is likely to become useful across the product journey, from early research to manufacturing, customer needs, and future product improvement as per expectations.
Segmental Insights
Offering Insights
The AI Software Segment Dominated the U.S. AI in Chemicals Market With 50.40% Market Share in 2025
The AI software segment dominated the market with a 50.40% share in 2025 and is expected to grow at a CAGR of 36.70% over the forecast period, akin to software is the main tool that actually performs AI work. Chemical companies can use software to study data, predict equipment problems, improve processes, support research, and help employees find information. Moreover, once the software is built and connected to company data, it can be used across many teams and locations. Software can also be updated as models improve, making it easier to add new functions over time.
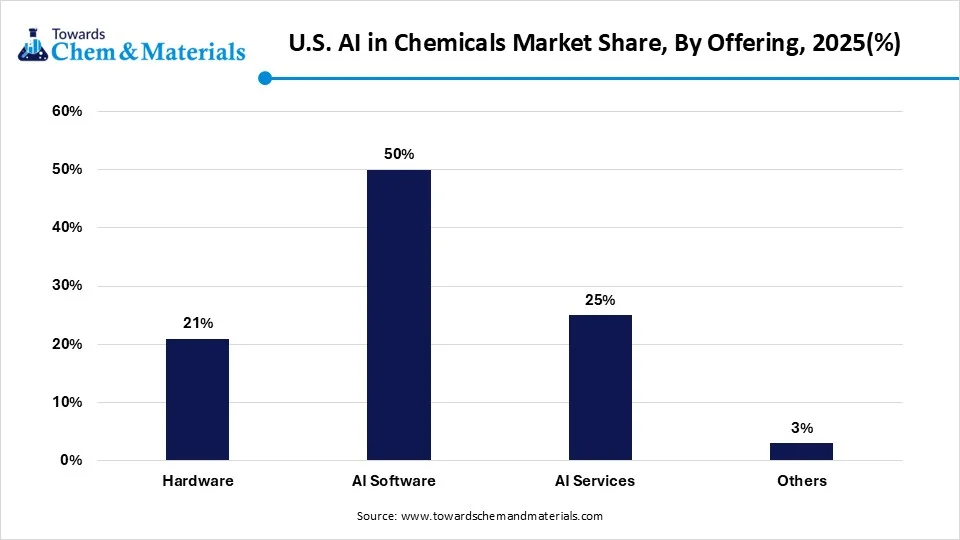
The AI services segment held a 25.10% market share in 2025 and is expected to have the fastest growth with a CAGR of 39.20% in the forecast period, due to many chemical companies will need help putting AI into real business operations. Moreover, buying software alone does not solve problems involving data cleaning, system connection, employee training, model testing, security, and ongoing support. Service providers can help companies choose useful applications and connect AI with existing factory and laboratory systems. They can also monitor models and improve them when business needs change.
U.S. AI in Chemicals Market Share, By Offering, 2025(%)
| By Offering / Solution | Market Share (%) |
| Hardware | 21% |
| AI Software | 50% |
| AI Services | 25% |
| Others | 3% |
Application Insights
The Production Optimization Segment Dominated the U.S. AI in Chemicals Market With 38.200% Market Share in 2025
The production optimization segment dominated the market with a 38.20% share in 2025 and is expected to grow at a CAGR of 34.60% over the forecast period, as chemical manufacturing depends heavily on stable processes, equipment performance, energy use, and product quality. AI is expected to study plant information and identify patterns linked to production problems. It can help teams adjust operating conditions, predict equipment issues, reduce waste, and use energy more efficiently. These benefits are directly connected with everyday factory performance, making production optimization a practical starting point for AI adoption. Companies can also measure results through output, downtime, quality, and resource use.
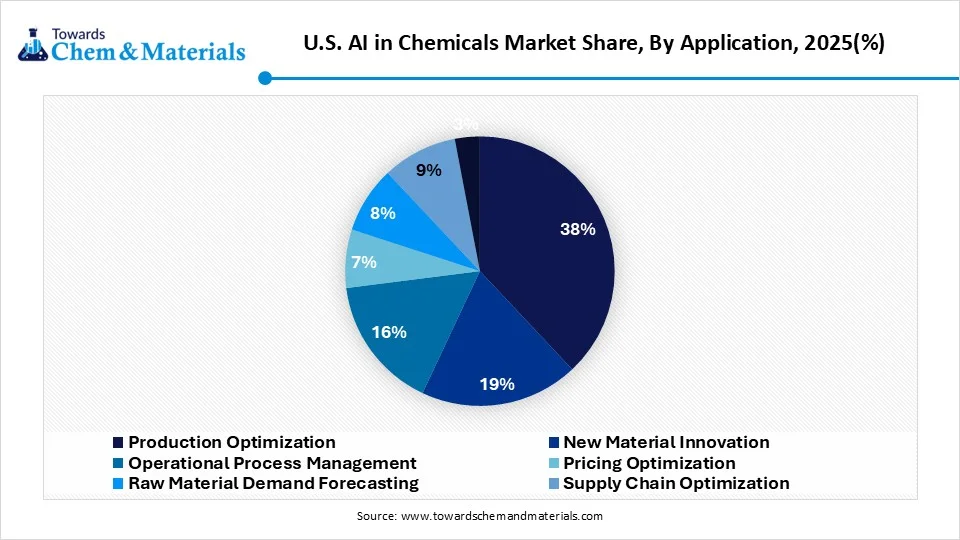
The new material innovation segment held an 18.60% market share in 2025 and is expected to have the fastest growth with a CAGR of 40.80% in the forecast period, because chemical companies need faster ways to create products with better performance. Traditional material development can require many experiments before a useful formula is found. AI can study existing chemical information and help researchers identify promising combinations before laboratory testing. This can reduce repeated experiments and shorten the path from an idea to a tested material.
U.S. AI in Chemicals Market Share,By Application, 2025(%)
| By Application | Market Share (%) |
| Production Optimization | 38% |
| New Material Innovation | 19% |
| Operational Process Management | 16% |
| Pricing Optimization | 7% |
| Raw Material Demand Forecasting | 8% |
| Supply Chain Optimization | 9% |
| Others | 3% |
End Use Insights
The Petrochemicals Segment Dominated the U.S. AI in Chemicals Market With 31.80% Market Share in 2025
The petrochemicals segment dominated the market with a 31.80% share in 2025 and is expected to grow at a CAGR of 33.90% over the forecast period, as it has large production systems, complex processes, and huge amounts of operational data. AI can support activities such as process monitoring, equipment maintenance, energy management, quality control, and production planning. Petrochemical plants also operate continuously, so even a small improvement can have an important business effect over time. The sector has many established digital systems and sensors, which give AI useful information to work with.
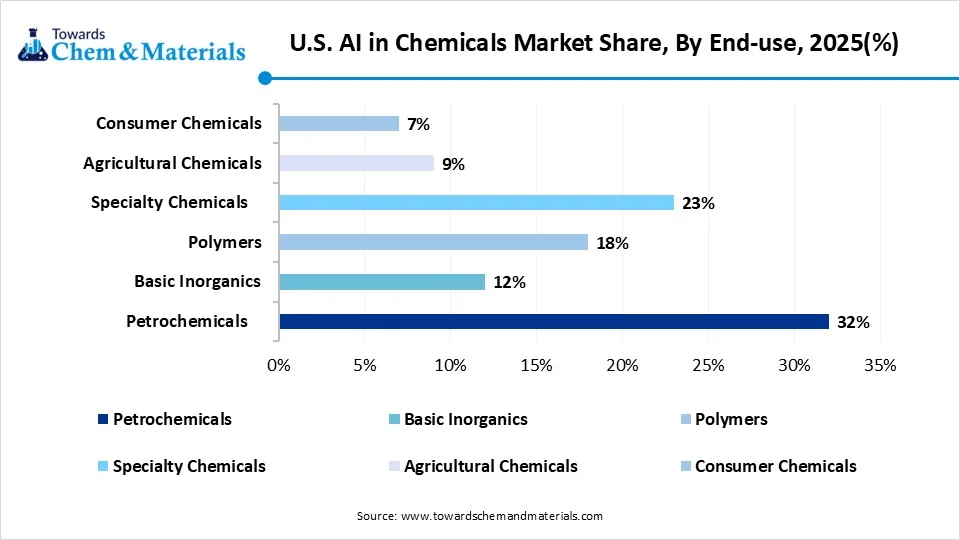
The speciality chemicals segment held 22.70% market share in 2025 and is expected to have the fastest growth with a CAGR of 39.80% in the forecast period, driven by its growth, which depends heavily on product differentiation and customer-specific solutions. Specialty chemicals often require careful formulation, performance testing, and application knowledge. AI can help researchers compare formulas, predict product properties, study customer needs, and reduce the number of physical experiments. It can also support faster development of materials for areas such as electronics, healthcare, coatings, advanced manufacturing, and sustainable products.
U.S. AI in Chemicals Market Share,By End-use, 2025(%)
| By End-use | Market Share (%) |
| Petrochemicals | 32% |
| Basic Inorganics | 12% |
| Polymers | 18% |
| Specialty Chemicals | 23% |
| Agricultural Chemicals | 9% |
| Consumer Chemicals | 7% |
Competitive Analysis
AI in the chemicals industry is moving from small experiments toward wider use across research, production, and business work globally. Moreover, companies are focusing on practical results rather than using AI only for testing. Industry activity shows strong attention to production optimization, digital process systems, new material discovery, and connected data.
- BASF is expanding its use of AI across several parts of its business. The company says it uses AI in production, engineering, research and development, and other activities. Its manufacturing sites use AI with sensor information to identify unusual conditions, while AI tools also support plant knowledge and research work.
- Siemens is building industrial AI around connected production data, automation, digital twins, and AI agents. In 2026, the company announced an expanded partnership with NVIDIA to develop an Industrial AI Operating System covering design, engineering, manufacturing, operations, and supply chains.
| Company | Company Type/Position | Major Headquarters | Geographic Presence | Offerings | Key Offering/Strength |
| American Innovations | Specialized Software & Hardware Provider | Austin, Texas | Global footprint; heavily concentrated across North American energy & chemical transit networks | CartoPac and PCS CPDM modules managing structural corrosion, pipe-to-soil potentials, and regulatory compliance. | Fusing digital voltmeters and rugged tablet data collection directly into compliance-ready asset management workflows. |
| iFactory App Omnipresent global scale | AppIndustrial AI & Data Analytics Startup | Houston, Texas | Nationwide across U.S. petrochemical and pipeline operators | Cloud-based AI Corrosion Analytics that ingest real-time CP sensor data, soil conditions, and historical inspection data | Continuous pipeline integrity modeling using machine learning to predict wall-loss acceleration and eliminate inspection gaps. |
| Microsoft (Azure). | Cloud Infrastructure & Enterprise AI Enabler | Redmond, Washington | Omnipresent global scale | Hosts third-party industrial digital twin environments and predictive asset integrity engines | Highly scalable AI building blocks, data lakehouses, and computing fabrics that ingest distributed IoT sensor telemetry assets |
Recent Developments
- In September 2026, The Inductive Bio introduced its latest AI chemistry assistant. Also, the assistant is called Indy and has a better capacity for medicinal chemist as per the company's claims. Furthermore, this assistant will work for the company's internal partner programs of company as per the information.
- In September 2026, Elsevier created a strategic collaboration with LG AI Research. The main motive behind the collaboration is to launch chemistry-specific AI vision technology, which is likely to be used in Elsevier’s content extraction, as per the published report.
Top players in the U.S. AI in Chemicals Market & Their Offerings:
Other Top Players Are
- Mstack
- AILILA
- AISchrödinger
- Atomwise
- Genesis Therapeutics
- Microsoft (Azure)
- NVIDIA Corporation
- IBM Corporation
U.S. AI in Chemicals Market Segments Covered:
By Solutions
- Hardware
- AI-enabled computing infrastructure
- Industrial sensors and edge devices
- GPU/AI accelerator systems
- AI Software
- Predictive analytics
- Process optimization software
- Chemical modeling and simulation
- Material discovery platforms
- Laboratory AI software
- Supply-chain analytics
- Pricing analytics
- AI Services
- Consulting
- System integration
- AI model development
- Implementation and deployment
- Training and support
- Others
- Managed AI platforms
- AI-enabled data services
- Customized AI solutions
By Application
- Production Optimization
- Process optimization
- Predictive process control
- Yield optimization
- Energy optimization
- New Material Innovation
- Molecular discovery
- Material property prediction
- Formulation optimization
- Virtual screening
- Operational Process Management
- Predictive maintenance
- Quality management
- Process monitoring
- Asset optimization
- Pricing Optimization
- Dynamic pricing
- Margin optimization
- Competitor-price analytics
- Raw Material Demand Forecasting
- Demand prediction
- Inventory optimization
- Procurement forecasting
- Supply Chain Optimization
- Logistics optimization
- Inventory planning
- Supplier optimization
- Distribution forecasting
- Others
- Regulatory compliance
- Environmental monitoring
- Customer analytics
- Workforce optimization
By End Use
- Petrochemicals
- Refining and feedstock optimization
- Olefins
- Aromatics
- Gas processing
- Basic Inorganics
- Chlor-alkali
- Industrial gases
- Acids and alkalis
- Inorganic salts
- Polymers
- Polyethylene
- Polypropylene
- PVC
- Engineering polymers
- Specialty Chemicals
- Performance chemicals
- Electronic chemicals
- Coatings and adhesives
- Specialty additives
- Agricultural Chemicals
- Fertilizers
- Crop-protection chemicals
- Herbicides
- Insecticides
- Consumer Chemicals
- Personal care chemicals
- Home-care chemicals
- Cleaning chemicals
- Consumer formulations
A Seven-Phase Framework
Our methodology is designed to be universally applicable across commodity chemicals, specialty chemicals, petrochemicals, construction chemicals, coatings, electronic chemicals, industrial gases, agrochemicals, water treatment chemicals, and performance materials. Each phase builds upon the last, creating a layered validation structure that minimizes estimation error and maximizes analytical confidence.
The framework ensures comprehensive market coverage, robust cross-validation, and reliable long-term forecasting — producing market estimates that withstand scrutiny from investors, regulators, and corporate strategy teams.

Seven-Phase Framework — Analytical Effort Distribution
Relative analytical effort allocated across each phase of the Chemicals & Materials research framework

Phase 1 - Secondary Research: Establishing the Foundation
Secondary research collects and evaluates publicly available information from authoritative sources, establishing the foundational understanding of market structure, value chain dynamics, competitive landscape, and end-use demand patterns. Every source is evaluated for credibility, recency, geographic relevance, and methodological soundness before inclusion.
Industry Associations
Sources include ACC, CEFIC, ICCA, JCIA, CPCIF, and SOCMA providing production volumes, consumption trends, capacity developments, and sustainability initiatives.
Company Disclosures
Annual reports, investor presentations, earnings transcripts, and regulatory filings reveal product portfolios, manufacturing footprints, capacity expansions, and revenue segmentation.
Government Databases
National statistical offices, customs authorities, environmental agencies, and industrial production databases provide verified statistics on output, trade flows, and regulatory compliance.
Trade Databases
UN Comtrade, ITC, Eurostat, and national customs authorities enable assessment of global product movement, import dependency, and export competitiveness across regions.
Our Secondary Research Sources
- Ministry of Chemicals and Fertilizers
- European Chemicals Agency
- United States Department of Energy
- Ministry of Industry and Information Technology
- Ministry of Economy Trade and Industry
- Ministry of Trade Industry and Energy
- National Institute of Standards and Technology
- Council of Scientific and Industrial Research
- Fraunhofer Society
- National Institute for Materials Science
Phase 2 — Supply-Side Assessment: Mapping Production Capabilities
Production Capacity Analysis
All major manufacturers are assessed for existing installed capacity, planned additions, expansions, new plant announcements, and technology adoption — mapped at global, regional, and country levels.
Capacity Utilization Adjustment
Installed capacity is adjusted using utilization rates based on demand conditions, feedstock availability, plant operating rates, maintenance schedules, and regulatory restrictions.
Manufacturer Revenue Analysis
Product-specific revenues, segment-level performance, regional distribution, average selling prices, and margin trends are evaluated to establish market value estimates.
Supply-Side Assessment — Capacity vs. Effective Production by Region
Illustrative comparison of installed capacity vs. effective production volume (after utilization rate adjustment) across major regions

Phase 3 — Demand-Side Assessment: Quantifying Chemical Consumption
Demand-side analysis quantifies chemical consumption across industries, applications, and geographies — identifying where and how chemicals are consumed throughout the value chain with precision.
End-Use Industry Analysis
Chemical demand is evaluated across automotive, construction, packaging, electronics, agriculture, healthcare, consumer goods, industrial manufacturing, energy and utilities, and water treatment. Industry output, production trends, and consumption intensity are analyzed to determine demand patterns.
Consumption Modeling
Demand is estimated using measurable indicators: kilograms per vehicle, kilograms per square meter of construction, dosage per cubic meter of water treated, kilograms per hectare of agricultural land, and kilograms per ton of manufactured products. Consumption factors are validated through industry publications and primary interviews.
Application Analysis
The market is segmented by application area to understand product performance requirements, formulation trends, technology adoption, customer preferences, and regulatory requirements improving demand accuracy and segmentation granularity.
Demand-Side Assessment — End-Use Industry Demand Distribution
Illustrative distribution of chemical & materials demand across key end-use industries

Phase 4 - Trade Flow Analysis: Balancing Regional Supply and Demand
Trade flow analysis reconciles regional supply and demand estimates through import and export data, identifying net supply positions, regional dependencies, and market imbalances. It serves as an independent validation layer that tests the consistency of supply-side and demand-side estimates.
Import Analysis
Import data is evaluated to determine volumes, source countries, product dependency, regional supply gaps, and pricing trends — identifying markets that rely heavily on external supply and where domestic production is insufficient to meet demand.
Export Analysis
Export assessments reveal production surplus, export competitiveness, regional manufacturing strength, and global market participation. Export patterns also help validate domestic production estimates and identify net exporting regions.
Apparent Consumption Model
Regional consumption is assessed using the standard apparent consumption formula:
Results identify net importing regions, net exporting regions, regional deficits, and surpluses — serving as an independent validation of supply and demand estimates.
Trade Flow Analysis — Net Supply Position by Region
Illustrative apparent consumption vs. domestic production across major regions — positive gap indicates net import dependency

Phase 5 — Primary Research: The Critical Validation Layer
Primary research tests and refines findings from secondary research through direct engagement with industry participants across the supply chain, demand side, and expert community. It captures intelligence that no database or published report can provide — the real-world experience of manufacturers, buyers, and specialists operating in the market.

Supply-Side Interviews
Conversations with chemical manufacturers, raw material suppliers, contract manufacturers, technology providers, and plant operators cover production trends, capacity utilization, pricing developments, technology shifts, and competitive dynamics.

Demand-Side Interviews
Engagement with OEMs, industrial consumers, procurement managers, distributors, formulators, and end-use manufacturers focuses on consumption trends, purchasing behavior, product substitution, demand outlook, and emerging applications.

Industry Expert Consultations
Additional interviews with industry consultants, independent experts, regulatory specialists, technical professionals, and research institutions provide deeper market context and validate key analytical assumptions.
Focus Areas of Primary Research:
Market Size & Forecast Validation
Revenue estimates, volume consumption, growth rates, forecast assumptions, regional demand.Supply Chain & Value Chain Assessment
Raw material sourcing, supply chain challenges, distribution networks, procurement practices.Production & Capacity Analysis
Manufacturing capacity, utilization rates, expansion projects, plant investments.Pricing & Cost Structure Analysis
Product pricing trends, feedstock costs, energy costs, margin pressures, pricing outlook.Competitive Landscape Assessment
Volume and value estimates confirmed to be fully consistent with one another before publicationInterview Volume by Market Scope
| Study Scope | Number of Interviews |
|---|---|
| Niche Market | 20 – 30 |
| Mid-Sized Market | 30 – 50 |
| Global Market | 50 – 80 |
| Highly Fragmented Market | 80 – 120 |
Interview Details:
Category : Manufacturers, Suppliers, Distributors, End Users, Experts/Associations
Average Duration : 30–60 Minutes
Interview Mode : Video calls, telephonic interviews, expert consultations
Interview Format : Structured / Semi-Structured questionnaire
Focus Areas of Primary Research:
Market Size & Forecast Validation :
Revenue estimates, volume consumption, growth rates, forecast assumptions, regional demand.
Supply Chain & Value Chain Assessment :
Raw material sourcing, supply chain challenges, distribution networks, procurement practices.
Production & Capacity Analysis :
Manufacturing capacity, utilization rates, expansion projects, plant investments.
Pricing & Cost Structure Analysis :
Product pricing trends, feedstock costs, energy costs, margin pressures, pricing outlook.
Competitive Landscape Assessment :
Market share, competitor positioning, strategic initiatives, partnerships, acquisitions.
Primary Research — Stakeholder Coverage by Category
Distribution of interview respondents across stakeholder categories (% share from PPT data)

Primary Research — Respondent Designation Profile
Seniority breakdown of interview respondents (% share from PPT data)

Primary Research — Geographic Coverage of Interviews
Regional distribution of primary research engagement (% share from PPT data)

Phase 6 — Data Triangulation and Market Validation
No single methodology is relied upon in isolation. Multiple independent estimation approaches are combined and reconciled to ensure consistency, accuracy, and analytical defensibility. Any material deviations between approaches are investigated and adjusted through additional validation cycles.
The final market size is derived through weighted triangulation of all validated methodologies. Any material deviations between approaches are investigated and adjusted through additional validation cycles. The outcome represents the most realistic assessment of the market based on available evidence and expert confirmation ensuring that volume and value estimates are fully consistent with one another.
Triangulation Framework — Input Contribution Weight
Relative weight each sizing input contributes to the final reconciled market estimate

Phase 7 — Forecast Modeling: Projecting Future Market Evolution
Forecasting evaluates the future trajectory of the market using a combination of quantitative indicators and qualitative assessments across economic, industry, and regulatory dimensions. Rather than simple extrapolation, each driver is independently modeled and integrated into a composite forecast.
Macroeconomic Indicators
GDP growth, industrial production, manufacturing output, construction activity, consumer spending, and capital investment form the quantitative foundation of long-term demand projections. These are applied at country, regional, and global levels.
Industry Growth Drivers
Urbanization, infrastructure development, industrialization, technological innovation, sustainability initiatives, and evolving product performance requirements are assessed at regional and industry levels — capturing both structural and cyclical demand drivers.
Capacity Expansion Analysis
Announced plant expansions, new manufacturing facilities, technology upgrades, and strategic investments are evaluated to determine future supply-demand dynamics and potential market tightness or oversupply situations.
Regulatory & Sustainability
Environmental regulations, chemical safety standards, emission reduction targets, circular economy initiatives, and sustainability requirements are incorporated as they often influence product adoption rates and market growth trajectories.
Scenario Forecast Range — Indexed Market Growth (Year 1–10)
Illustrative indexed growth trajectories across Base, Optimistic, and Pessimistic scenarios over a 10-year forecast horizon

Forecast Drivers — Relative Impact Score by Category
Impact score (0–100) of each driver type on chemicals & materials market forecast




Comments
Share your thoughts, ask a question, or provide feedback about this report.