
Steviol Glycoside Market Size Analysis Report 2035
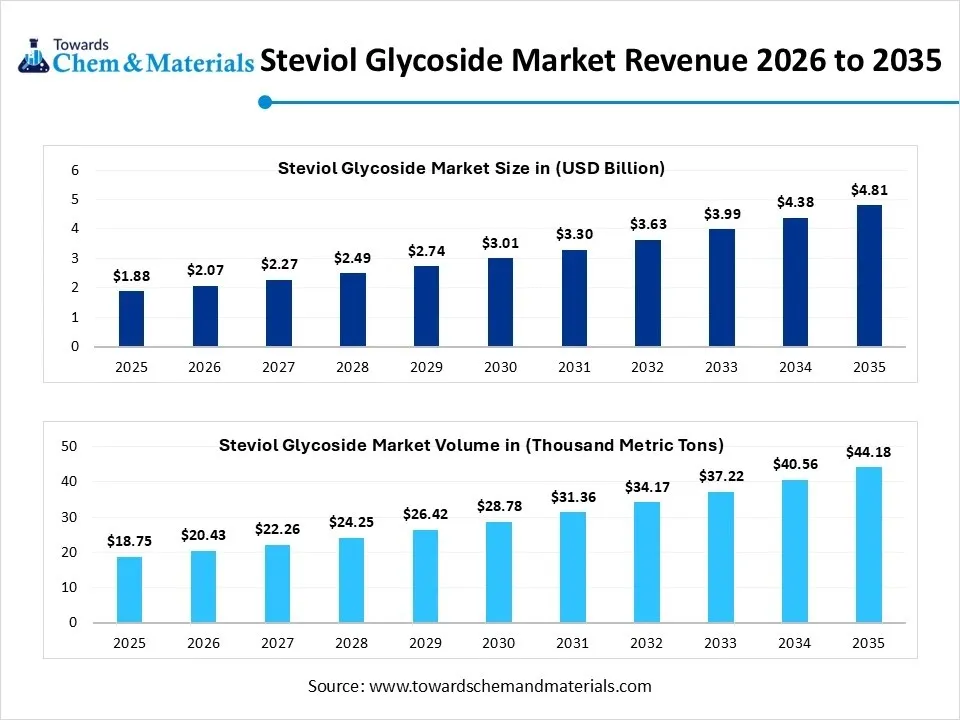
The steviol glycoside market size was valued at USD 1.88 billion in 2025, is estimated to reach USD 2.07 billion in 2026, and is projected to reach USD 4.81 billion by 2035, exhibiting a compound annual growth rate (CAGR) of 9.85% over the forecast period from 2026 to 2035.Asia Pacific dominated the steviol glycoside market with the largest revenue share of 42.0% in 2025 and is expected to grow at the fastest CAGR of 9.95% during the forecast period. The market is witnessing robust growth, driven by rising consumer demand for natural, zero-calorie sweeteners and sugar reduction and cleanable formulations across beverages, dairy, confectionery, tabletop sweeteners and nutritional products, as manufacturers continue to innovate with high-purity stevia extracts for improved taste and functionality. 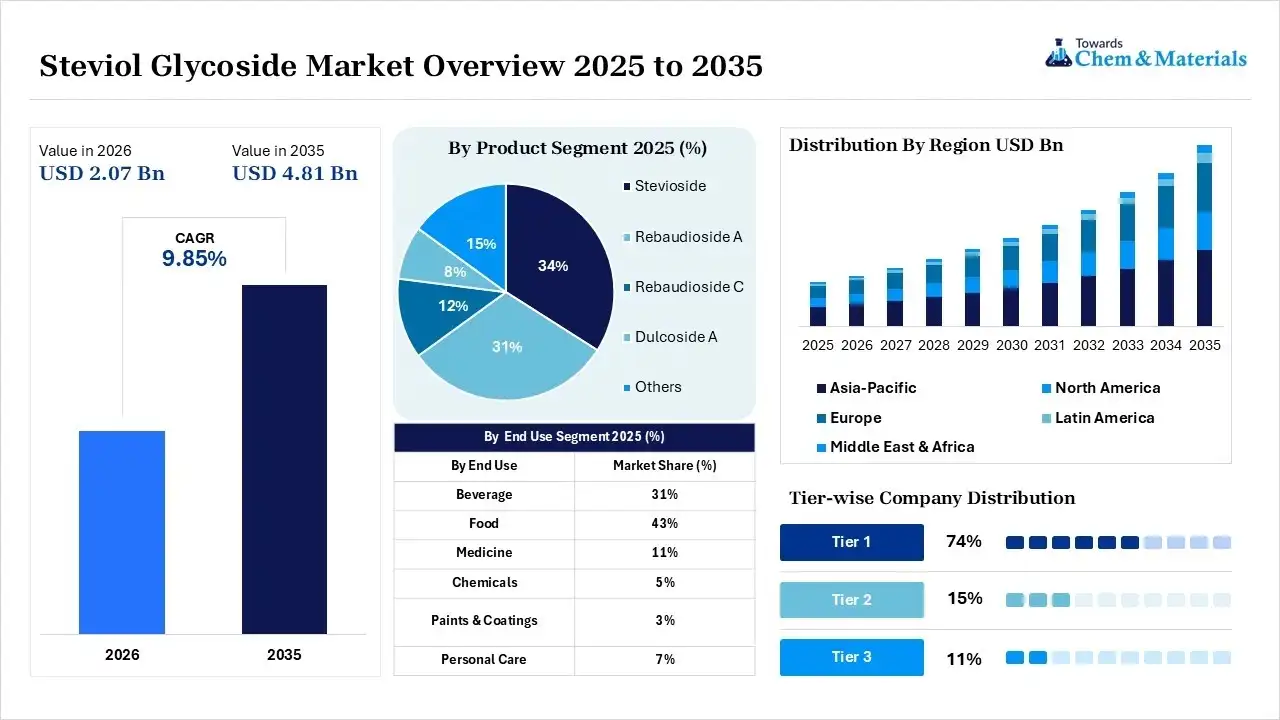
Market Highlights
- By region, Asia Pacific dominated the market with the largest share of 42.0% in 2025 and was expected to grow at the fastest CAGR of 10.8% during the projected period. The dominance of the region can be attributed to growing health awareness, which increases natural sweetener demand. China and India lead stevia cultivation and processing. Food and beverage manufacturing continues to expand.
- By region, North America held 24.00% market share in 2025. The growth of the region can be credited to sugar reduction strategies, which increase stevia adoption. Beverage innovation drives commercial demand. Consumer preference favors plant-based sweeteners.
- By product, the stevioside segment dominated the market with the largest share of 34.0% in 2025. Long-established commercial production supports widespread use. Cost-effective extraction encourages adoption. Food manufacturers continue utilizing stevioside formulations.
- By product, the rebaudioside A segment held a market share of 31.00% in 2025 and is expected to grow at the fastest CAGR of 11.6% during the projected period. High sweetness and a cleaner taste improve product acceptance. Beverage manufacturers are increasingly replacing sugar. Premium formulations expand global demand.
- By end-use, the food segment dominated the market with the largest share of 43.0% in 2025. Clean-label food products gain popularity. Manufacturers reformulate products with natural sweeteners. Bakery and dairy applications expand steadily.
- By end-use, the beverages segment held a market share of 31.00% in 2025 and is expected to grow at the fastest CAGR of 10.4% over the forecast period. Sugar reduction initiatives increase natural sweetener adoption. Functional beverages continue expanding globally. Consumer preference for low-calorie drinks strengthens demand.
According to Towards Chemicals and Materials Analytics and Consulting, the global steviol glycoside market volume was valued at 18.75 thousand metric tons in 2025 and is expected to surpass around 44.18 thousand metric tons by 2035, accelerating a compound annual growth rate (CAGR) of 8.95% over the forecast period from 2026 to 2035.
Market Overview
The steviol glycoside market is witnessing strong growth as food and beverage manufacturers increasingly replace conventional sugar and artificial sweeteners with naturally derived, zero-calorie alternatives. It is extracted from the leaves of Stevia rebaudiana. Stevia glycosides such as Reb A, Reb M and Reb D are widely used in soft drinks, dairy products, confectionery, bakery items, tabletop sweeteners, and nutritional products. Their ability to deliver sweetness without adding calories or significantly affecting blood glucose levels has made them an important ingredient in the global shift towards healthier eating habits and sugar reduction.
One of the major factors driving the market is the growing consumer preference for clean-label ingredients and plant-based formulations. Regulatory approvals across major markets have encouraged food manufacturers to expand the use of high-purity steviol glycosides in new product development. Additionally, technological advancements in purification and precision fermentation are improving the taste profile of stevia by enabling the commercial production of rare glycosides such as Reb M and Reb D, which closely mimic the taste of sugar while minimizing bitterness. These innovations are helping manufacturers overcome traditional formulation challenges and broaden stevia’s applications across beverages, dairy and functional foods.
- For instance, in September 2025, Cargill announced that its EverSweet® stevia sweetener was named a finalist in the 2025 Global Good Awards under the Game Changing Innovation of the Year category.(Source:www.cargill.com)
What Are the Key Growth Drivers Responsible for the Growth of the Steviol Glycoside Market?
The growth of the market is driven by the increasing health consciousness among the growing population and the growing demand for natural sweeteners over artificial ones. The demand for plant-based steviol drives the growth. Growing cases of diabetes and heart disease in the regions increase demand for the natural sugars or zero-calorie sweeteners, demand rises the demand. The growth is also driven by the growing food and beverages industry, which demands flavor enhancers and ingredients for various products, like bakery and confectionery, which demand natural sweeteners with increasing innovation in products, which drives the growth of the market. The growth is also driven by the technological advancements in processing and extraction for cost-effectiveness, which makes them more attractive to the manufacturers, driving the growth of the market and helping in the expansion of the market.
Market Trends
- The growing consumer demand for natural sweeteners, with changing preferences and lifestyle changes, drives the growth of the market.
- The growing health and wellness trends and rising awareness of the consumption of plant-based sweeteners and low-calorie sweeteners fuel the growth.
- The growing applications of steviol glycosides in various industries, like the food and beverages industry and the pharmaceutical industry, boost the growth of the market.
- The growing demand for clean-label and organic products by consumers boosts the demand for natural sweeteners, and boosts the market growth.
Report Scope
| Report Attributes | Details |
| Market Size in 2025 | USD 6.16 Billion |
| Expected Size by 2034 | USD 9.76 Billiion |
| Growth Rate from 2025 to 2034 | CAGR 5.25% |
| Base Year of Estimation | 2024 |
| Forecast Period | 2025 - 2034 |
| Dominant Region | Asia Pacific |
| Segment Covered | By Product, By End Use, By Region |
| Key Companies Profiled | PureCircle (a part of Ingredion), Cargill, Incorporated, Tate & Lyle, ADM (Archer Daniels Midland), GLG Life Tech Corp., HOWTIAN, Evolva Holding SA, Stevia First Corp., Sunwin Stevia International Inc, Kerry Group plc., FUJIFILM Wako Pure Chemical Corporation, GLSTEVIA, MORITA KAGAKU KOGYO CO., LTD., Zydus Wellness.com, Whole Earth Brands, Daepyung Co., Ltd. |
Supply Chain Analysis
Cultivation and Raw Leaf Procurement
- The cultivation of Stevia rebaudiana plants in countries such as China, Paraguay, Kenya and India. Farmers harvest and dry the stevia leaves, which are then supplied to extraction facilities.
- PureCircle by Ingredion: PureCircle partners with stevia growers worldwide to cultivate high-quality stevia varieties rich in desirable glycosides such as Reb M and Reb D.
- Other Key Players: Cargill, GLG Life Tech Corporation
Extraction and Steviol Glycoside Production
- Harvested stevia leaves undergo water extraction, purification, crystallization and drying to isolate high-purity steviol glycosides, including Reb A, Reb M and Reb D. Many manufacturers utilize precision fermentation to produce rare steviol glycosides with improved taste profiles and greater production efficiency.
- Cargill: through its EverSweet® platform, Cargill manufactures high-purity steviol glycosides using precision fermentation technology, delivering sugar-like taste while reducing dependence on leaf extraction alone.
- Other Key Players: Ingredion Incorporated, Tate & Lyle PLC
Purification, Quality Control and Regulatory Compliance
- Following extraction or fermentation, steviol glycosides undergo rigorous quality testing to verify purity, sweetness profile, microbiological safety and regulatory compliance. Products are tested to meet international food safety standards such as JECFA, FDA, EFSA, FSSC 22000 and ISO certifications, ensuring suitability for global food and beverage applications.
- Ingredion: The company maintains comprehensive quality assurance and food safety systems across its sweetener portfolio.
- Other Key Players: Cargill, Sweegen
Distribution and Logistics
- Finished steviol glycosides are supplied through ingredient distributors and directly to food and beverage manufacturers. Suppliers also provide formulation expertise, sweetness optimization, sensory evaluation, regulatory guidance and technical support to help customers reduce sugar while maintaining taste and product performance.
- Sweegen: It supplies next-generation stevia sweeteners globally while offering formulation support for beverages, dairy, bakery, confectionery and nutritional products to achieve optimal taste and sugar reduction.
- Other Key Players: Cargill, Igredion, Tate & Lyle PLC.
Market Opportunity
What Are the Key Growth Opportunities Responsible for the Growth of the Steviol Glycoside Market?
The key growth opportunity responsible for the growth of the market is the growing trend of a shift in preferences of the consumer for the option of natural sweeteners and growing awareness of consumers over health and wellness trends, which fuels the growth of the market due to increasing demand for their benefits. The growing prevalence of diabetes and obesity in the growing population is another driving factor that increases the demand for the market and helps in the expansion of the steviol glycoside market.
Market Challenge
The High Production Cost and Extraction Costs of The Product Are a Challenge That Hinders the Growth of The Market.
The extraction process of steviol glycosides from stevia leaves is a very complex and expensive process, which leads to and contributes to a higher final cost of the product, which affects the profitability margin, affecting and limiting the growth of the market and adoption by the consumers. The high product cost affects the adoption of the plant-based sweeteners and use of cheaper alternatives like conventional sugar, which is also a challenge and hinders the growth of the market.
Regional Insights
How did the Asia Pacific Dominate the Steviol Glycoside Market in 2025?
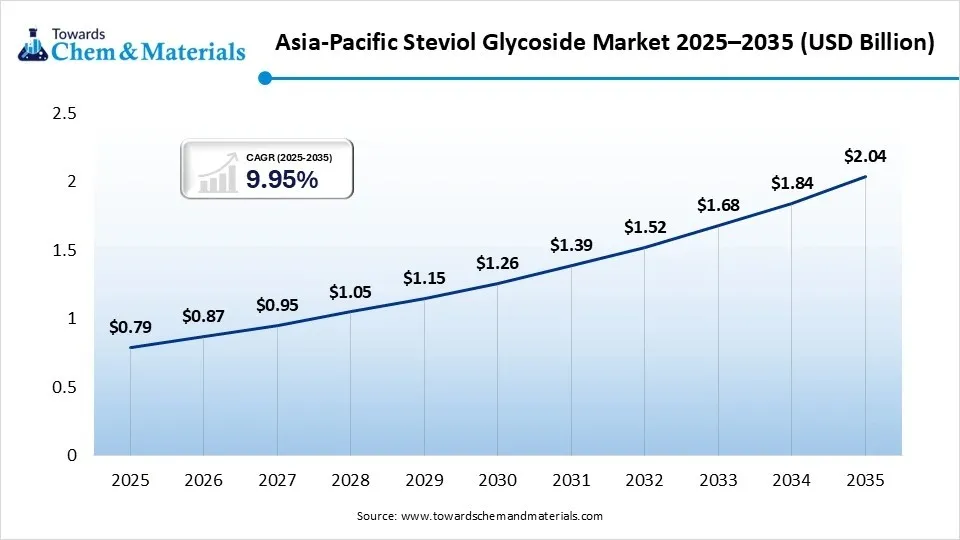
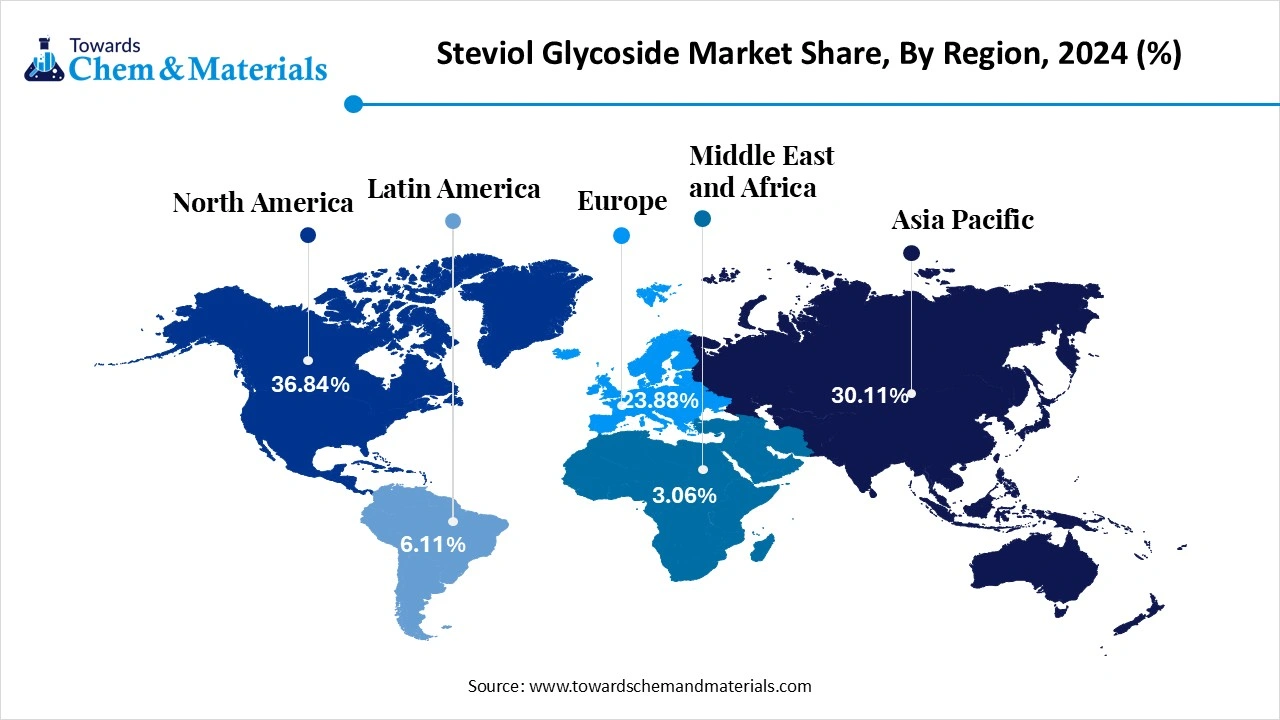
The Asia Pacific steviol glycoside market size was estimated at USD xx billion in 2025 and is projected to reach USD xx billion by 2035, growing at a CAGR of xx% from 2026 to 2035.Asia Pacific dominated the market with the largest share of 42.0% in 2025 and was expected to grow at the fastest CAGR of 10.8% over the forecast period. The dominance of the region can be attributed to growing health awareness, which increases natural sweetener demand. China and India lead stevia cultivation and processing. Food and beverage manufacturing continues to expand. The region is home to major stevia leaf producers and ingredient manufacturers, enabling an integrated supply chain from cultivation to high-purity steviol glycoside production.
China
- China is the largest producer and exporter of stevia leaves and steviol glycosides globally, making it the dominant country in the region. The country benefits from extensive stevia cultivation, well-established extraction facilities and strong export capabilities.
- Growing domestic demand for healthier beverages, dairy products and confectionery, coupled with investments in advanced purification technologies, is supporting market expansion.
India
- The market is emerging steadily due to increasing health consciousness, rising diabetic population and growing demand for natural sugar alternatives.
- Government initiatives promoting food processing and expanding nutraceutical and beverage industries are encouraging the use of steviol glycosides.
- Domestic cultivation of stevia and increasing investments in ingredient manufacturing are strengthening the country’s market position.
North America held 24.00% market share in 2025. The growth of the region can be credited to sugar reduction strategies that increase stevia adoption. Beverage innovation drives commercial demand. Consumer preference favors plant-based sweeteners. Rising demand for healthier beverages, sports nutrition, dairy alternatives, and functional foods is accelerating market growth.
United States
- The country has a strong demand for sugar-reduced beverages, dietary supplements and functional foods.
Major ingredient companies continue to invest in innovation in stevia solutions, including high-purity Reb M and Reb D produced through precision fermentation. - Consumer preference for natural ingredients and FDA approval of steviol glycosides continue to support widespread adoption.
Canada
- Consumers are increasingly seeking healthier food choices and natural sweeteners.
The expansion of clean-label food products, plant-based beverages and wellness-focused nutrition products is driving the market. - Supportive food regulations and rising demand for low-calorie formulations are contributing to market development.
Europe held a market share of 22.00% in 2025. The growth of the region can be credited to regulatory approval that supports broader food applications. Clean-label product development accelerates adoption. Functional food demand remains strong. Food manufacturers across the region are reformulating beverages, dairy products, confectionery and bakery items to comply with sugar reduction initiatives while maintaining taste and product quality.
Germany
- The country has a large food and beverage industry and high consumer awareness regarding healthy nutrition.
- Demand for natural sweeteners is increasing across soft drinks, dairy products and nutritional supplements as manufacturers focus on reducing sugar content.
France
- The market is driven by government efforts to reduce sugar consumption and increasing demand for organic and natural food ingredients.
- Beverage manufacturers and dairy producers are increasingly incorporating steviol glycosides into product formulations to meet evolving consumer preferences.
Latin America held a market share of 7.00% in 2025. The growth of the region can be credited to regional stevia cultivation, which supports market development. Food manufacturers expand natural sweetener usage. Export opportunities continue to increase. Favorable climatic conditions for stevia cultivation and growing investments in natural ingredient production are strengthening the regional market.
Brazil
- The country has a large food and beverage industry and increasing consumer demand for healthier sugar alternatives.
- Beverage manufacturers are actively reformulating products with natural sweeteners to meet changing dietary preferences.
- The country’s expanding nutraceutical and wellness sectors are supporting market growth.
Chile
- The country is witnessing progressive food labelling regulations and sugar reduction policies.
- Manufacturers are increasingly using steviol glycosides in beverages, dairy products and packaged foods to comply with nutritional standards.
The Middle East and Africa held a market share of 5.00% in 2025. The growth of the region can be credited to the rising demand for healthier food products, which supports adoption. Beverage manufacturers diversify sweetener portfolios. Urbanization increases the consumption of processed foods. Governments across the region are promoting healthier eating habits through nutrition initiatives, encouraging manufacturers to reduce sugar content in processed foods and beverages.
Saudi Arabia
- The country is witnessing increasing health awareness, a growing diabetic population and government initiatives encouraging healthier food consumption under Vision 2030.
- Food and beverage manufacturers are increasingly incorporating natural sweeteners into beverages, dairy products and nutritional products to meet evolving consumer preferences.
South Africa
- The country is witnessing rising demand for sugar-free beverages, functional foods and health-oriented consumer products.
- Increasing awareness of obesity and diabetes, combined with the country’s sugar reduction initiatives and expanding food processing industry, is encouraging manufacturers to adopt steviol glycosides.
Segmental Insights
Product Insights
The stevioside segment dominated the steviol glycoside market in 2025. They are the natural glycosides which are found in the stevia plant and are in rising demand due to their intense sweetness offered by the product, which makes it a popular choice for a non-caloric sweetener, increasing the demand for the market. The growth is also driven by the demand and its application in the food and beverage industries as a sugar substitute which drives the demand. The key properties that increase the demand are its sweetness, natural origin, use as a sugar substitute, and its potential health benefits for potential effects on blood glycose levels and insulin resistance, which drives the growth of the market.
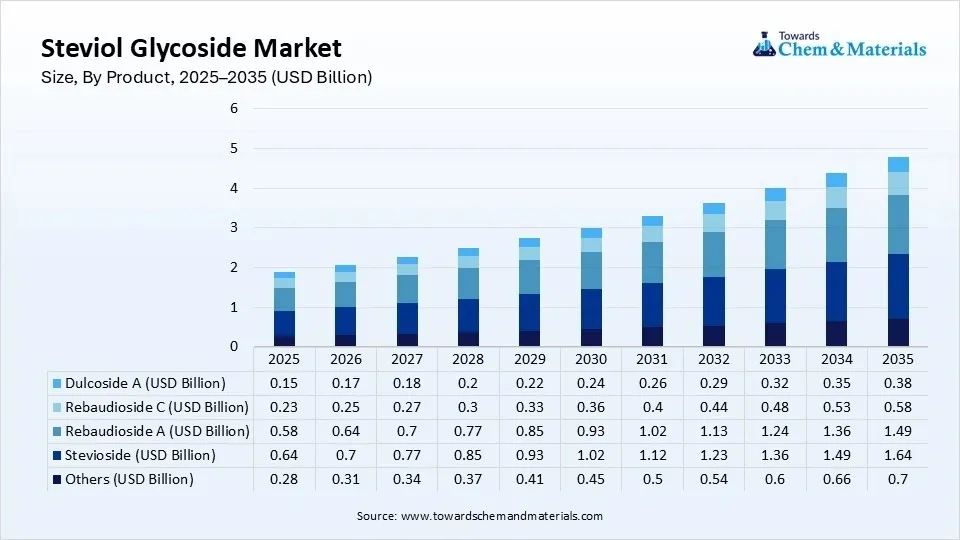
The rebaudioside A segment expects significant growth in the steviol glycoside market during the forecast period. It is a natural and non-caloric sweetener that is derived from the stevia plant. It is the most stable steviol glycoside, which is found in stevia and is used as a sugar substitute in the food and beverages industry, which drives the growth of the market. The growth of the market is also driven by the potential health benefits offered by the product, like stimulating insulin secretion from pancreatic beta-cells and having GLP-1 release effects on enteroendocrine cells, which drives the growth and expansion of the market.
Steviol Glycoside Market Share, By Product, 2025(%)
| By Product | Market Share (%) |
| Stevioside | 34% |
| Rebaudioside A | 31% |
| Rebaudioside C | 12% |
| Dulcoside A | 8% |
| Others | 15% |
End Use Insights
The food segment dominated the steviol glycoside market in 2025. The growth of the market is driven by the benefits offered by the product, like low calorie and high sweetness, although being a natural sweetener extracted from plants, which increases the demand. Common applications of the stevia include fruit and milk drinks, yogurts, confectioneries, desserts, and other products as well, which increases the demand from the industry. The stability offered by the steviol glycoside is a major factor for food processing, which requires high temperatures for processing, driving the demand for the product, which fuels the growth of the market and boosts the expansion of the market.
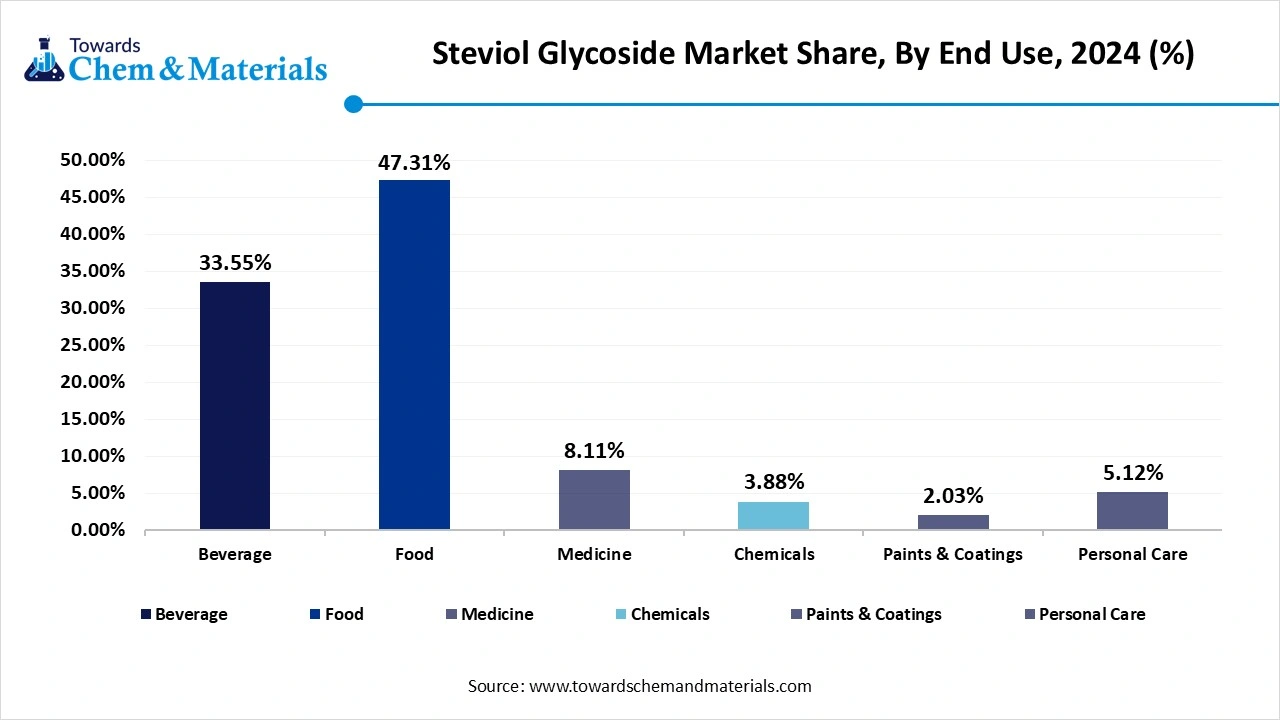
The beverage segment expects significant growth in the market during the forecast period. The growth of the market is driven by the growing demand from consumers and manufacturers due to growing preferences of the consumers for sugar-free, low-calorie, and plant-based drinks, which are a healthy alternative to carbonated sugary drinks, driving the demand and growth of the market. The product is in increasing demand due to the benefits offered, like low calorie content, potential health benefits, versatile applications, and natural origin, which increases the demand for the market and helps in the expansion of the market with varied applications.
Steviol Glycoside Market Share, By End Use, 2025(%)
| By End Use | Market Share (%) |
| Beverage | 31% |
| Food | 43% |
| Medicine | 11% |
| Chemicals | 5% |
| Paints & Coatings | 3% |
| Personal Care | 7% |
Recent Developments
- In December 2024, Belvoir Farm, an UK’s soft drink brand will introduce two new products: Non-Alcoholic Raspberry Margarita and No Added Sugar Blackcurrant and Apple Cordial. The brands No Added Sugar range, launched earlier this year, now features the new apple and blackcurrant flavor. (Source: foodbev.com)
- August 2024 saw the launch of SoPure Dorado, an unrefined golden stevia extract from Howtian, a global wholesale ingredient provider. This sweetener is plant-based, minimally processed, and calorie-free. According to the company, its designed for food and beverage consumers who prefer products that are as close to their natural state as possible. The innovation comes as the sweetener market evolves, with more consumers seeking ways to cut back on sugar.(Source: fooddive.com)
Top Companies List
- PureCircle (a part of Ingredion)
- Cargill, Incorporated
- Tate & Lyle
- ADM (Archer Daniels Midland)
- GLG Life Tech Corp.
- HOWTIAN
- Evolva Holding SA
- Stevia First Corp.
- Sunwin Stevia International Inc
- Kerry Group plc.
- FUJIFILM Wako Pure Chemical Corporation
- GLSTEVIA
- MORITA KAGAKU KOGYO CO., LTD.
- Zydus Wellness.com
- Whole Earth Brands
- Daepyung Co., Ltd.
Segments Covered
By Product
- Stevioside
- High Purity Stevioside
- Standard Stevioside
- Rebaudioside A
- Reb A 95%
- Reb A 97%
- Reb A 99%
- Rebaudioside C
- Standard Rebaudioside C
- High-Purity Rebaudioside C
- Dulcoside A
- Food Grade
- Pharmaceutical Grade
- Others
- Rebaudioside D
- Rebaudioside M
- Rebaudioside B
- Steviolbioside
By End Use
- Beverage
- Carbonated Soft Drinks
- Juices
- Dairy Beverages
- Energy & Sports Drinks
- Tea & Coffee
- Food
- Bakery & Confectionery
- Dairy Products
- Snacks
- Tabletop Sweeteners
- Frozen Desserts
- Medicine
- Nutraceuticals
- Pharmaceutical Formulations
- Dietary Supplements
- Chemicals
- Fermentation Media
- Specialty Ingredients
- Paints & Coatings
- Bio-based Coating Additives
- Functional Coatings
- Personal Care
- Oral Care Products
- Skin Care Products
- Cosmetics
By Region
- North America
- U.S.
- Canada
- Europe
- Germany
- UK
- France
- Italy
- Spain
- Sweden
- Denmark
- Norway
- Asia Pacific
- China
- Japan
- India
- South Korea
- Thailand
- Latin America
- Brazil
- Mexico
- Argentina
- Middle East and Africa (MEA)
- South Africa
- UAE
- Saudi Arabia
- Kuwait
A Seven-Phase Framework
Our methodology is designed to be universally applicable across commodity chemicals, specialty chemicals, petrochemicals, construction chemicals, coatings, electronic chemicals, industrial gases, agrochemicals, water treatment chemicals, and performance materials. Each phase builds upon the last, creating a layered validation structure that minimizes estimation error and maximizes analytical confidence.
The framework ensures comprehensive market coverage, robust cross-validation, and reliable long-term forecasting — producing market estimates that withstand scrutiny from investors, regulators, and corporate strategy teams.

Seven-Phase Framework — Analytical Effort Distribution
Relative analytical effort allocated across each phase of the Chemicals & Materials research framework

Phase 1 - Secondary Research: Establishing the Foundation
Secondary research collects and evaluates publicly available information from authoritative sources, establishing the foundational understanding of market structure, value chain dynamics, competitive landscape, and end-use demand patterns. Every source is evaluated for credibility, recency, geographic relevance, and methodological soundness before inclusion.
Industry Associations
Sources include ACC, CEFIC, ICCA, JCIA, CPCIF, and SOCMA providing production volumes, consumption trends, capacity developments, and sustainability initiatives.
Company Disclosures
Annual reports, investor presentations, earnings transcripts, and regulatory filings reveal product portfolios, manufacturing footprints, capacity expansions, and revenue segmentation.
Government Databases
National statistical offices, customs authorities, environmental agencies, and industrial production databases provide verified statistics on output, trade flows, and regulatory compliance.
Trade Databases
UN Comtrade, ITC, Eurostat, and national customs authorities enable assessment of global product movement, import dependency, and export competitiveness across regions.
Our Secondary Research Sources
- Ministry of Chemicals and Fertilizers
- European Chemicals Agency
- United States Department of Energy
- Ministry of Industry and Information Technology
- Ministry of Economy Trade and Industry
- Ministry of Trade Industry and Energy
- National Institute of Standards and Technology
- Council of Scientific and Industrial Research
- Fraunhofer Society
- National Institute for Materials Science
Phase 2 — Supply-Side Assessment: Mapping Production Capabilities
Production Capacity Analysis
All major manufacturers are assessed for existing installed capacity, planned additions, expansions, new plant announcements, and technology adoption — mapped at global, regional, and country levels.
Capacity Utilization Adjustment
Installed capacity is adjusted using utilization rates based on demand conditions, feedstock availability, plant operating rates, maintenance schedules, and regulatory restrictions.
Manufacturer Revenue Analysis
Product-specific revenues, segment-level performance, regional distribution, average selling prices, and margin trends are evaluated to establish market value estimates.
Supply-Side Assessment — Capacity vs. Effective Production by Region
Illustrative comparison of installed capacity vs. effective production volume (after utilization rate adjustment) across major regions

Phase 3 — Demand-Side Assessment: Quantifying Chemical Consumption
Demand-side analysis quantifies chemical consumption across industries, applications, and geographies — identifying where and how chemicals are consumed throughout the value chain with precision.
End-Use Industry Analysis
Chemical demand is evaluated across automotive, construction, packaging, electronics, agriculture, healthcare, consumer goods, industrial manufacturing, energy and utilities, and water treatment. Industry output, production trends, and consumption intensity are analyzed to determine demand patterns.
Consumption Modeling
Demand is estimated using measurable indicators: kilograms per vehicle, kilograms per square meter of construction, dosage per cubic meter of water treated, kilograms per hectare of agricultural land, and kilograms per ton of manufactured products. Consumption factors are validated through industry publications and primary interviews.
Application Analysis
The market is segmented by application area to understand product performance requirements, formulation trends, technology adoption, customer preferences, and regulatory requirements improving demand accuracy and segmentation granularity.
Demand-Side Assessment — End-Use Industry Demand Distribution
Illustrative distribution of chemical & materials demand across key end-use industries

Phase 4 - Trade Flow Analysis: Balancing Regional Supply and Demand
Trade flow analysis reconciles regional supply and demand estimates through import and export data, identifying net supply positions, regional dependencies, and market imbalances. It serves as an independent validation layer that tests the consistency of supply-side and demand-side estimates.
Import Analysis
Import data is evaluated to determine volumes, source countries, product dependency, regional supply gaps, and pricing trends — identifying markets that rely heavily on external supply and where domestic production is insufficient to meet demand.
Export Analysis
Export assessments reveal production surplus, export competitiveness, regional manufacturing strength, and global market participation. Export patterns also help validate domestic production estimates and identify net exporting regions.
Apparent Consumption Model
Regional consumption is assessed using the standard apparent consumption formula:
Results identify net importing regions, net exporting regions, regional deficits, and surpluses — serving as an independent validation of supply and demand estimates.
Trade Flow Analysis — Net Supply Position by Region
Illustrative apparent consumption vs. domestic production across major regions — positive gap indicates net import dependency

Phase 5 — Primary Research: The Critical Validation Layer
Primary research tests and refines findings from secondary research through direct engagement with industry participants across the supply chain, demand side, and expert community. It captures intelligence that no database or published report can provide — the real-world experience of manufacturers, buyers, and specialists operating in the market.

Supply-Side Interviews
Conversations with chemical manufacturers, raw material suppliers, contract manufacturers, technology providers, and plant operators cover production trends, capacity utilization, pricing developments, technology shifts, and competitive dynamics.

Demand-Side Interviews
Engagement with OEMs, industrial consumers, procurement managers, distributors, formulators, and end-use manufacturers focuses on consumption trends, purchasing behavior, product substitution, demand outlook, and emerging applications.

Industry Expert Consultations
Additional interviews with industry consultants, independent experts, regulatory specialists, technical professionals, and research institutions provide deeper market context and validate key analytical assumptions.
Focus Areas of Primary Research:
Market Size & Forecast Validation
Revenue estimates, volume consumption, growth rates, forecast assumptions, regional demand.Supply Chain & Value Chain Assessment
Raw material sourcing, supply chain challenges, distribution networks, procurement practices.Production & Capacity Analysis
Manufacturing capacity, utilization rates, expansion projects, plant investments.Pricing & Cost Structure Analysis
Product pricing trends, feedstock costs, energy costs, margin pressures, pricing outlook.Competitive Landscape Assessment
Volume and value estimates confirmed to be fully consistent with one another before publicationInterview Volume by Market Scope
| Study Scope | Number of Interviews |
|---|---|
| Niche Market | 20 – 30 |
| Mid-Sized Market | 30 – 50 |
| Global Market | 50 – 80 |
| Highly Fragmented Market | 80 – 120 |
Interview Details:
Category : Manufacturers, Suppliers, Distributors, End Users, Experts/Associations
Average Duration : 30–60 Minutes
Interview Mode : Video calls, telephonic interviews, expert consultations
Interview Format : Structured / Semi-Structured questionnaire
Focus Areas of Primary Research:
Market Size & Forecast Validation :
Revenue estimates, volume consumption, growth rates, forecast assumptions, regional demand.
Supply Chain & Value Chain Assessment :
Raw material sourcing, supply chain challenges, distribution networks, procurement practices.
Production & Capacity Analysis :
Manufacturing capacity, utilization rates, expansion projects, plant investments.
Pricing & Cost Structure Analysis :
Product pricing trends, feedstock costs, energy costs, margin pressures, pricing outlook.
Competitive Landscape Assessment :
Market share, competitor positioning, strategic initiatives, partnerships, acquisitions.
Primary Research — Stakeholder Coverage by Category
Distribution of interview respondents across stakeholder categories (% share from PPT data)

Primary Research — Respondent Designation Profile
Seniority breakdown of interview respondents (% share from PPT data)

Primary Research — Geographic Coverage of Interviews
Regional distribution of primary research engagement (% share from PPT data)

Phase 6 — Data Triangulation and Market Validation
No single methodology is relied upon in isolation. Multiple independent estimation approaches are combined and reconciled to ensure consistency, accuracy, and analytical defensibility. Any material deviations between approaches are investigated and adjusted through additional validation cycles.
The final market size is derived through weighted triangulation of all validated methodologies. Any material deviations between approaches are investigated and adjusted through additional validation cycles. The outcome represents the most realistic assessment of the market based on available evidence and expert confirmation ensuring that volume and value estimates are fully consistent with one another.
Triangulation Framework — Input Contribution Weight
Relative weight each sizing input contributes to the final reconciled market estimate

Phase 7 — Forecast Modeling: Projecting Future Market Evolution
Forecasting evaluates the future trajectory of the market using a combination of quantitative indicators and qualitative assessments across economic, industry, and regulatory dimensions. Rather than simple extrapolation, each driver is independently modeled and integrated into a composite forecast.
Macroeconomic Indicators
GDP growth, industrial production, manufacturing output, construction activity, consumer spending, and capital investment form the quantitative foundation of long-term demand projections. These are applied at country, regional, and global levels.
Industry Growth Drivers
Urbanization, infrastructure development, industrialization, technological innovation, sustainability initiatives, and evolving product performance requirements are assessed at regional and industry levels — capturing both structural and cyclical demand drivers.
Capacity Expansion Analysis
Announced plant expansions, new manufacturing facilities, technology upgrades, and strategic investments are evaluated to determine future supply-demand dynamics and potential market tightness or oversupply situations.
Regulatory & Sustainability
Environmental regulations, chemical safety standards, emission reduction targets, circular economy initiatives, and sustainability requirements are incorporated as they often influence product adoption rates and market growth trajectories.
Scenario Forecast Range — Indexed Market Growth (Year 1–10)
Illustrative indexed growth trajectories across Base, Optimistic, and Pessimistic scenarios over a 10-year forecast horizon

Forecast Drivers — Relative Impact Score by Category
Impact score (0–100) of each driver type on chemicals & materials market forecast




Comments
Share your thoughts, ask a question, or provide feedback about this report.