
Quantum Computing Materials Market Size Analysis Report 2034
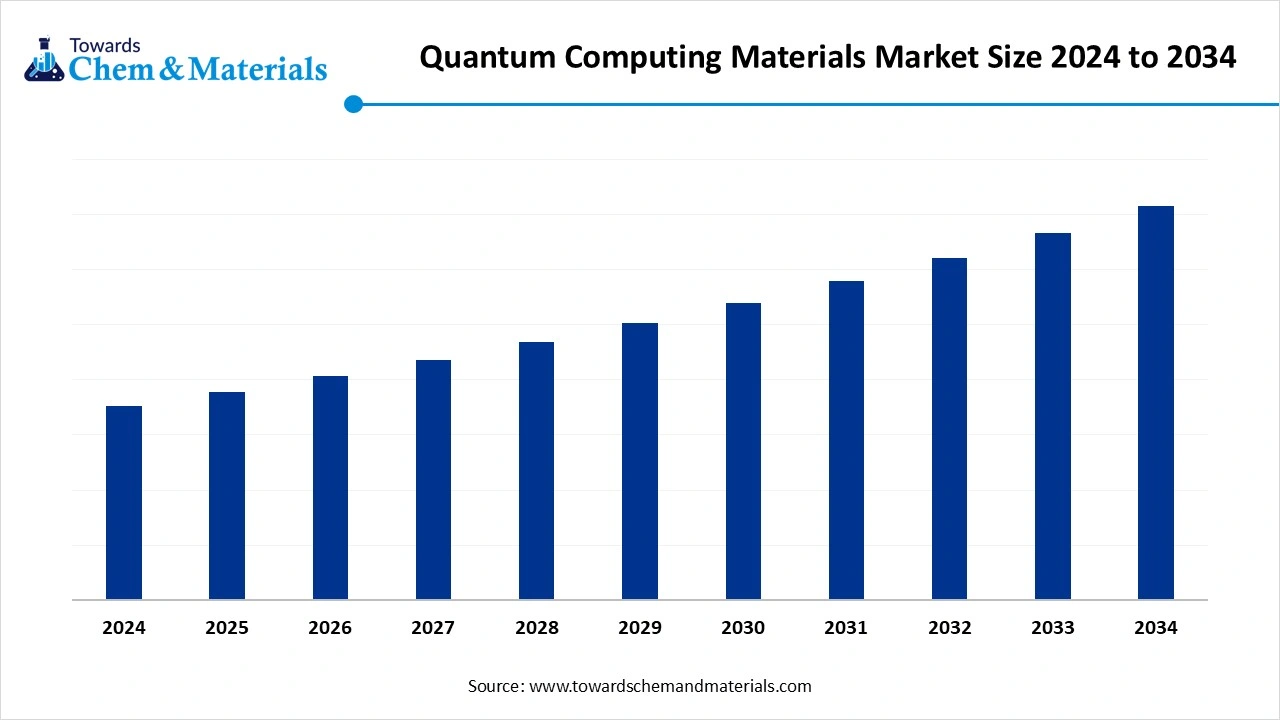
The quantum computing materials are rapidly emerging as a cornerstone of next-generation technologies, enabling complex computations through properties like entanglement and superposition. North America leads the market due to massive investments in quantum research, while Asia Pacific is expected to grow at the fastest pace fueled by an expanding finance sector. The growing advancements in quantum technology and the rising demand for computational power across various industries drive the market growth.
Key Takeaways
- By region, North America led the quantum computing materials market due to the growing investment in quantum computing research & development.
- By region, Asia Pacific is growing at the fastest CAGR in the market during the forecast period due to the rising finance sector.
- By material type, the superconducting materials segment dominated the market in 2024 due to the growing demand for MRI machines.
- By material type, the diamond-based materials segment is expected to grow at the fastest CAGR in the market during the forecast period due to the increasing demand from the aerospace industry.
- By application, the quantum processors segment led the market in 2024 due to the growing demand from drug discovery and financial sectors.
- By application, the quantum sensors segment is expected to grow at the fastest CAGR in the market during the forecast period due to the increasing demand for secure communications.
- By end-user industry, the defense & aerospace segment dominated the market in 2024 due to the growing demand for GPS-denied navigation.
- By end-user industry, the healthcare & lifesciences segment is expected to grow at the fastest CAGR in the market during the forecast period due to the increasing focus on the development of personalised medications.
Quantum Computing Materials Future of Next-Gen Computing
The quantum computing materials are substances used to develop qubits and exhibit quantum mechanical properties. These materials perform complex calculations like entanglement and superposition. The types of quantum computing materials include semiconducting materials, superconducting materials, photonic materials, topological insulators, diamond-based materials, 2D materials, trapped ion materials, and cryogenic materials. Quantum materials are used in the control and manipulation of classical electronics and other equipment.
They help to develop qubit fabrication and build quantum circuits. The growing government investment in research & development of quantum computing increases demand for quantum computing materials. The growing adoption of cloud-based quantum solutions in various industries increases demand for quantum computing materials. Factors like technological advancements in quantum computing, advanced computing needs in various sectors, and the growing adoption of quantum computing in industries like healthcare & finance contribute to the growth of the quantum computing materials market.
- In June 2025, South Korea to invest £380 million over eight years in quantum computing. The investment aims to advance the capabilities of national quantum technology.(Source: quantumzeitgeist.com )
- South Korea exported 2,012 shipments of niobium.(Source: www.volza.com)
- South Korea exported 704 shipments of silicon nitride.(Source: www.volza.com)
Growing Finance Sector Propels the Market Growth
The growing finance sector in various regions increases the demand for quantum computing materials for various applications. The increasing fraudulent activities fuel demand for quantum computing to analyze transaction patterns. The growing demand for portfolio optimization for lowering risk and higher returns increases the adoption of quantum computing. The presence of a vast amount of data in the finance industry increases demand for quantum computing to perform complex calculations for financial modelling, risk assessment, and portfolio management.
The increasing demand for cryptographic security in financial transactions leads to higher adoption of quantum computing. The financial applications like credit origination, treasury management, credit onboarding, trading & asset management, and risk management use quantum computing materials. The growing finance sector is a key driver for the growth of the quantum computing materials market.
- In September 2024, HSBD developed quantum-safe technology for tokenised gold. The technology uses post-quantum cryptography and enhances security in financial transactions.(Source: fintechmagazine.com)
Market Trends
- High-Performance Computing Demand: The growing demand for high-performance computing to solve complex problems in various industries like logistics, pharmaceuticals, and aerospace increases demand for quantum computing materials.
- Technological Advancements: The ongoing technological advancements in quantum hardware, like minimizing error rate and increasing qubit coherence, help in the market growth. The advancements in quantum algorithms enhance capabilities in various applications like material science and drug discovery.
- Growing Investments: The increasing private sector and government investments in the research and development of quantum computing accelerate the innovation of new systems, materials, and components development. The heavy investment by companies enhances applications in areas like machine learning, cryptography, and sensing.
Report Scope
Market Opportunity
The Expanding Healthcare Sector Unlocks Opportunity for Market Growth
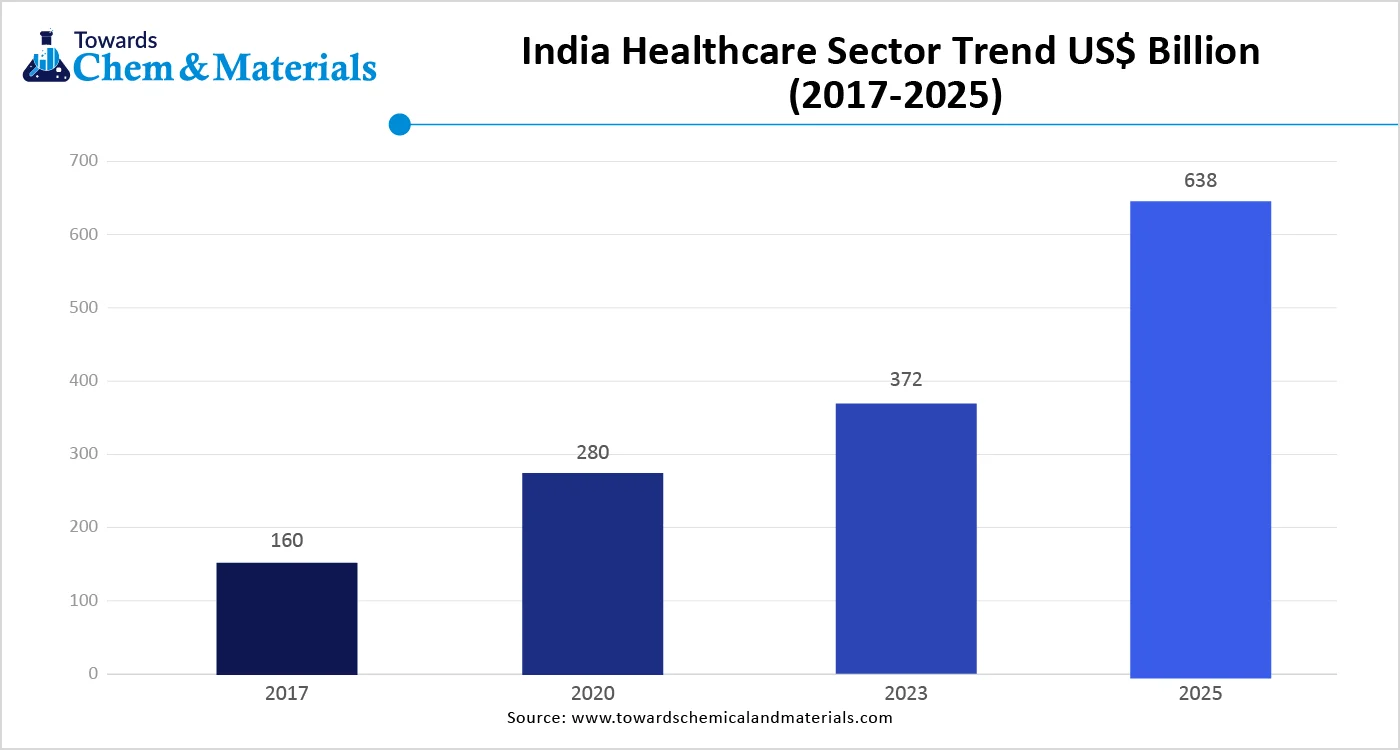
The growing expansion of the healthcare sector in various regions increases the adoption of quantum computing materials for various applications. The growing focus on accelerating the drug discovery process increases demand for quantum computing materials like quantum sensors and quantum processors. The increasing development of personalised medicine according to individual genetic profiles increases demand for quantum computing materials for handling vast datasets.
The rising demand for medical imaging in various diseases, like cancer and tumors, fuels demand for quantum computing materials in data processing. The growing focus on the improvement of diagnostic tools increases demand for quantum sensors. The increasing demand for optimization of radiation therapy leads to a higher demand for quantum computing to reduce damage to healthy tissue. The growing expansion of the healthcare sector creates an opportunity for the growth of the quantum computing materials market.
Market Challenge
High Cost Limits Expansion of Quantum Computing Materials Market
Despite several benefits of quantum computing materials in various sectors, the high cost restricts the market growth. Factors like complex infrastructure, the requirement of specialized materials, and fabrication techniques are responsible for the high cost. The requirement of specialized materials like superconducting, semiconducting, topological insulators, and many more is expensive. The need for advanced fabrication techniques like lithography and other methods increases the cost. The requirement of a cryogenic system for quantum computing architectures is expensive. The need for high investment in research & development of quantum computing materials restrains market growth. High cost hampers the growth of the quantum computing materials market.
Regional Insights
How North America Dominates the Quantum Computing Materials Market?
North America dominated the quantum computing materials market with a share of 38%. The extensive public & private investment in quantum computing research & development helps in the market growth. The growing innovations in areas like quantum applications, hardware, and software increase demand for quantum computing materials. The presence of well-established infrastructure and the growing adoption of advanced technologies increases the demand for quantum computing materials. The growth in areas like drug discovery, cryptography, and optimization increases the adoption of quantum computing materials. The presence of key players like Microsoft, IBM, and Google drives the overall growth of the market.
United States Quantum Computing Materials Market Trends
The United States is a major contributor to the quantum computing materials market. The strong government support through various initiatives for advanced quantum technologies helps the market growth. The well-established infrastructure for quantum technologies increases demand for quantum computing materials. The heavy investment in research & development of quantum computing helps the market growth. The growing demand across various industries like finance, pharmaceuticals, and aerospace supports the market growth.
- In April 2025, IBM to invest $150 billion in the United States to aid the quantum push over the next five years. The investment is used to expand the manufacturing of mainframes and quantum computers in the United States for handling critical applications and vast data.(Source: www.reuters.com)
- The United States exported 140 shipments of niobium.(Source: www.volza.com)
Why Asia Pacific is Growing at the Fastest Rate in the Quantum Computing Materials Market?
Asia Pacific experiences the fastest growth in the market during the forecast period. The growing adoption of cloud-based technologies and the rising smartphone penetration in the region increase the demand for quantum computing materials. The extensive investment in the research & development of quantum computing helps in the market growth. The growing finance sector increases demand for quantum computing for various applications like fraud detection, financial modelling, and risk analysis. The growing applications like financial modelling, drug discovery, and materials science increase demand for quantum computing materials. The increasing demand for high-performance computing in various sectors, like logistics and pharmaceuticals, drives the market growth.
What are the Trends for the Quantum Computing Materials Market in China?
China is a key contributor to the quantum computing materials market. The government investment in research & development of quantum computing materials helps the market growth. The growing cryptography and materials science increase the demand for quantum computing materials. The growing innovation in quantum communication technology increases demand for quantum computing materials. The growing large-scale quantum hardware development supports the growth of the quantum computing materials market.
- China exported 105 shipments of niobium.(Source: www.volza.com)
- China exported $93.4M of calcium in 2023.(Source: oec.world)
Segmental Insights
Material Type Insights
How Superconducting Materials Held the Largest Share of the Quantum Computing Materials Market?
The superconducting materials segment led the quantum computing materials market in 2024 with a share of 26%. The growing demand for transmon qubits in the development of large-scale quantum computers increases the demand for quantum computing materials. The growing applications in areas like storage, MRI machines, and energy transmission help the market growth. Superconducting materials minimize energy loss and have zero electrical resistance. The niobium is growing in the superconducting materials, and they utilized to create qubits. The leading players like IBM and Google drive the overall growth of the market.
The diamond-based materials segment is the fastest-growing in the market during the forecast period. The strong companies and research institutions' investment in diamond-based materials helps the market growth. The growing development of qubits increases demand for diamond-based materials. These materials are chemically inert and possess high thermal conductivity. The growing quantum applications increase the demand for diamond-based materials. The increasing demand across various industries like aerospace, optics, and satellite technology supports the overall growth of the market.
Application Insights
Why did Quantum Processors Dominate the Quantum Computing Materials Market?
The quantum processors segment dominated the quantum computing materials market in 2024 with a share of 35%. The growing production of quantum computers to solve complex calculations & execute quantum algorithms increases the demand for quantum processors. The increasing innovation in quantum processors, like scalable architectures, the development of stable qubits, and error correction techniques, helps in the market growth. The growing demand for quantum processors in tackling complex problems in applications like material science, logistics, drug discovery, and finance drives the overall growth of the market.
The quantum sensors are experiencing the fastest growth in the market during the forecast period. The increasing demand for secure communication in government and various industries to handle sensitive data increases the demand for quantum sensors. The growing advancements in quantum technologies like atomic magnetometers and atomic clocks are increasing the development of quantum sensors. The growing development of autonomous driving vehicles increases the adoption of quantum sensors. The sensors are small in size and integrate into complex systems. The growing demand for quantum sensors in healthcare for medical imaging, and GPS-denied navigation in aerospace & defense supports the overall growth of the market.
End-User Insights
Which End-User Industry Dominated the Quantum Computing Materials Market in 2024?
The defense & aerospace segment led the quantum computing materials market in 2024 with a share of 28%. The growing demand for optimizing logistics, aircraft design, and flight routes in the defense & aerospace sector increases demand for quantum computing materials. The growing focus on securing sensitive communication and data increases the focus on the development of quantum-resistant cryptography, which increases the adoption of quantum computing materials. The growing demand for GPS-denied navigation in the defense industry increases the demand for quantum computing materials for atomic clocks, gravimeters, inertial measurement units, and magnetometers. The growing demand for aerospace design optimization for satellite trajectories and radar system capabilities drives the market growth.
The healthcare & life sciences segment is the fastest growing in the market during the forecast period. The growing development of targeted drugs for diseases like Parkinson’s, Alzheimer’s, and many more increases demand for quantum computing materials. The increasing demand for medical imaging in conditions like neurodegenerative diseases and cancer helps the market growth. The growing demand for personalised medicine for patients’ unique biological profiles increases demand for quantum computing materials. The increasing focus on optimizing clinical trials and accelerating drug discovery supports the overall market growth.
Recent Developments
- In April 2025, QpiAI launched a 25-Qubit superconducting system under India’s National Quantum Mission. The system includes three main components: AI-assisted hybrid optimization tools, quantum processors built on superconducting qubits, and a Quantum-HPC software stack. It is designed to be used in sectors like material design, climate modelling, drug discovery, and supply chain logistics.(Source: thequantuminsider.com)
- In March 2025, Empa launched the CarboQuant Lab to build carbon-based quantum materials. The company aims to advance practical applications & fundamental understanding and develop devices that operate at room temperature.(Source: quantumcomputingreport.com)
- In August 2024, Quantum Computing Luminaries launched Qolab to develop high-quality superconducting qubits. The company focuses on developing advanced fabrication processes and improving qubit coherence.(Source: thequantuminsider.com)
Top Companies List
- IBM Corporation
- D-Wave Systems Inc.
- Intel Corporation
- Google LLC (Alphabet Inc.)
- Rigetti Computing
- IonQ Inc.
- Pasqal
- Xanadu Quantum Technologies
- QCI (Quantum Computing Inc.)
- Oxford Instruments
- NKT Photonics
- Bluefors Cryogenics
- Linde plc
- Toptica Photonics AG
- ColdQuanta (Infleqtion)
- AQT (Alpine Quantum Technologies)
- Zurich Instruments
- SeeQC
- Universal Quantum
- Element Six
Segments Covered
By Material Type
- Superconducting Materials
- Niobium
- Yttrium Barium Copper Oxide (YBCO)
- Bismuth Strontium Calcium Copper Oxide (BSCCO)
- Magnesium Diboride (MgBâ‚‚)
- Semiconducting Materials
- Silicon
- Germanium
- Gallium Arsenide (GaAs)
- Topological Insulators
- Bismuth Selenide (Bi₂Se₃)
- Antimony Telluride (Sb₂Te₃)
- Photonic Materials
- Indium Phosphide (InP)
- Silicon Nitride (Si₃N₄)
- Lithium Niobate (LiNbO₃)
- Trapped Ion Materials
- Ytterbium
- Calcium
- Diamond-based Materials
- High-purity synthetic diamond (for NV centers)
- Cryogenic Materials
- Liquid Helium
- Cryocoolers
- 2D Materials
- Graphene
- Transition Metal Dichalcogenides (TMDs)
By Application
- Quantum Processors
- Superconducting Qubits
- Trapped Ion Qubits
- Photonic Qubits
- Topological Qubits
- Quantum Memory
- Rare Earth Doped Crystals
- Diamond NV Centers
- Quantum Interconnects
- Optical Fibers
- Superconducting Waveguides
- Quantum Sensors
- Magnetometers
- Gravimeters
- Cryogenics & Cooling Systems
- Dilution Refrigerators
- Pulse Tube Cryocoolers
- Control Electronics & Packaging
- Material-optimized PCBs
- RF shielding materials
By End-User Industry
- Defense & Aerospace
- Healthcare & Life Sciences
- Banking & Financial Services
- Chemicals & Materials Discovery
- Automotive & Transportation
- Academia & Research Institutions
- IT & Telecommunication
- Others
By region
- North America
- U.S.
- Canada
- Europe
- Germany
- UK
- France
- Italy
- Spain
- Sweden
- Denmark
- Norway
- Asia Pacific
- China
- Japan
- India
- South Korea
- Thailand
- Latin America
- Brazil
- Mexico
- Argentina
- Middle East & Africa
- South Africa
- UAE
- Saudi Arabia
- Kuwait
A Seven-Phase Framework
Our methodology is designed to be universally applicable across commodity chemicals, specialty chemicals, petrochemicals, construction chemicals, coatings, electronic chemicals, industrial gases, agrochemicals, water treatment chemicals, and performance materials. Each phase builds upon the last, creating a layered validation structure that minimizes estimation error and maximizes analytical confidence.
The framework ensures comprehensive market coverage, robust cross-validation, and reliable long-term forecasting — producing market estimates that withstand scrutiny from investors, regulators, and corporate strategy teams.

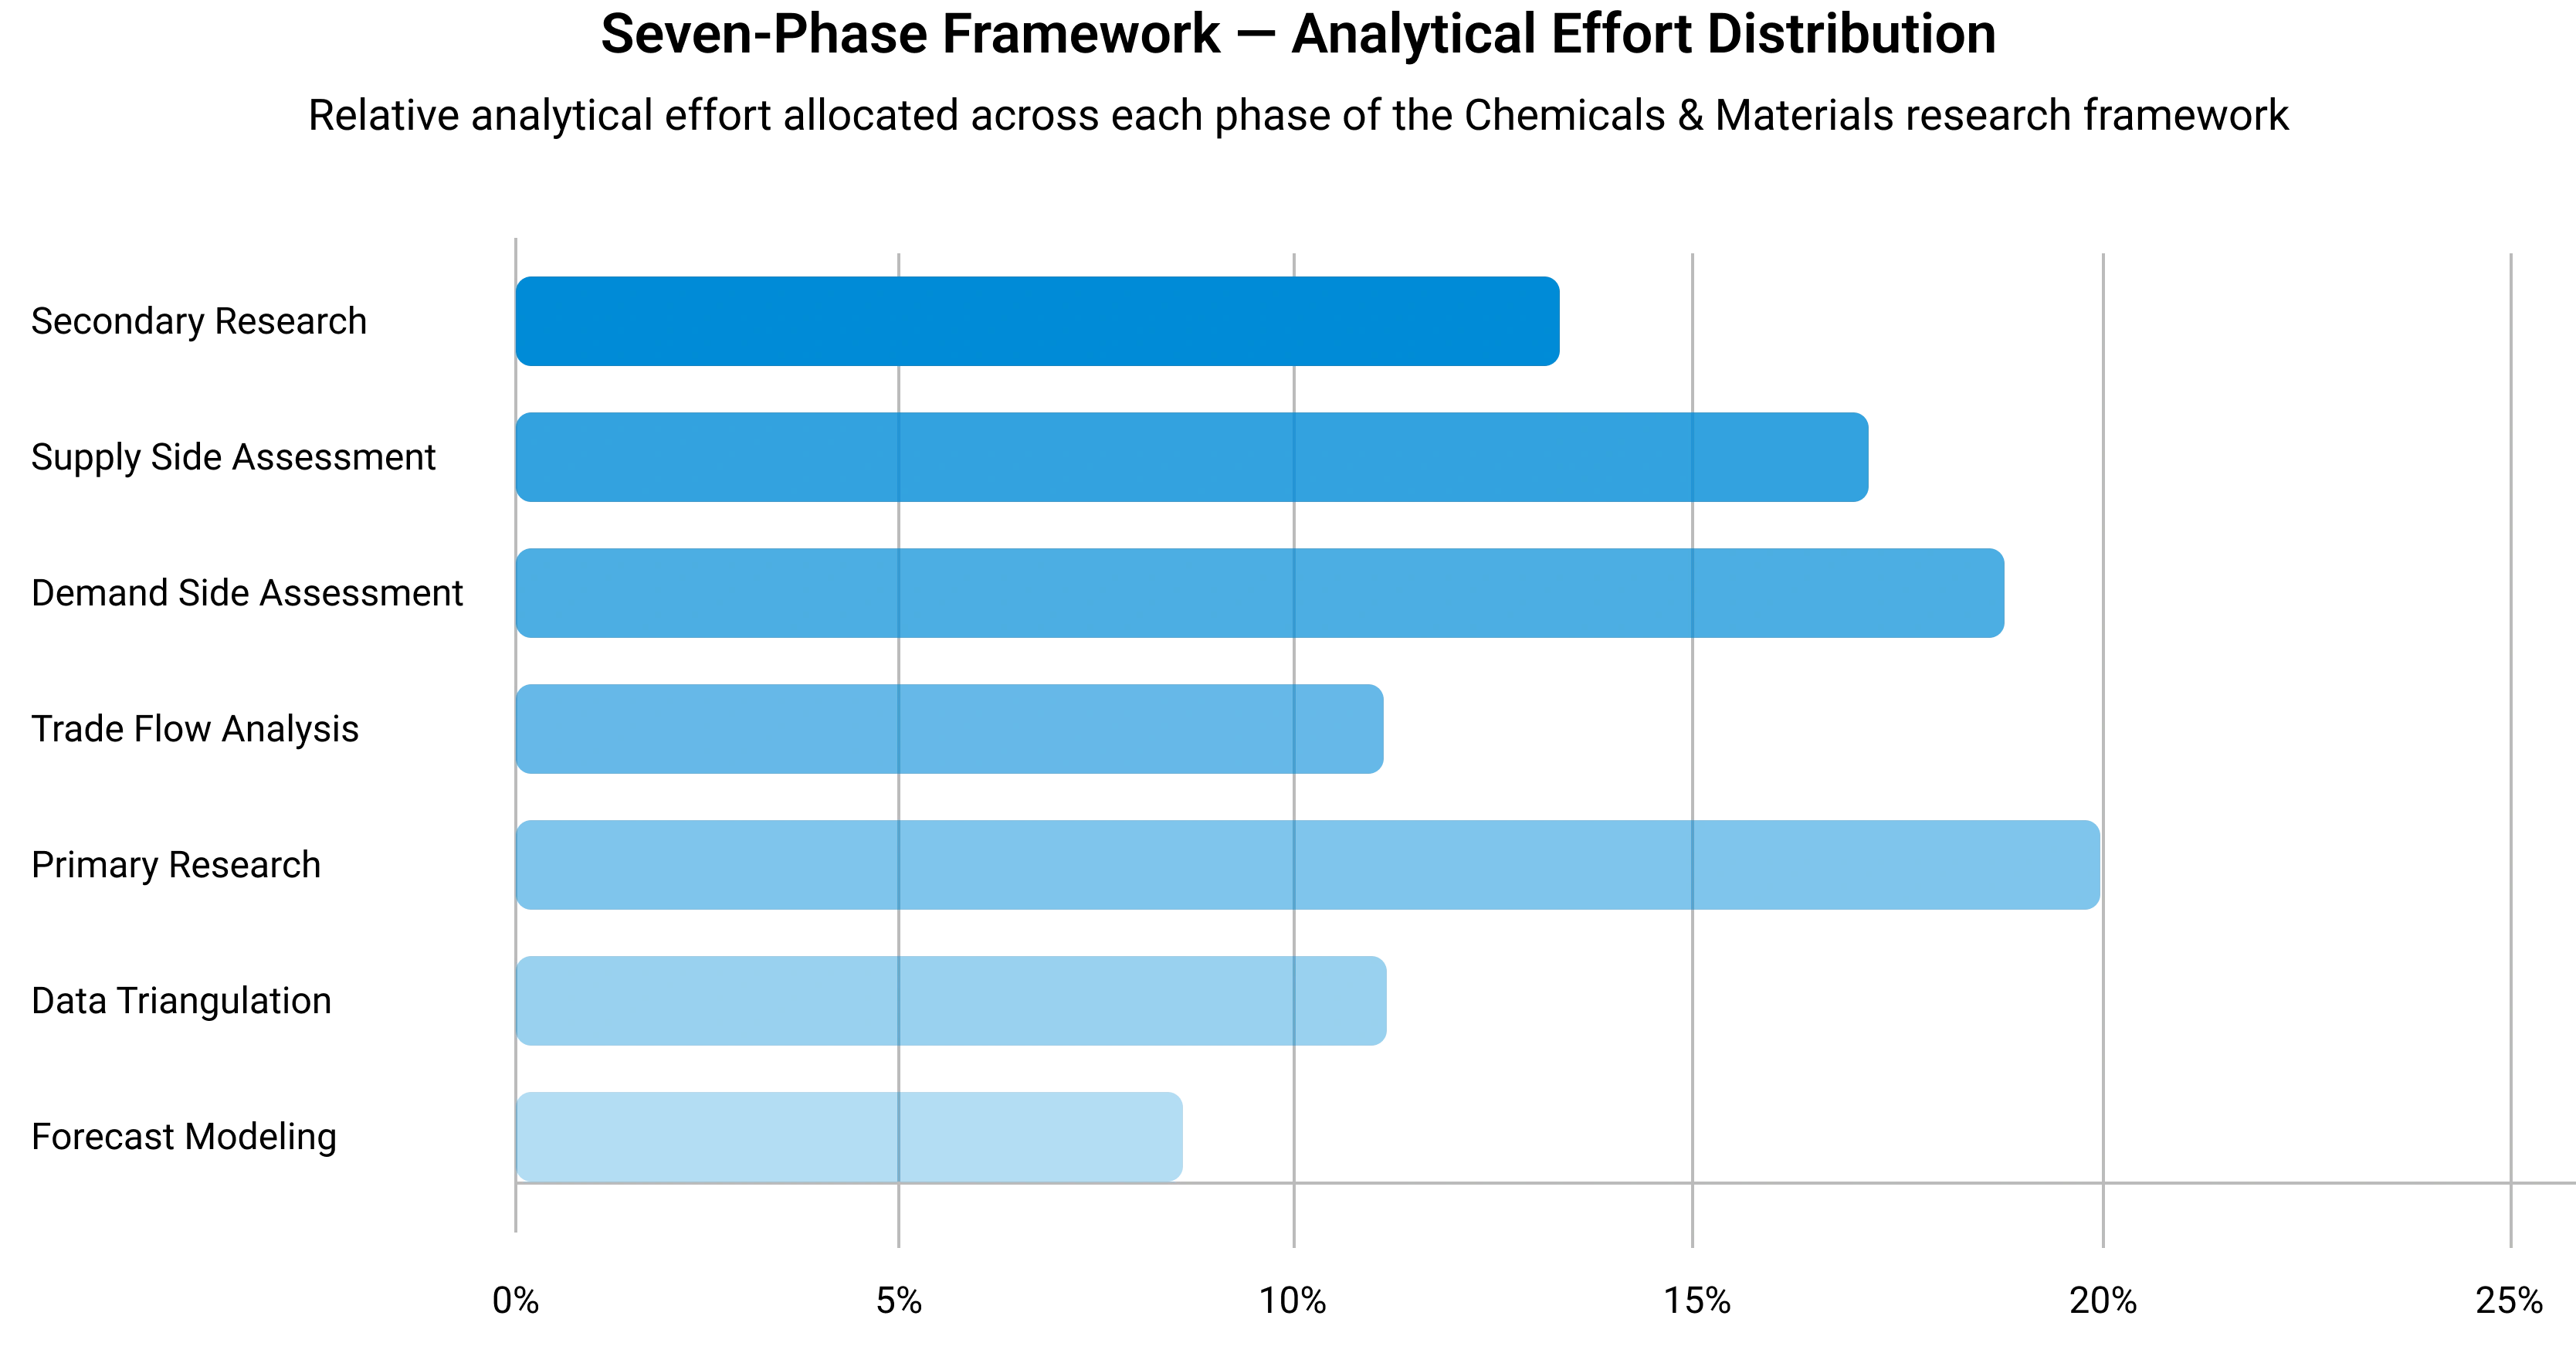
Seven-Phase Framework — Analytical Effort Distribution
Relative analytical effort allocated across each phase of the Chemicals & Materials research framework
Phase 1 - Secondary Research: Establishing the Foundation
Secondary research collects and evaluates publicly available information from authoritative sources, establishing the foundational understanding of market structure, value chain dynamics, competitive landscape, and end-use demand patterns. Every source is evaluated for credibility, recency, geographic relevance, and methodological soundness before inclusion.
Industry Associations
Sources include ACC, CEFIC, ICCA, JCIA, CPCIF, and SOCMA providing production volumes, consumption trends, capacity developments, and sustainability initiatives.
Company Disclosures
Annual reports, investor presentations, earnings transcripts, and regulatory filings reveal product portfolios, manufacturing footprints, capacity expansions, and revenue segmentation.
Government Databases
National statistical offices, customs authorities, environmental agencies, and industrial production databases provide verified statistics on output, trade flows, and regulatory compliance.
Trade Databases
UN Comtrade, ITC, Eurostat, and national customs authorities enable assessment of global product movement, import dependency, and export competitiveness across regions.
Our Secondary Research Sources
- Ministry of Chemicals and Fertilizers
- European Chemicals Agency
- United States Department of Energy
- Ministry of Industry and Information Technology
- Ministry of Economy Trade and Industry
- Ministry of Trade Industry and Energy
- National Institute of Standards and Technology
- Council of Scientific and Industrial Research
- Fraunhofer Society
- National Institute for Materials Science
Phase 2 — Supply-Side Assessment: Mapping Production Capabilities
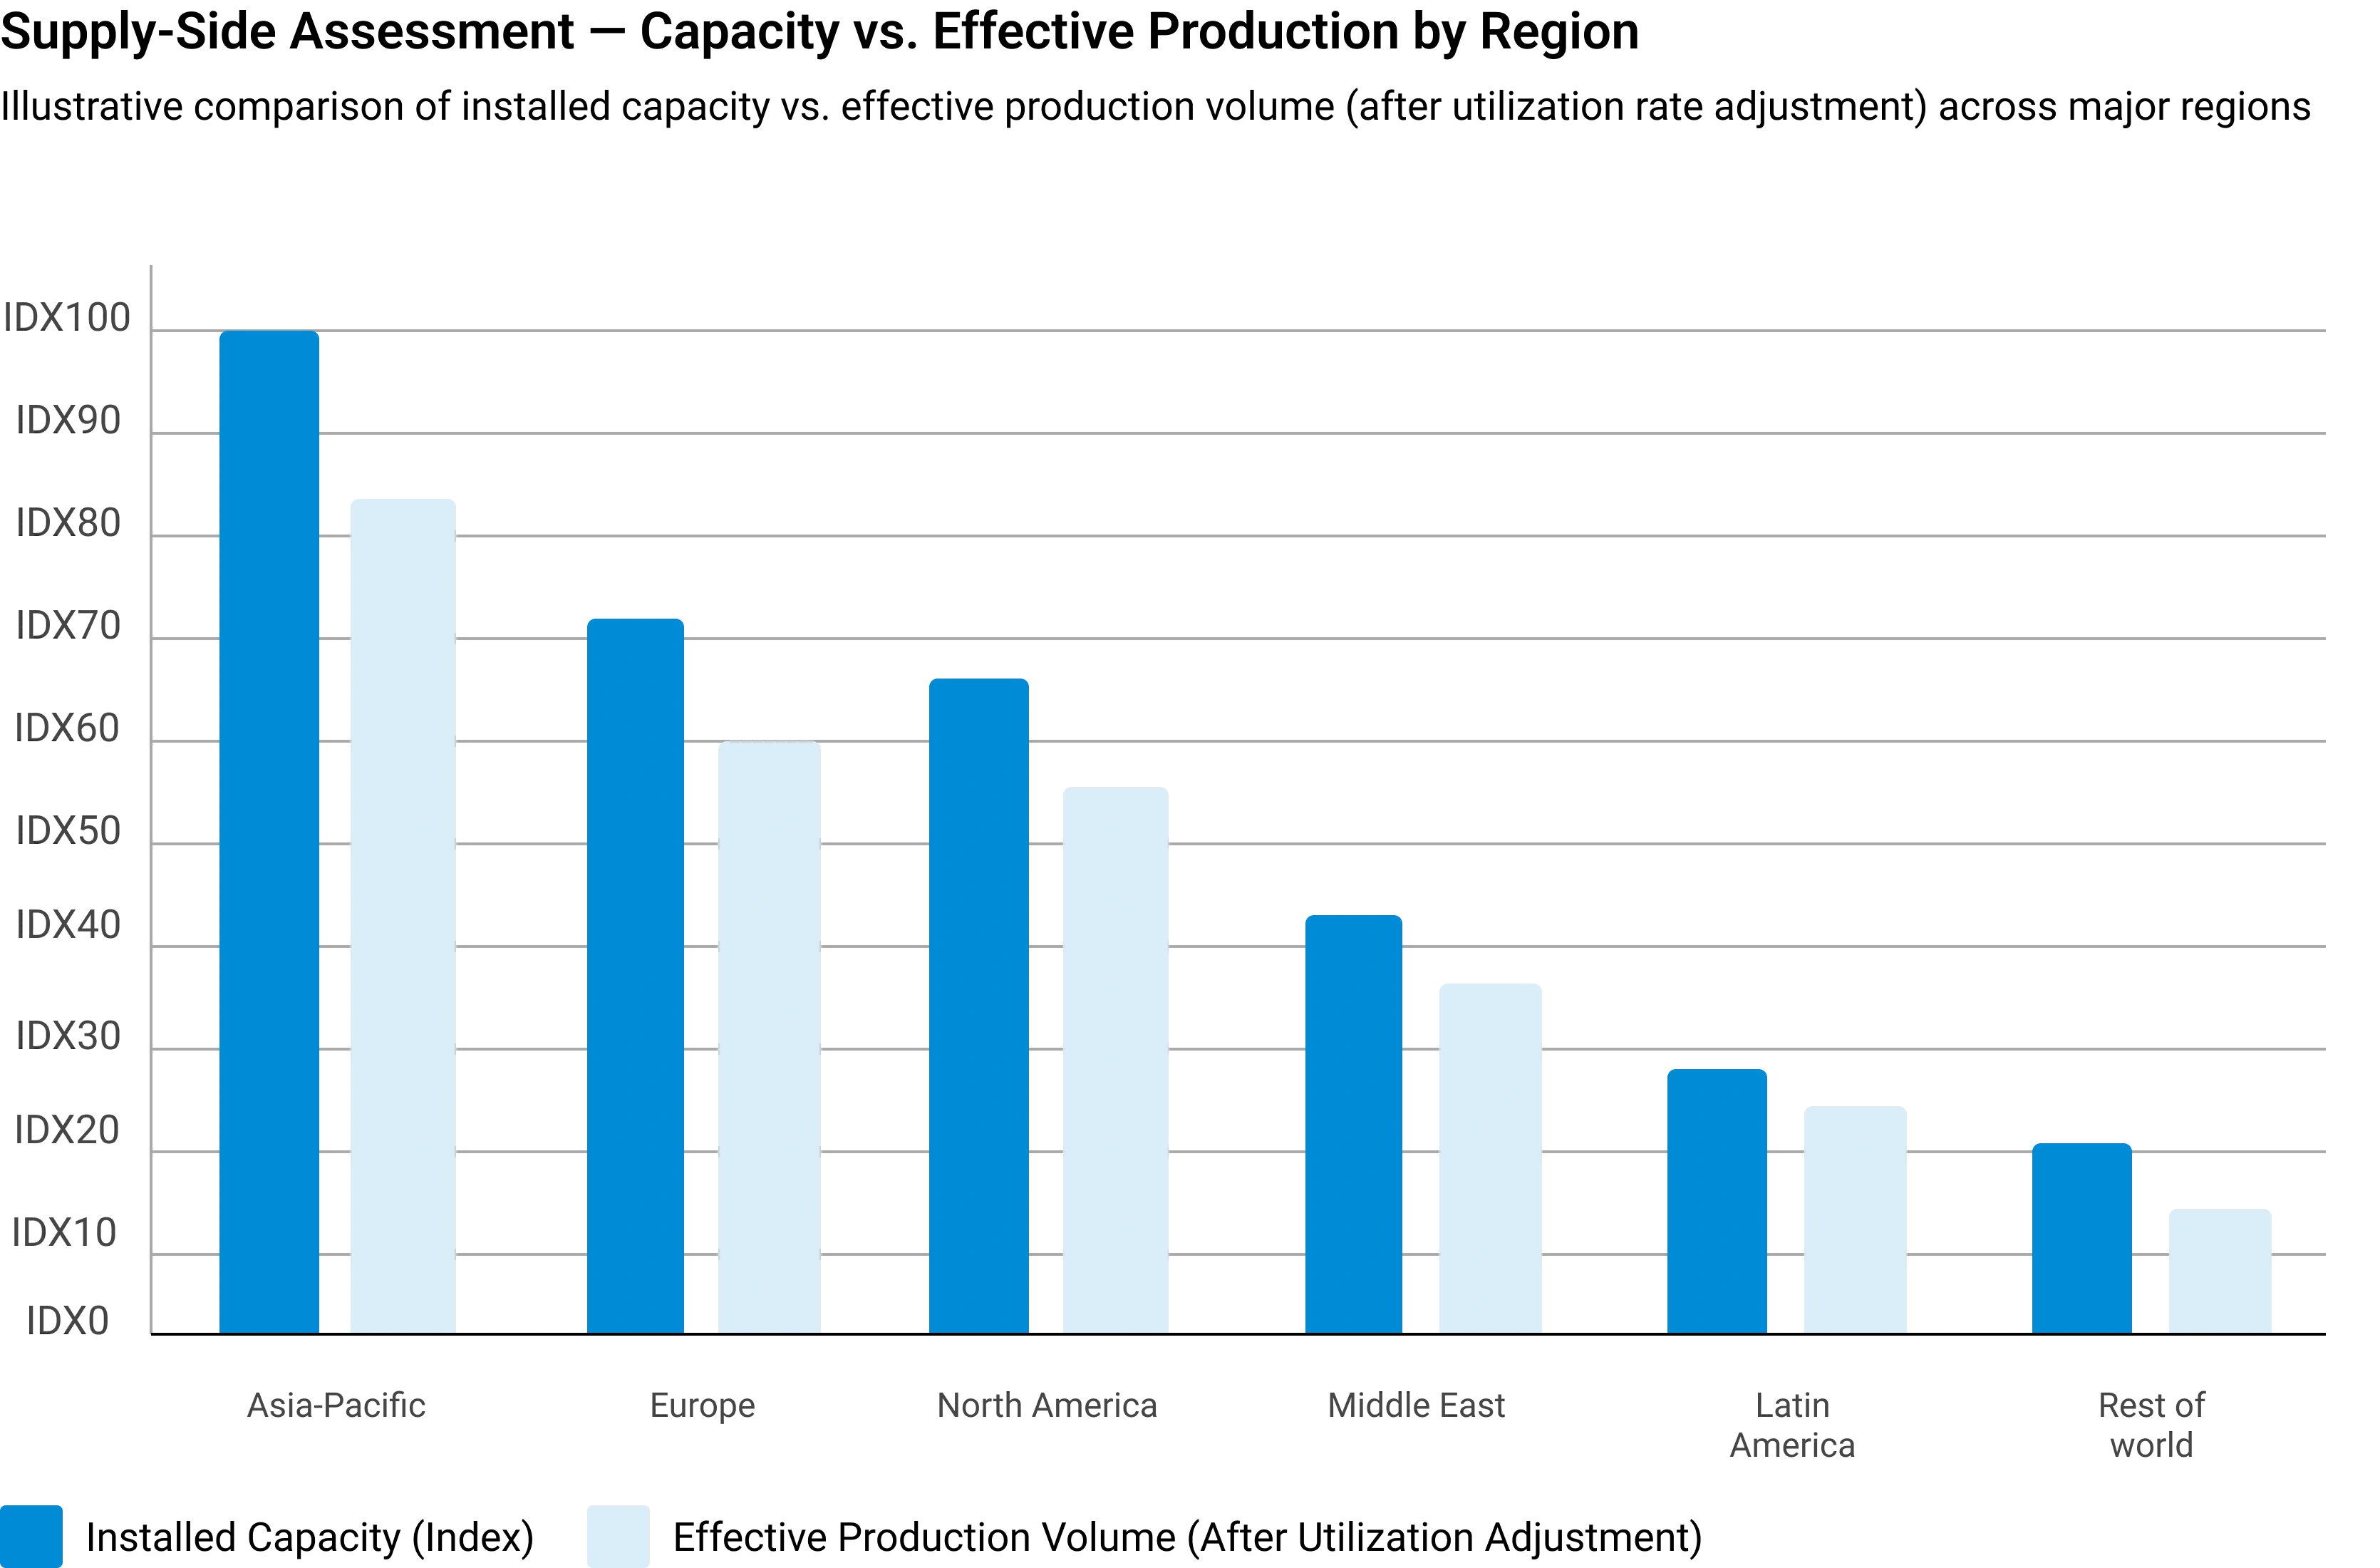
Production Capacity Analysis
All major manufacturers are assessed for existing installed capacity, planned additions, expansions, new plant announcements, and technology adoption — mapped at global, regional, and country levels.
Capacity Utilization Adjustment
Installed capacity is adjusted using utilization rates based on demand conditions, feedstock availability, plant operating rates, maintenance schedules, and regulatory restrictions.
Manufacturer Revenue Analysis
Product-specific revenues, segment-level performance, regional distribution, average selling prices, and margin trends are evaluated to establish market value estimates.
Supply-Side Assessment — Capacity vs. Effective Production by Region
Illustrative comparison of installed capacity vs. effective production volume (after utilization rate adjustment) across major regions
Phase 3 — Demand-Side Assessment: Quantifying Chemical Consumption
Demand-side analysis quantifies chemical consumption across industries, applications, and geographies — identifying where and how chemicals are consumed throughout the value chain with precision.
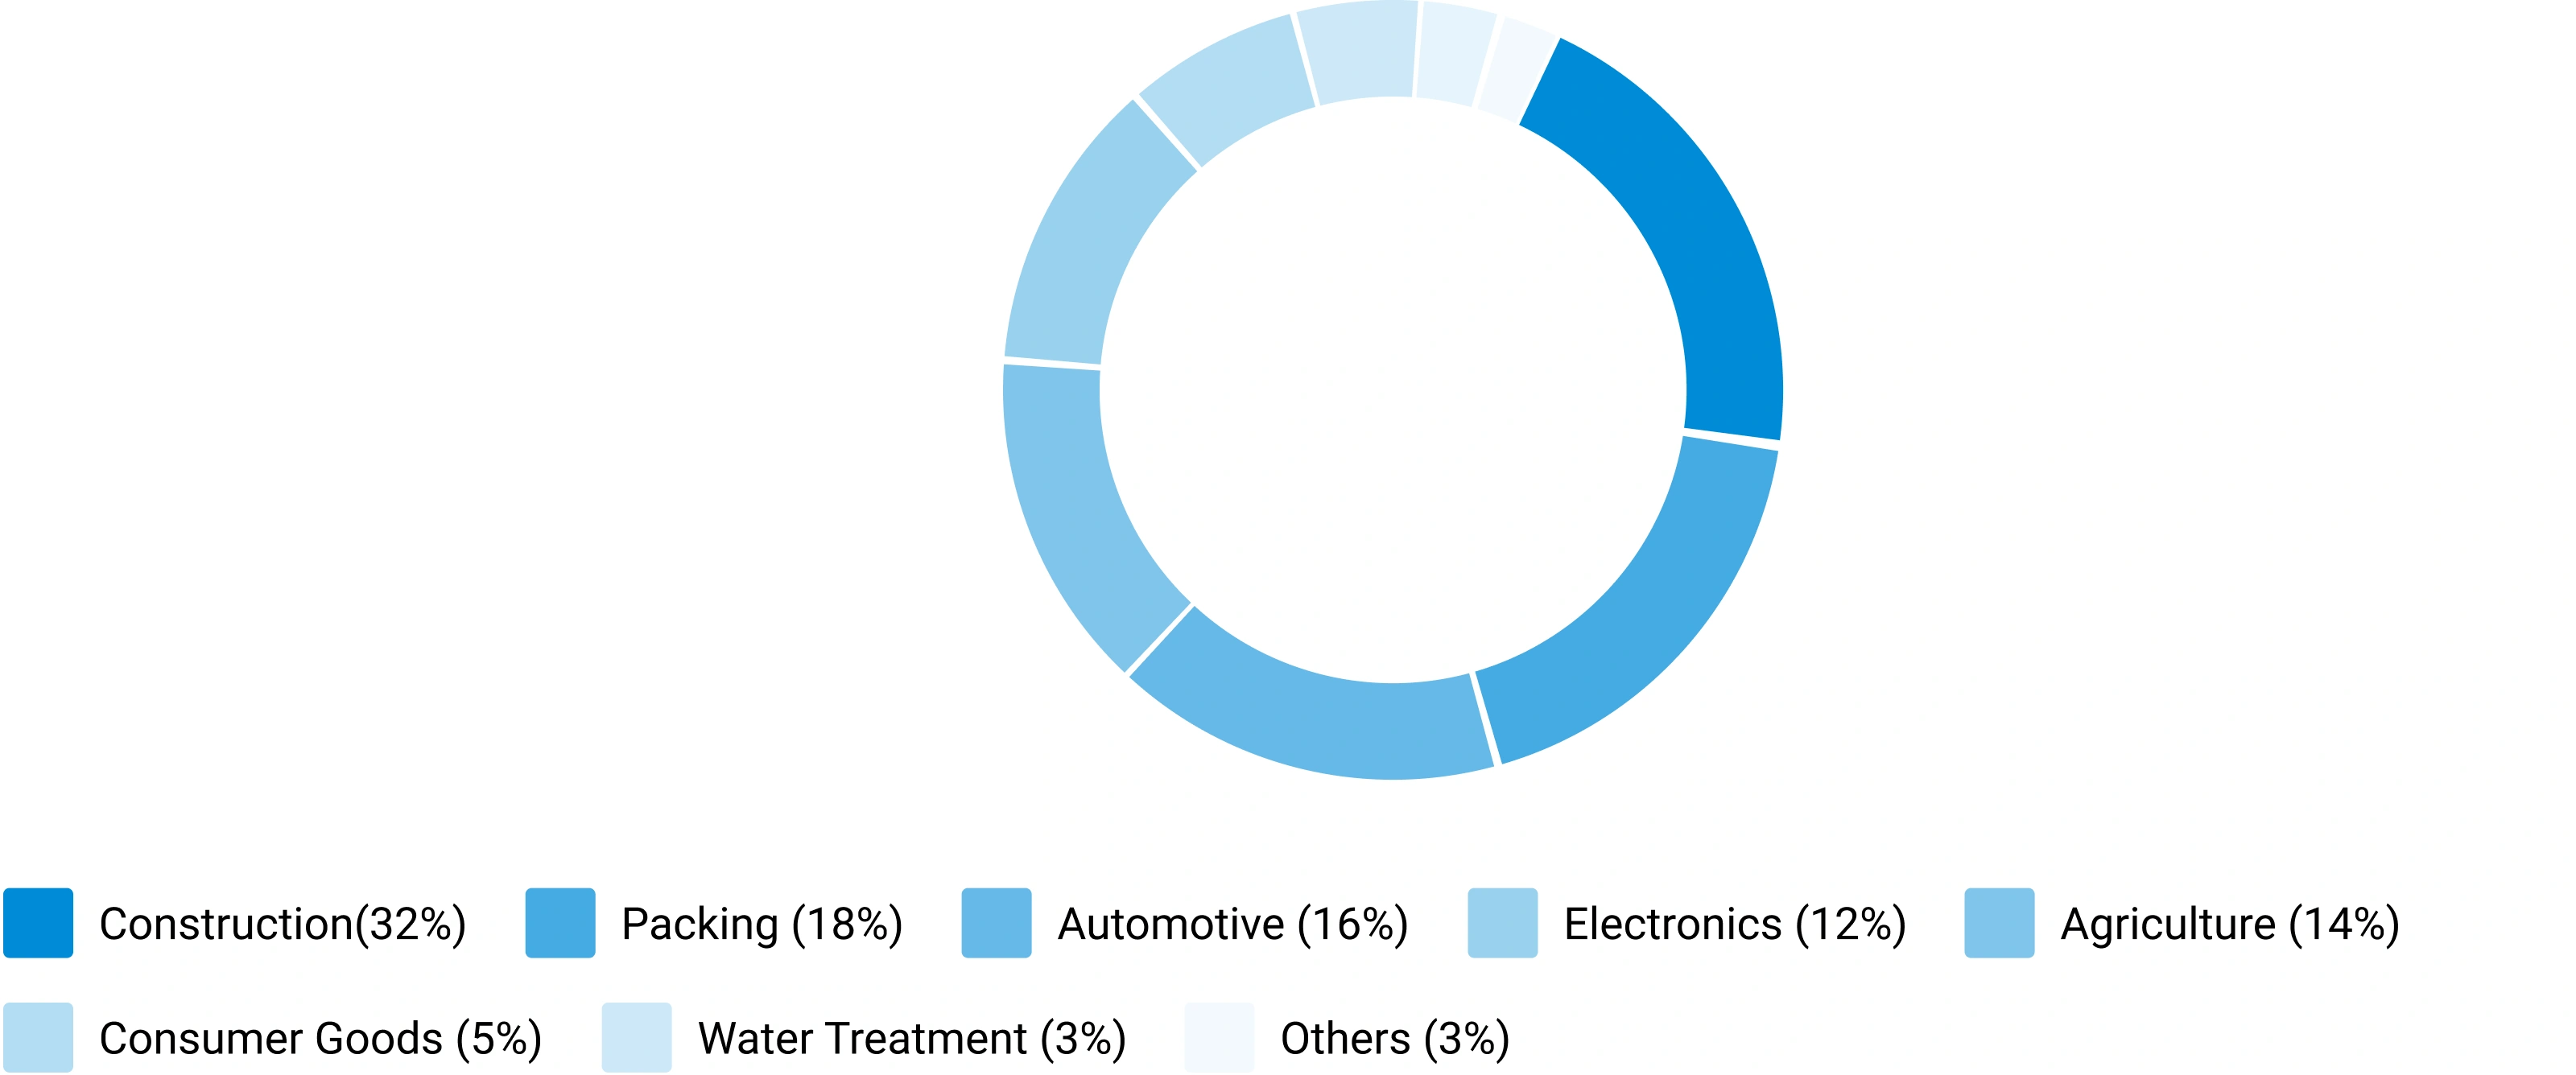
End-Use Industry Analysis
Chemical demand is evaluated across automotive, construction, packaging, electronics, agriculture, healthcare, consumer goods, industrial manufacturing, energy and utilities, and water treatment. Industry output, production trends, and consumption intensity are analyzed to determine demand patterns.
Consumption Modeling
Demand is estimated using measurable indicators: kilograms per vehicle, kilograms per square meter of construction, dosage per cubic meter of water treated, kilograms per hectare of agricultural land, and kilograms per ton of manufactured products. Consumption factors are validated through industry publications and primary interviews.
Application Analysis
The market is segmented by application area to understand product performance requirements, formulation trends, technology adoption, customer preferences, and regulatory requirements improving demand accuracy and segmentation granularity.
Demand-Side Assessment — End-Use Industry Demand Distribution
Illustrative distribution of chemical & materials demand across key end-use industries
Phase 4 - Trade Flow Analysis: Balancing Regional Supply and Demand
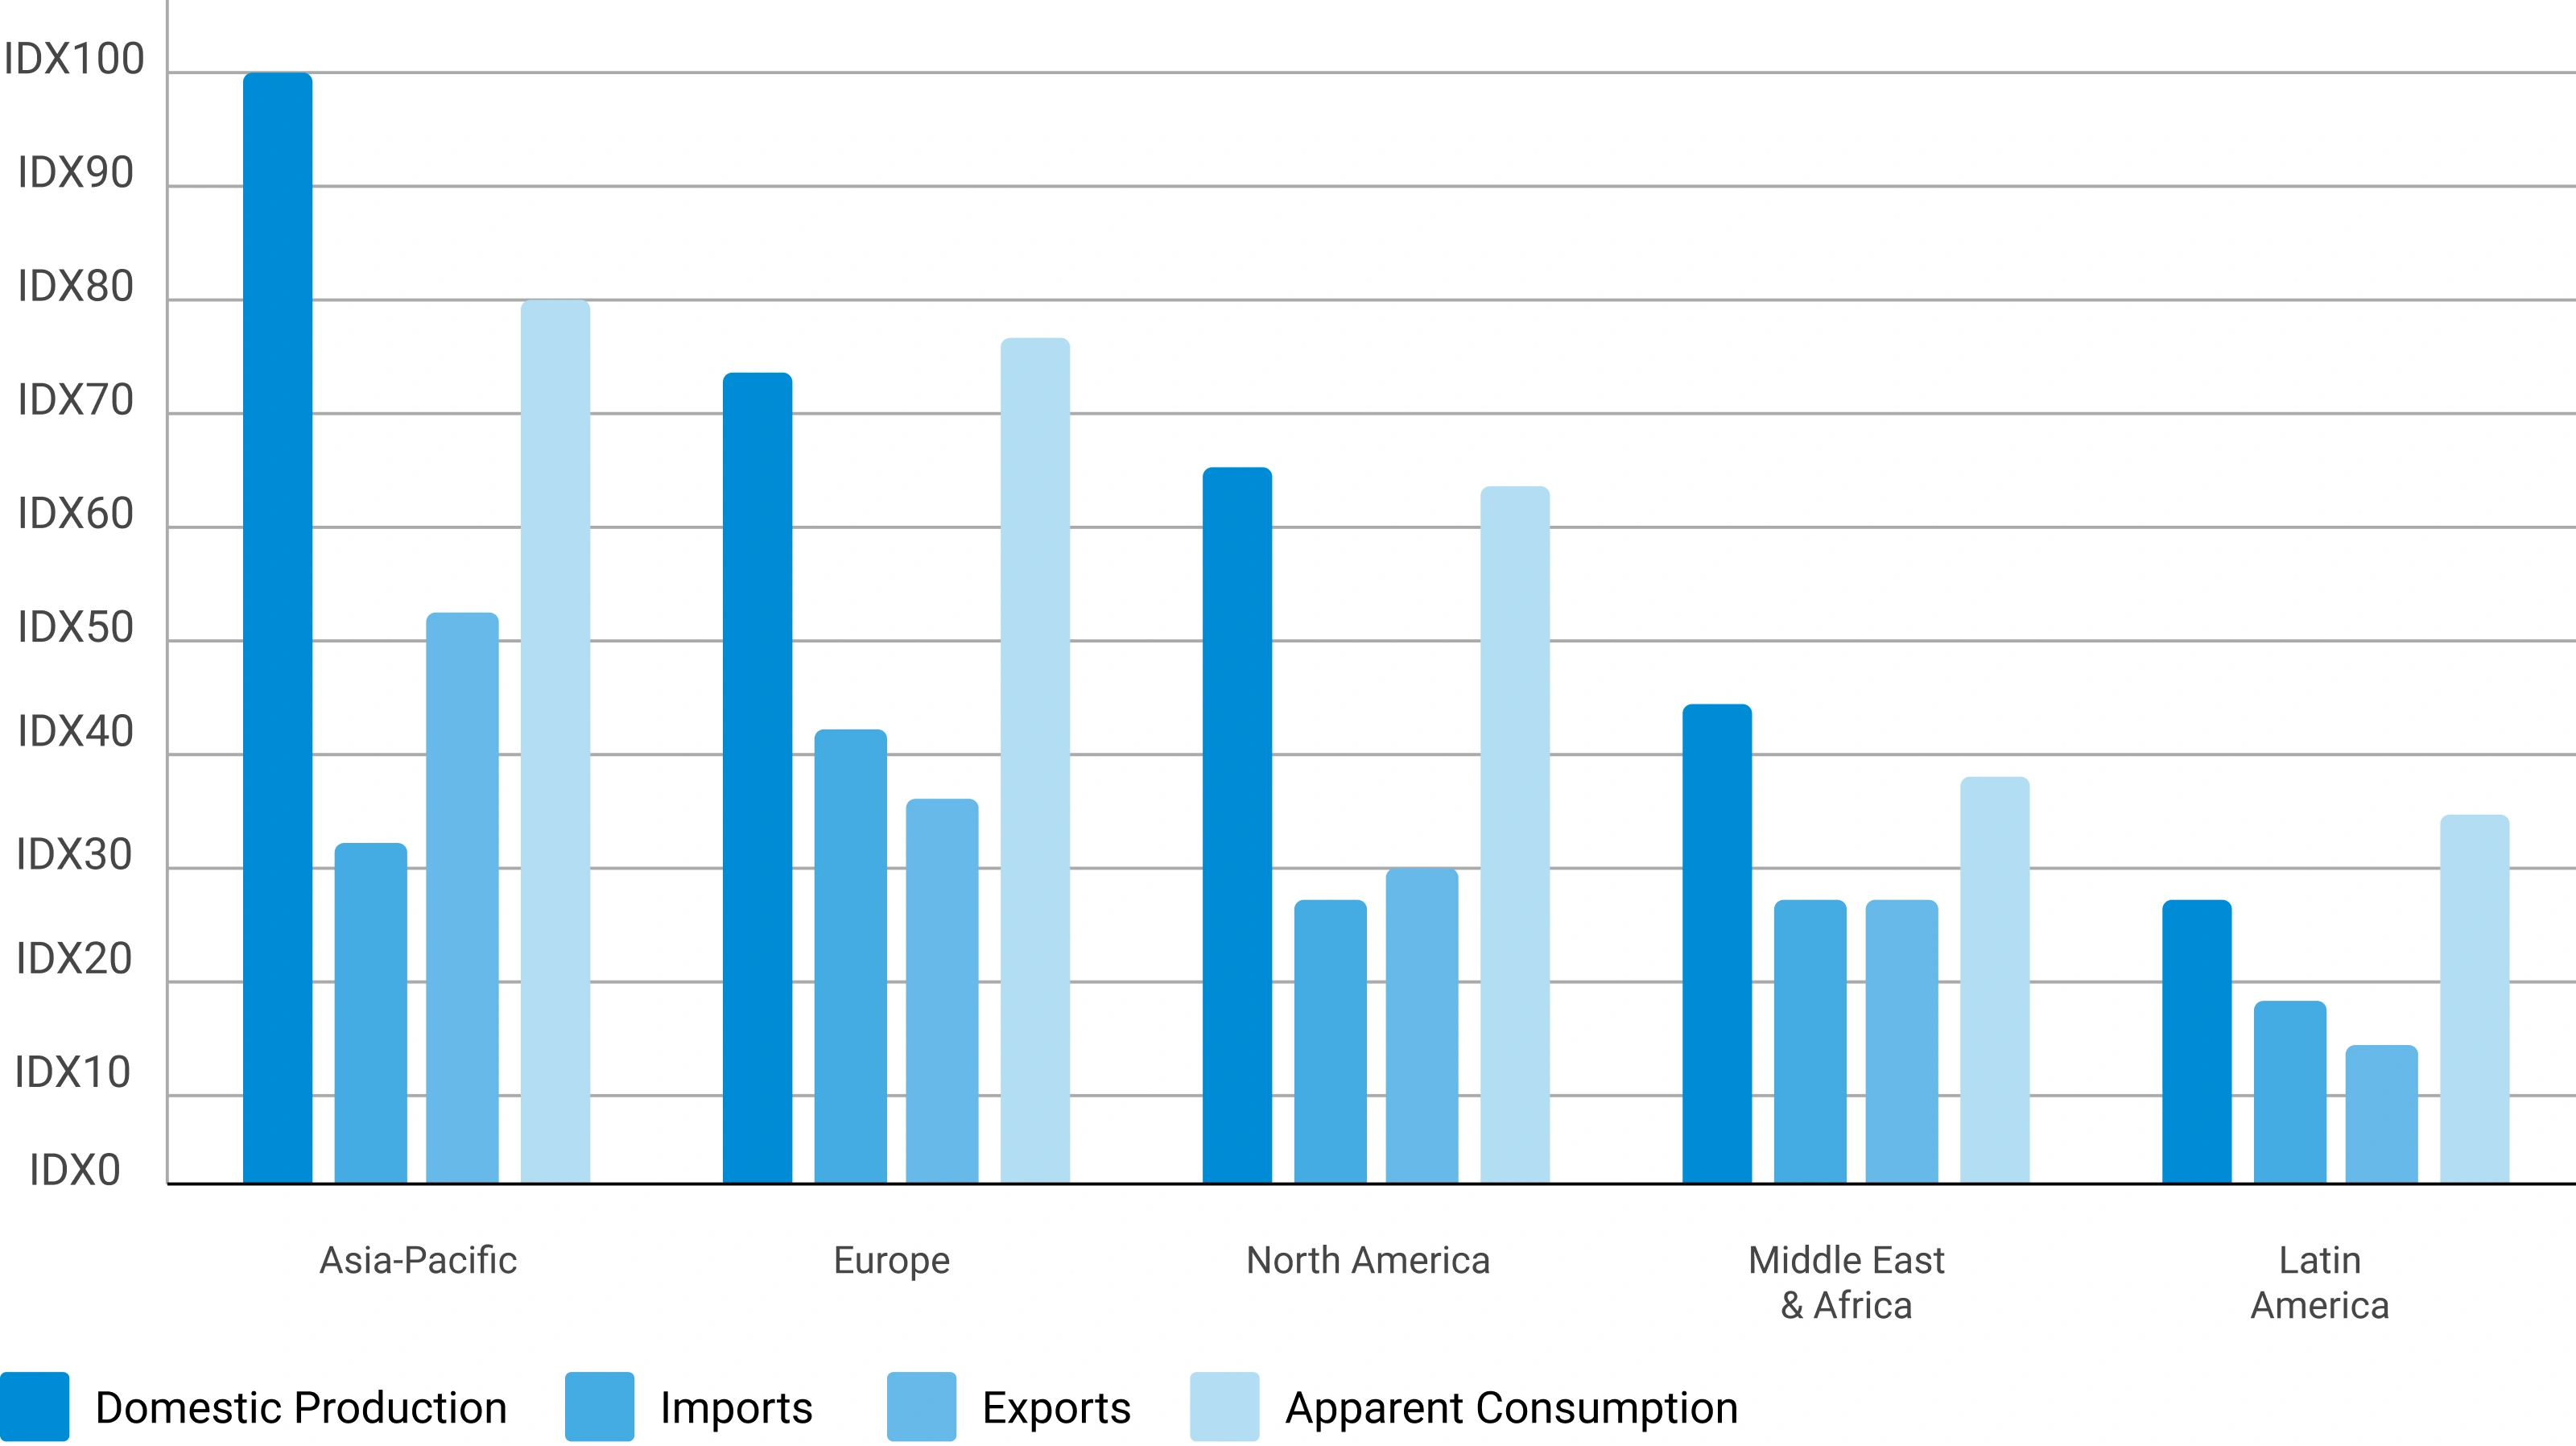
Trade flow analysis reconciles regional supply and demand estimates through import and export data, identifying net supply positions, regional dependencies, and market imbalances. It serves as an independent validation layer that tests the consistency of supply-side and demand-side estimates.
Import Analysis
Import data is evaluated to determine volumes, source countries, product dependency, regional supply gaps, and pricing trends — identifying markets that rely heavily on external supply and where domestic production is insufficient to meet demand.
Export Analysis
Export assessments reveal production surplus, export competitiveness, regional manufacturing strength, and global market participation. Export patterns also help validate domestic production estimates and identify net exporting regions.
Apparent Consumption Model
Regional consumption is assessed using the standard apparent consumption formula:
Results identify net importing regions, net exporting regions, regional deficits, and surpluses — serving as an independent validation of supply and demand estimates.
Trade Flow Analysis — Net Supply Position by Region
Illustrative apparent consumption vs. domestic production across major regions — positive gap indicates net import dependency
Phase 5 — Primary Research: The Critical Validation Layer
Primary research tests and refines findings from secondary research through direct engagement with industry participants across the supply chain, demand side, and expert community. It captures intelligence that no database or published report can provide — the real-world experience of manufacturers, buyers, and specialists operating in the market.

Supply-Side Interviews
Conversations with chemical manufacturers, raw material suppliers, contract manufacturers, technology providers, and plant operators cover production trends, capacity utilization, pricing developments, technology shifts, and competitive dynamics.

Demand-Side Interviews
Engagement with OEMs, industrial consumers, procurement managers, distributors, formulators, and end-use manufacturers focuses on consumption trends, purchasing behavior, product substitution, demand outlook, and emerging applications.

Industry Expert Consultations
Additional interviews with industry consultants, independent experts, regulatory specialists, technical professionals, and research institutions provide deeper market context and validate key analytical assumptions.
Focus Areas of Primary Research:
Market Size & Forecast Validation
Revenue estimates, volume consumption, growth rates, forecast assumptions, regional demand.Supply Chain & Value Chain Assessment
Raw material sourcing, supply chain challenges, distribution networks, procurement practices.Production & Capacity Analysis
Manufacturing capacity, utilization rates, expansion projects, plant investments.Pricing & Cost Structure Analysis
Product pricing trends, feedstock costs, energy costs, margin pressures, pricing outlook.Competitive Landscape Assessment
Volume and value estimates confirmed to be fully consistent with one another before publicationInterview Volume by Market Scope
| Study Scope | Number of Interviews |
|---|---|
| Niche Market | 20 – 30 |
| Mid-Sized Market | 30 – 50 |
| Global Market | 50 – 80 |
| Highly Fragmented Market | 80 – 120 |
Interview Details:
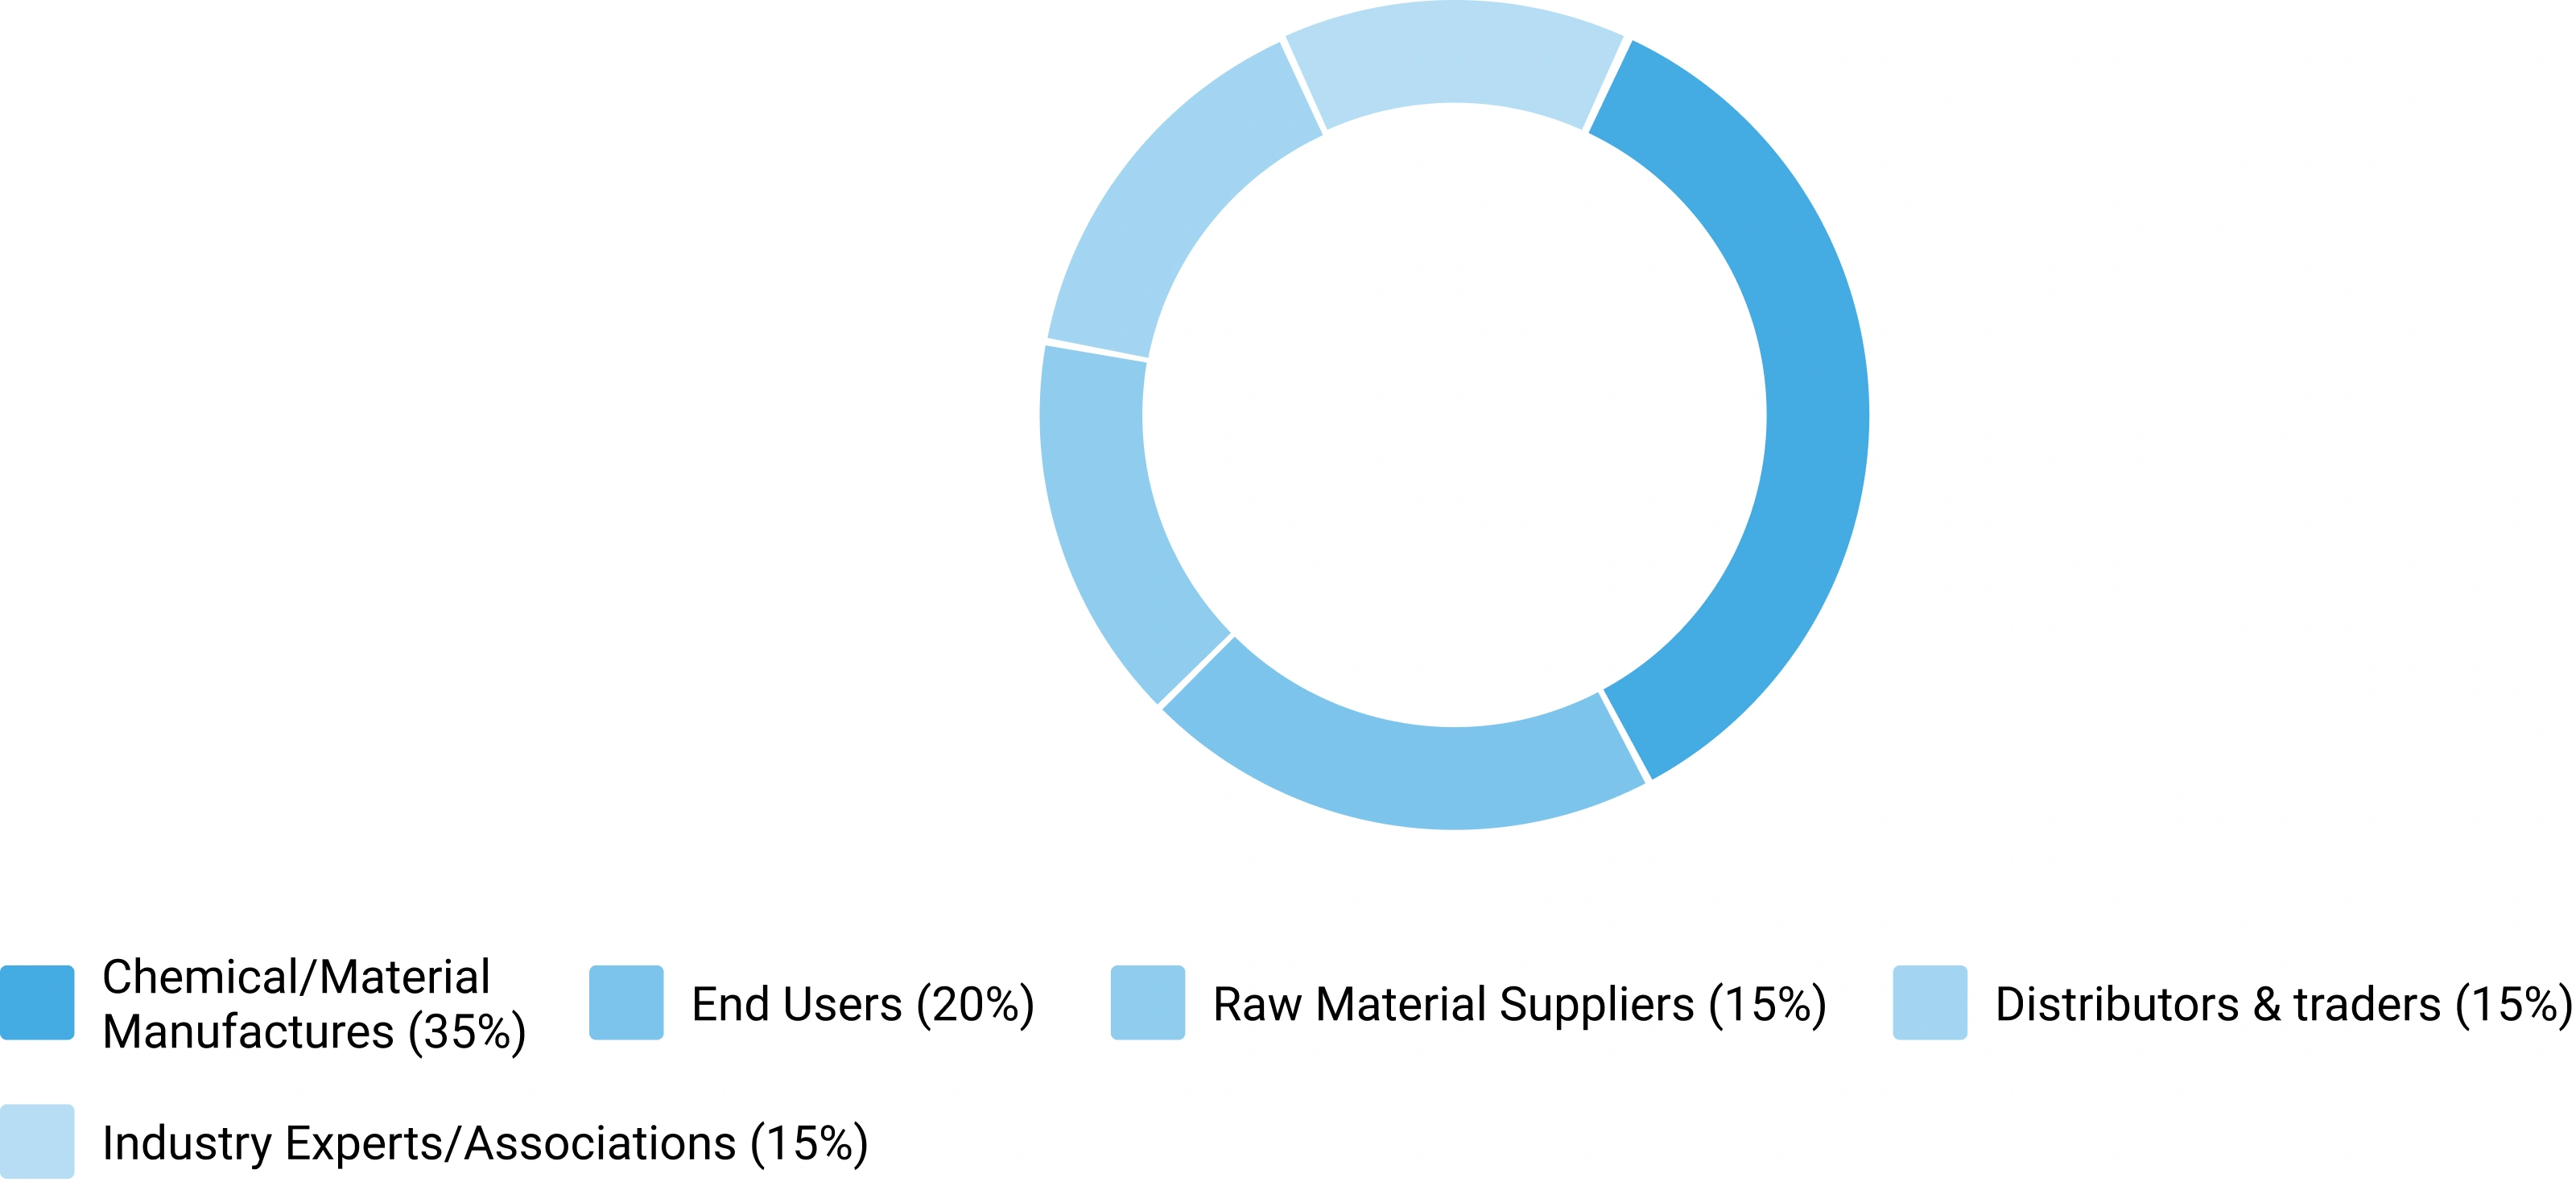
Category : Manufacturers, Suppliers, Distributors, End Users, Experts/Associations
Average Duration : 30–60 Minutes
Interview Mode : Video calls, telephonic interviews, expert consultations
Interview Format : Structured / Semi-Structured questionnaire
Focus Areas of Primary Research:
Market Size & Forecast Validation :
Revenue estimates, volume consumption, growth rates, forecast assumptions, regional demand.
Supply Chain & Value Chain Assessment :
Raw material sourcing, supply chain challenges, distribution networks, procurement practices.
Production & Capacity Analysis :
Manufacturing capacity, utilization rates, expansion projects, plant investments.
Pricing & Cost Structure Analysis :
Product pricing trends, feedstock costs, energy costs, margin pressures, pricing outlook.
Competitive Landscape Assessment :
Market share, competitor positioning, strategic initiatives, partnerships, acquisitions.
Primary Research — Stakeholder Coverage by Category
Distribution of interview respondents across stakeholder categories (% share from PPT data)
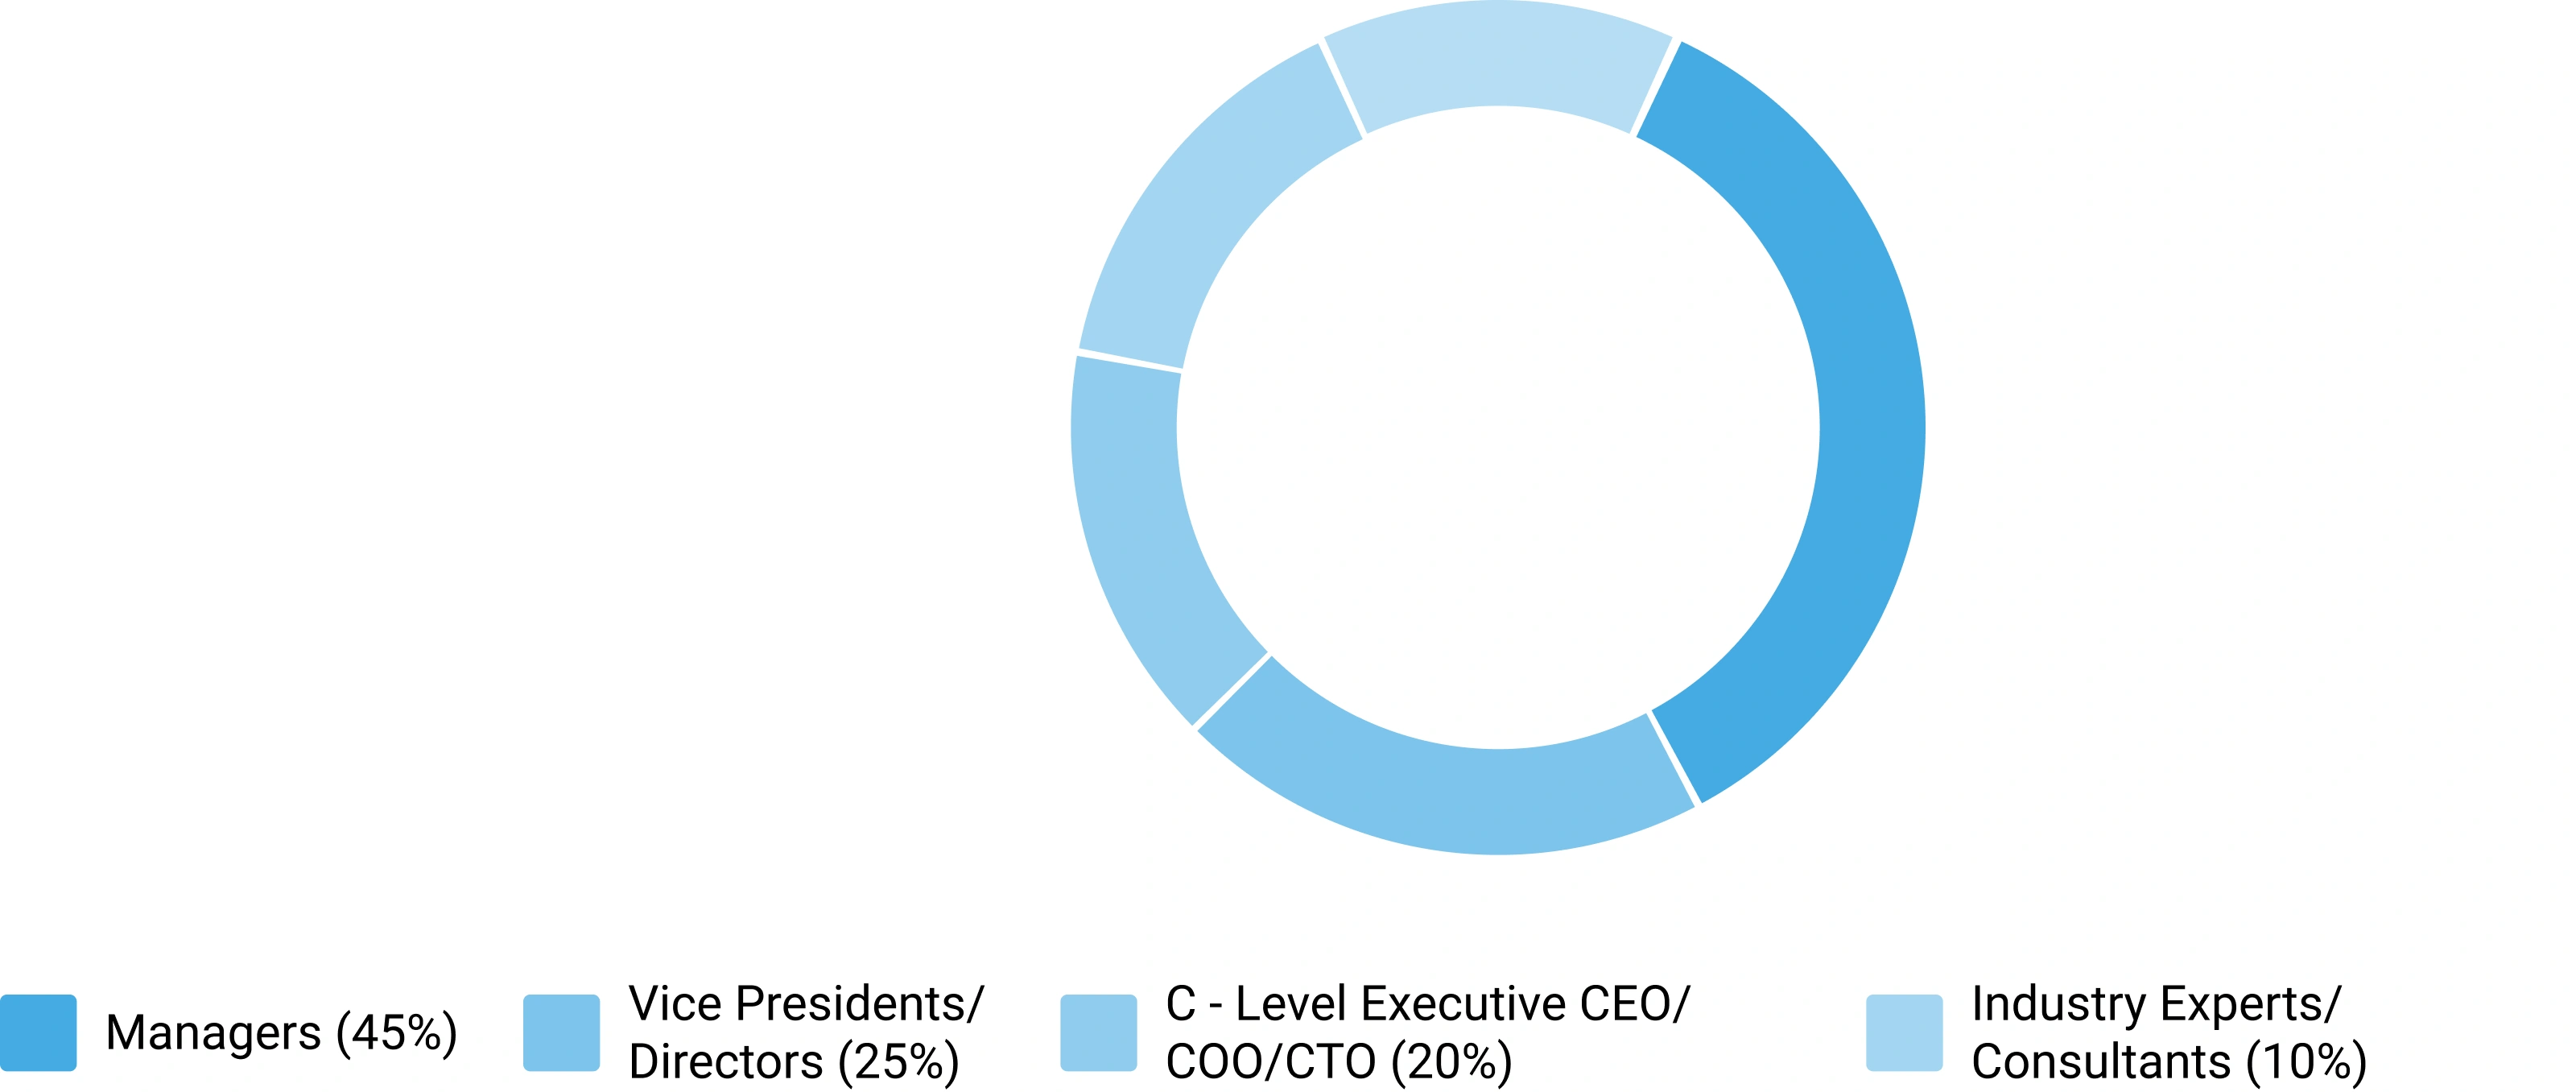
Primary Research — Respondent Designation Profile
Seniority breakdown of interview respondents (% share from PPT data)
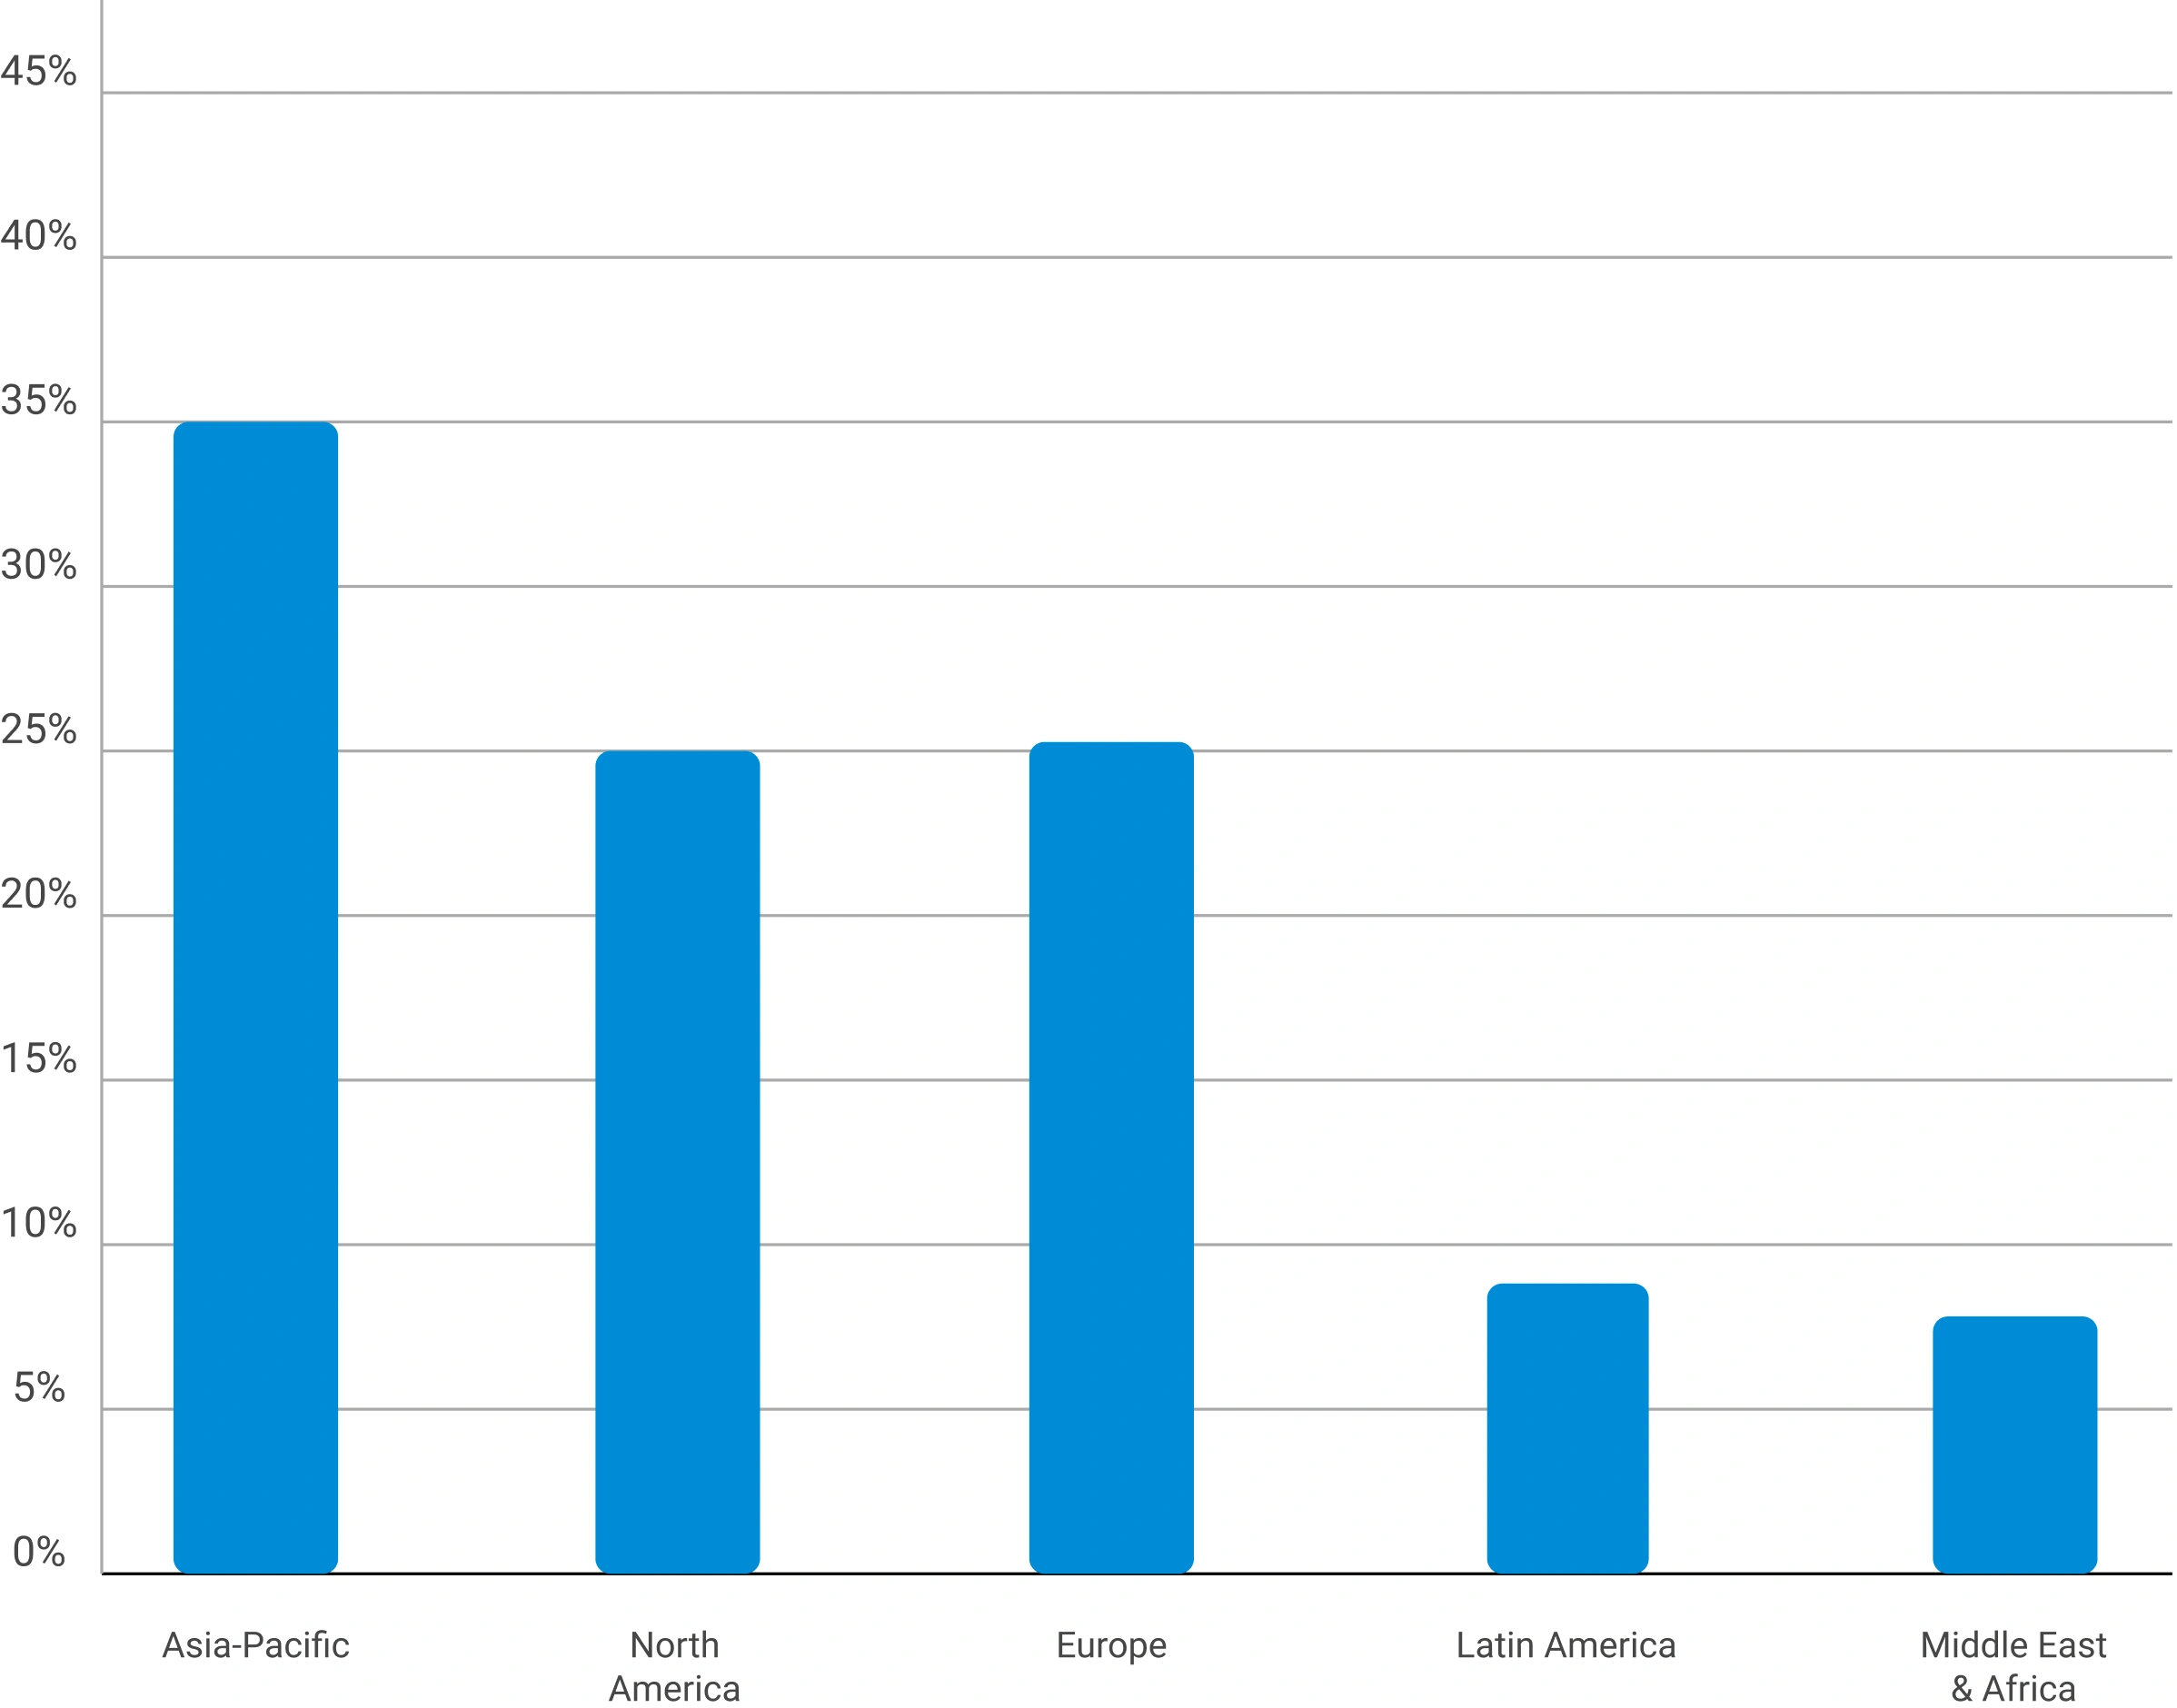
Primary Research — Geographic Coverage of Interviews
Regional distribution of primary research engagement (% share from PPT data)
Phase 6 — Data Triangulation and Market Validation
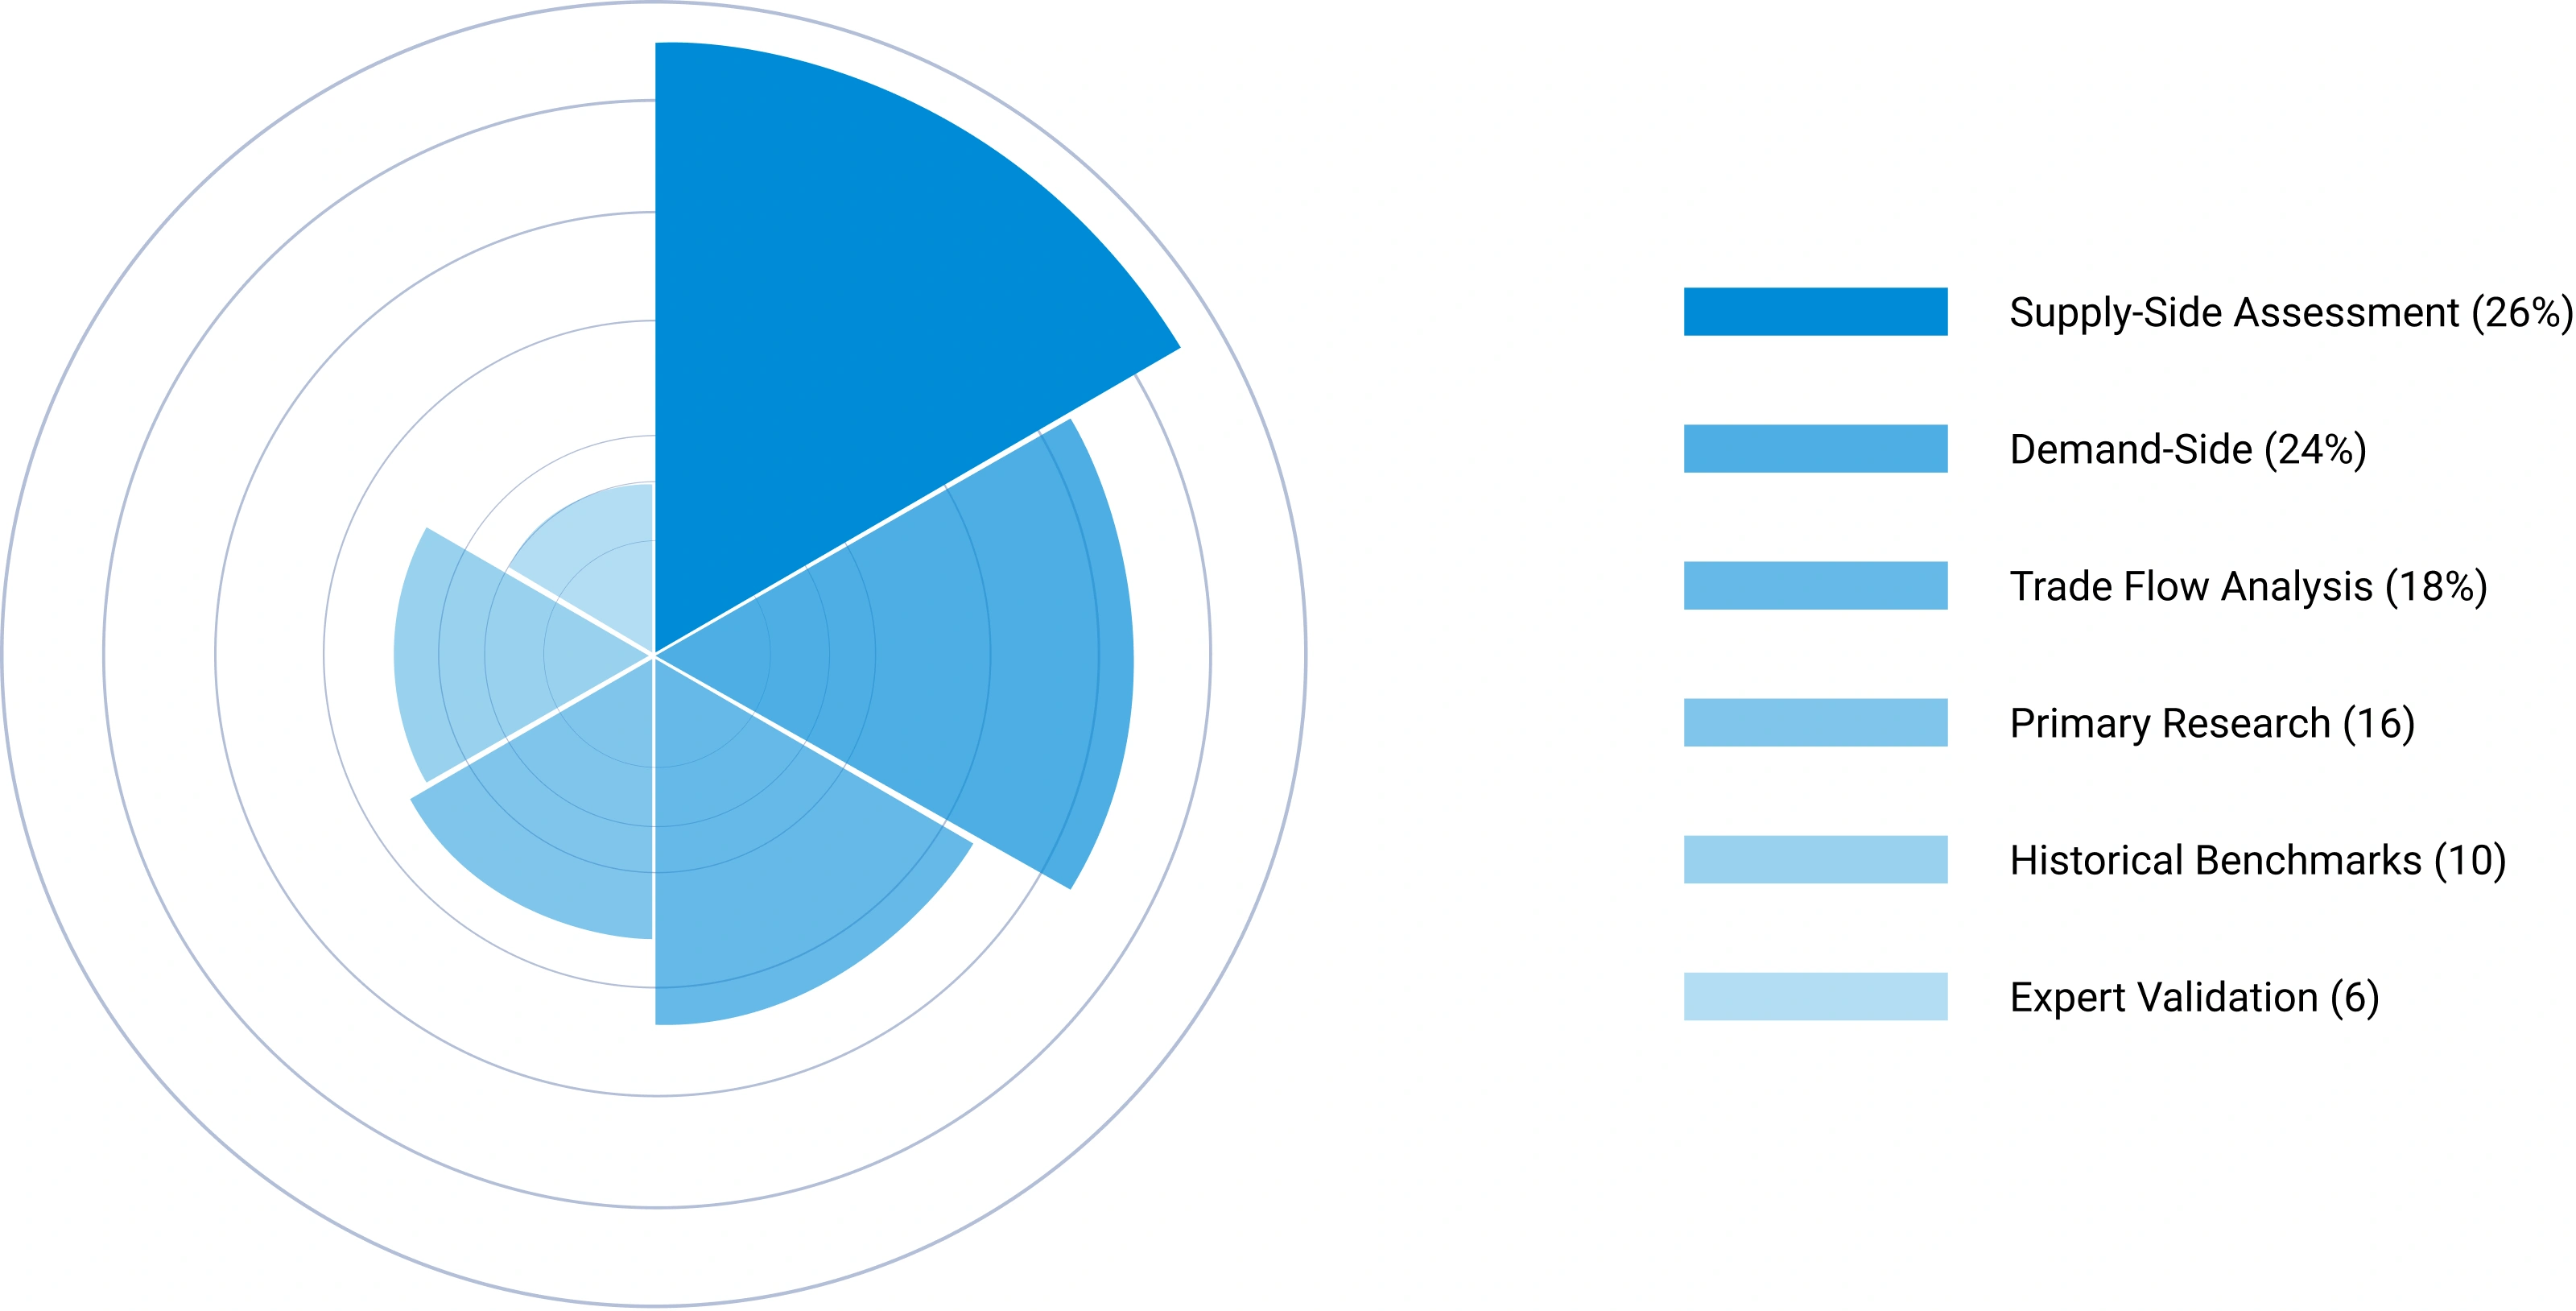
No single methodology is relied upon in isolation. Multiple independent estimation approaches are combined and reconciled to ensure consistency, accuracy, and analytical defensibility. Any material deviations between approaches are investigated and adjusted through additional validation cycles.
The final market size is derived through weighted triangulation of all validated methodologies. Any material deviations between approaches are investigated and adjusted through additional validation cycles. The outcome represents the most realistic assessment of the market based on available evidence and expert confirmation ensuring that volume and value estimates are fully consistent with one another.
Triangulation Framework — Input Contribution Weight
Relative weight each sizing input contributes to the final reconciled market estimate
Phase 7 — Forecast Modeling: Projecting Future Market Evolution
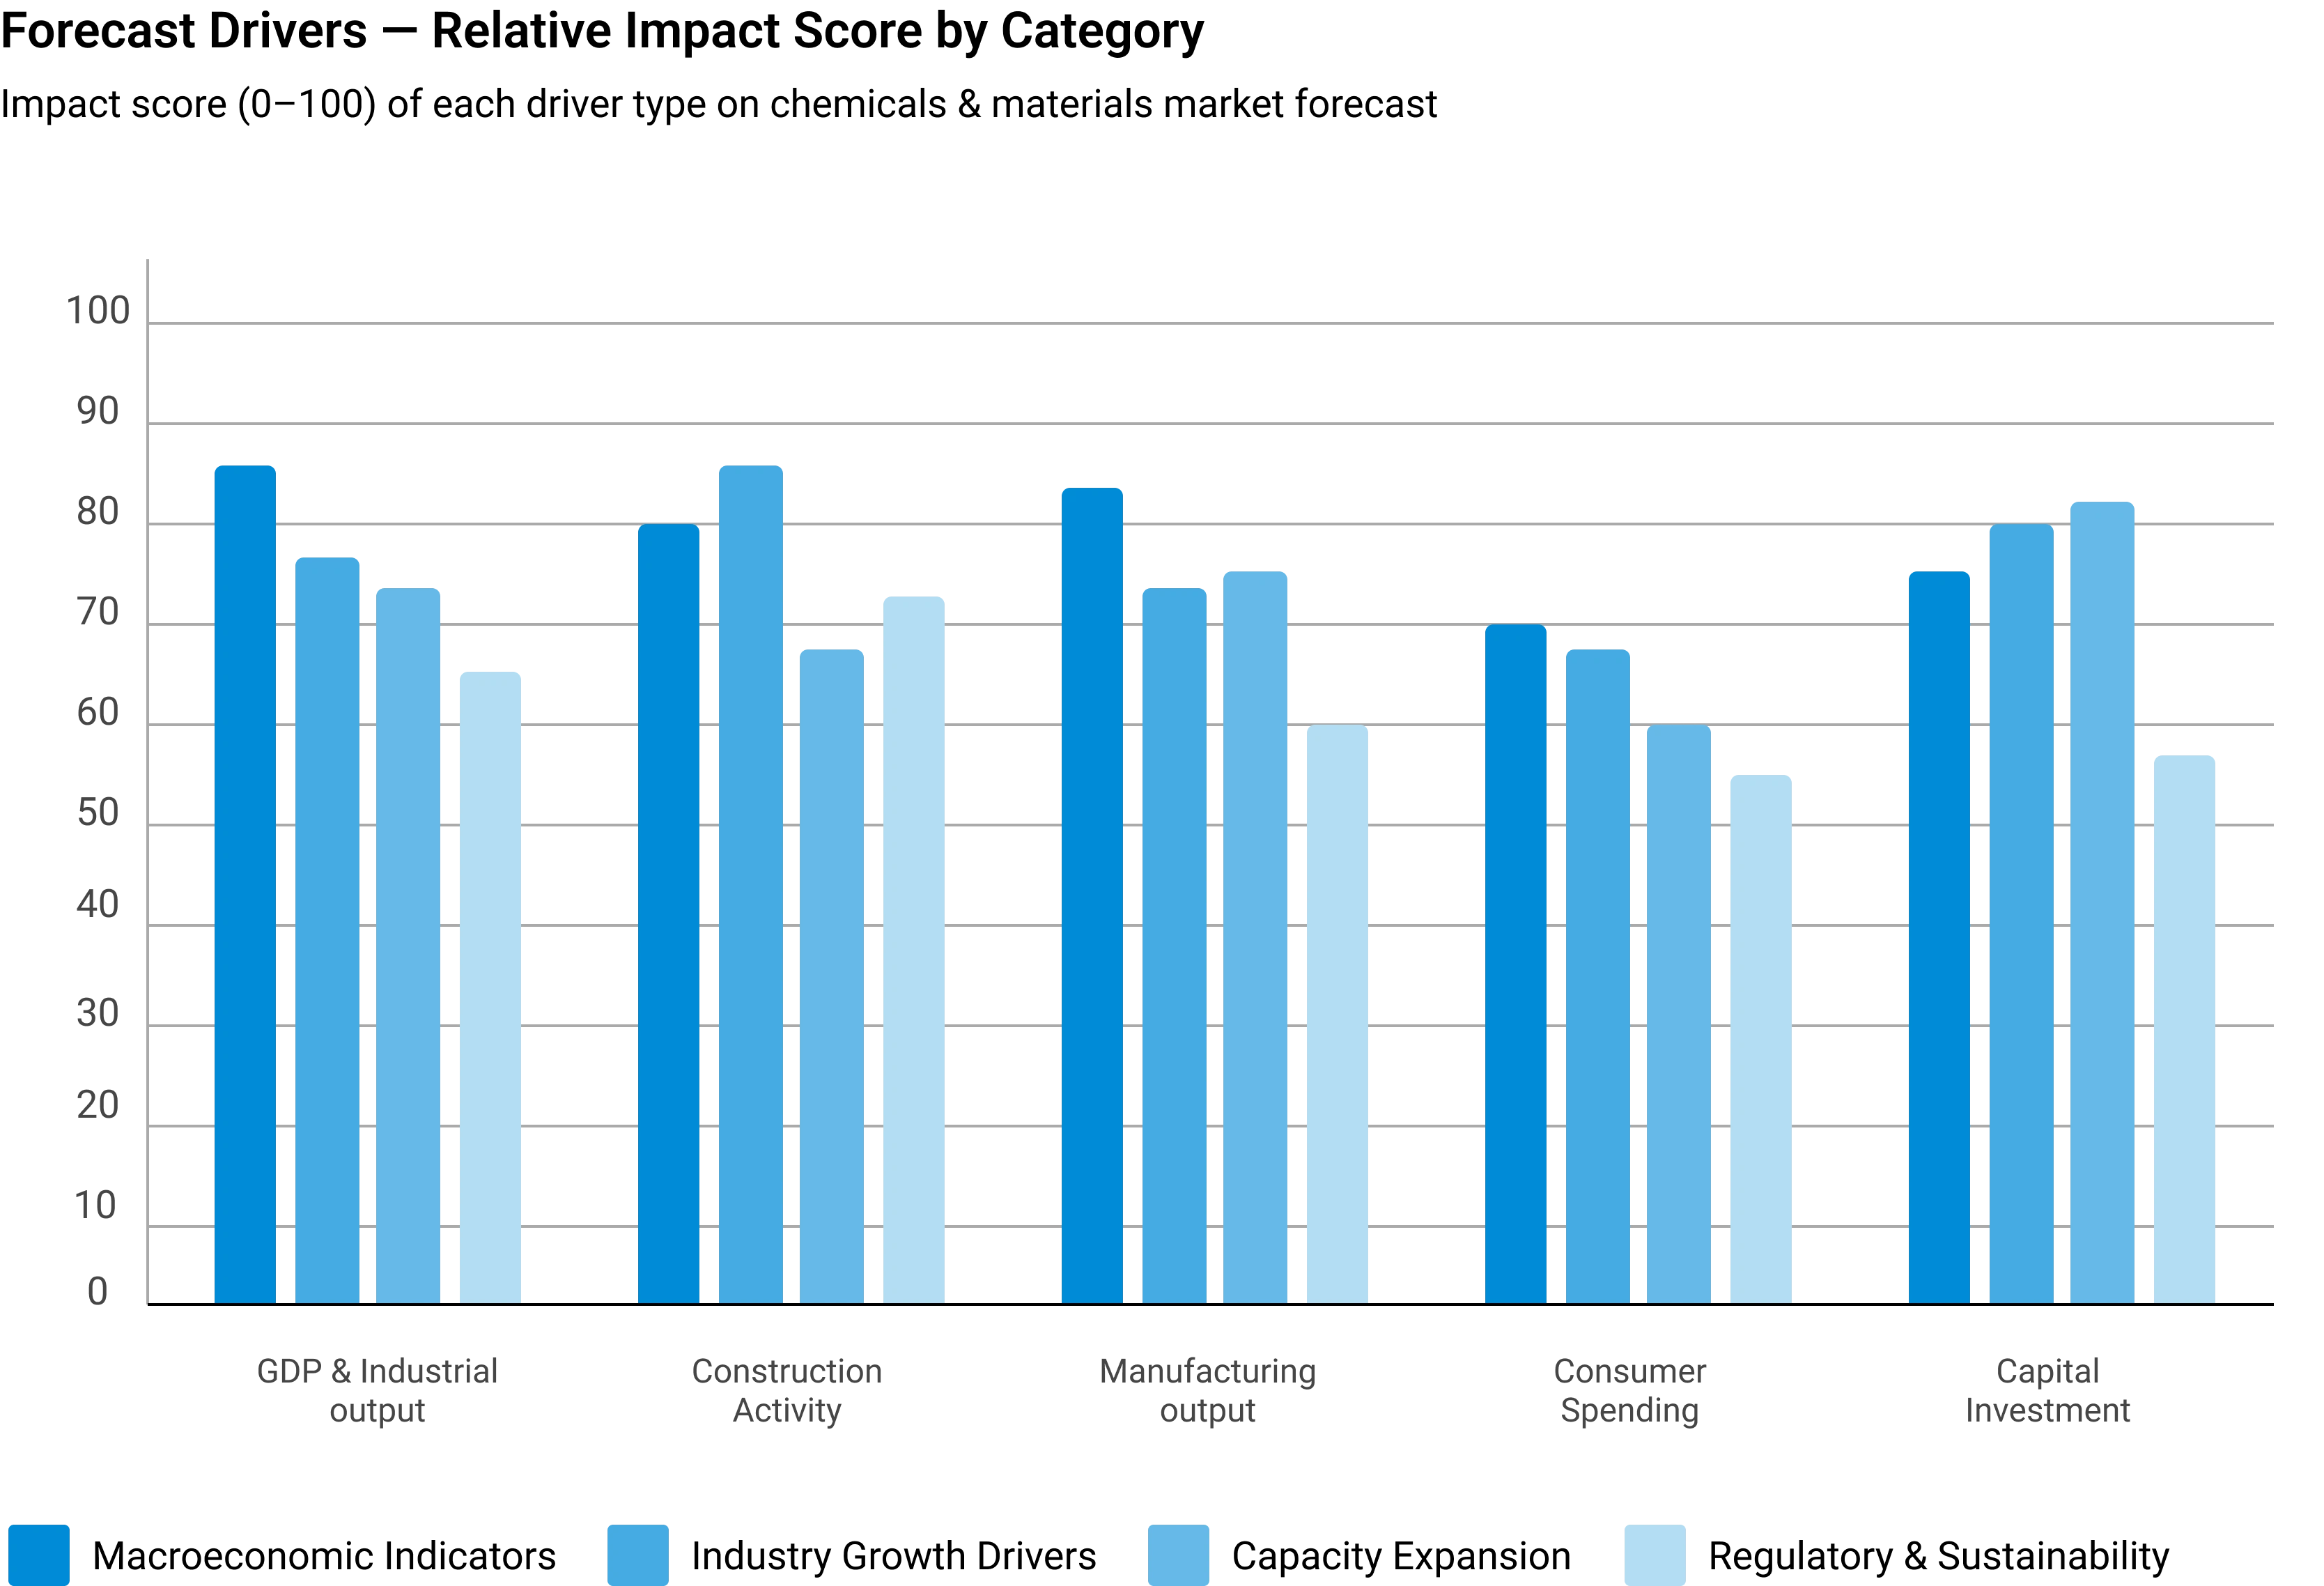
Forecasting evaluates the future trajectory of the market using a combination of quantitative indicators and qualitative assessments across economic, industry, and regulatory dimensions. Rather than simple extrapolation, each driver is independently modeled and integrated into a composite forecast.
Macroeconomic Indicators
GDP growth, industrial production, manufacturing output, construction activity, consumer spending, and capital investment form the quantitative foundation of long-term demand projections. These are applied at country, regional, and global levels.
Industry Growth Drivers
Urbanization, infrastructure development, industrialization, technological innovation, sustainability initiatives, and evolving product performance requirements are assessed at regional and industry levels — capturing both structural and cyclical demand drivers.
Capacity Expansion Analysis
Announced plant expansions, new manufacturing facilities, technology upgrades, and strategic investments are evaluated to determine future supply-demand dynamics and potential market tightness or oversupply situations.
Regulatory & Sustainability
Environmental regulations, chemical safety standards, emission reduction targets, circular economy initiatives, and sustainability requirements are incorporated as they often influence product adoption rates and market growth trajectories.
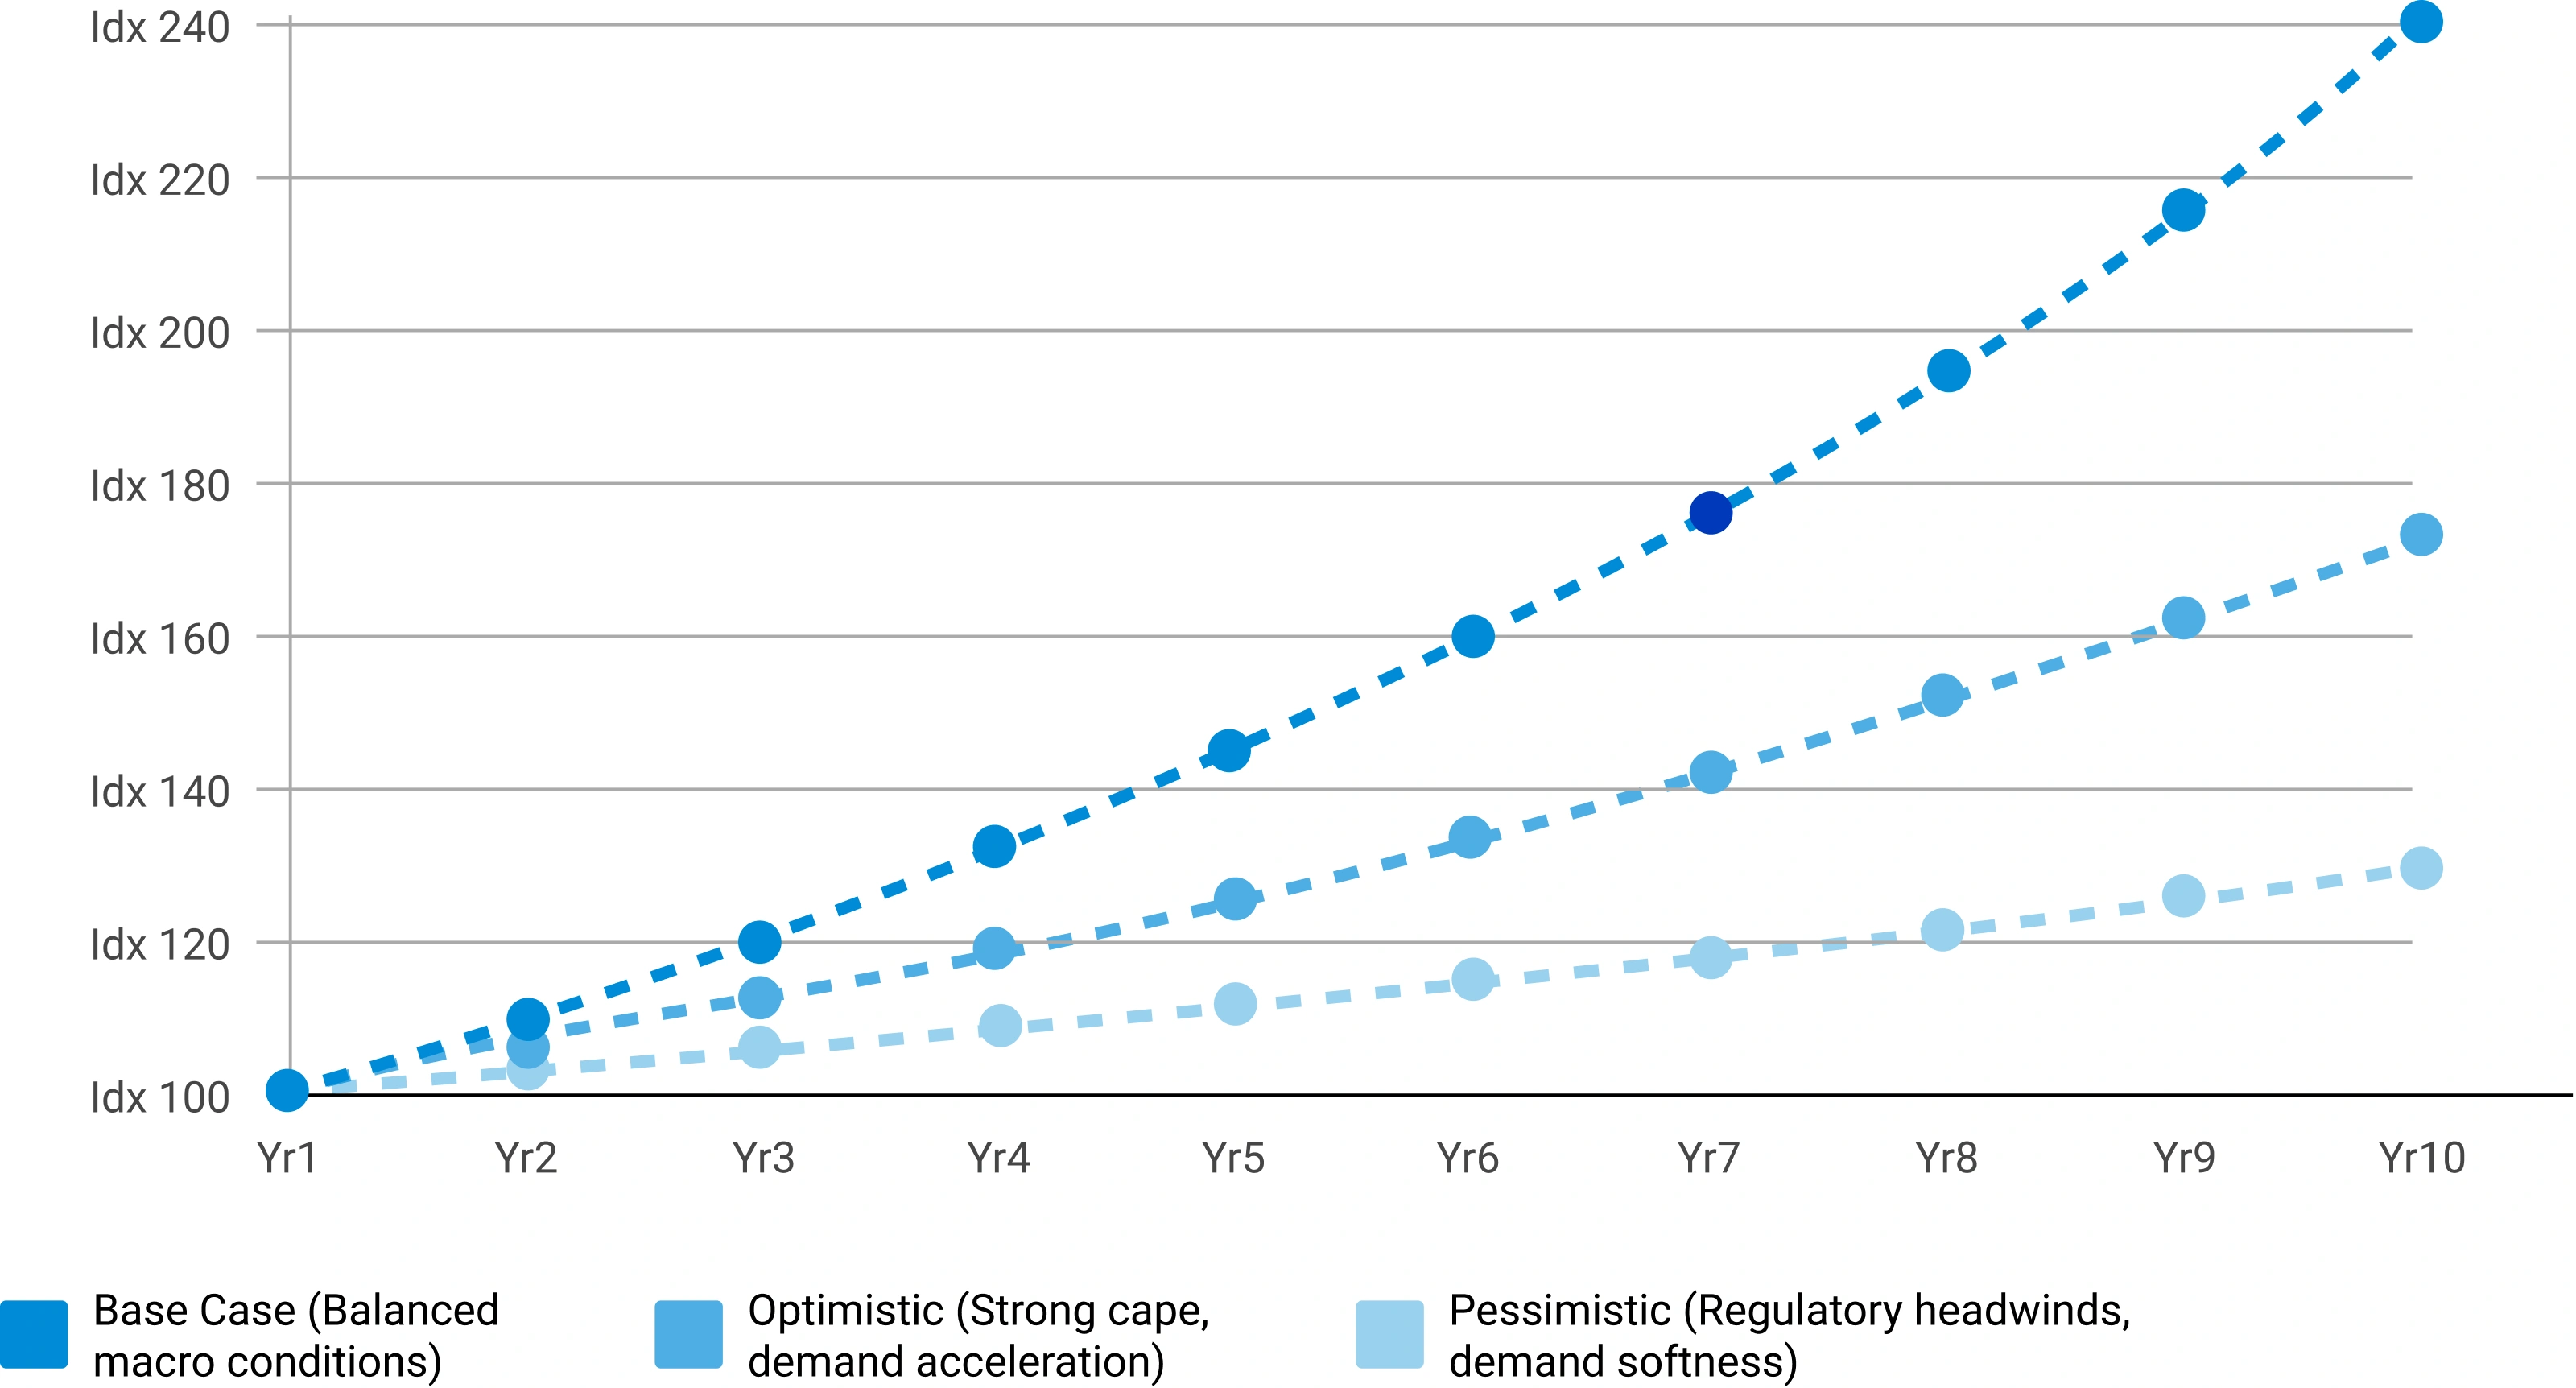
Scenario Forecast Range — Indexed Market Growth (Year 1–10)
Illustrative indexed growth trajectories across Base, Optimistic, and Pessimistic scenarios over a 10-year forecast horizon
Forecast Drivers — Relative Impact Score by Category
Impact score (0–100) of each driver type on chemicals & materials market forecast



Comments
Share your thoughts, ask a question, or provide feedback about this report.