
North America AI in Chemicals Market Trends, Share, and Growth Analysis
The North America AI in the chemicals market size was valued at USD 625.14 million in 2025, is estimated to reach USD 805.49 million in 2026, and is projected to reach USD 7885.36 million by 2035, exhibiting a compound annual growth rate (CAGR) of 28.85% over the forecast period from 2026 to 2035. The divergence reflects whether hardware, industrial automation, conventional AI, software, managed services, and scientific-AI applications are included.
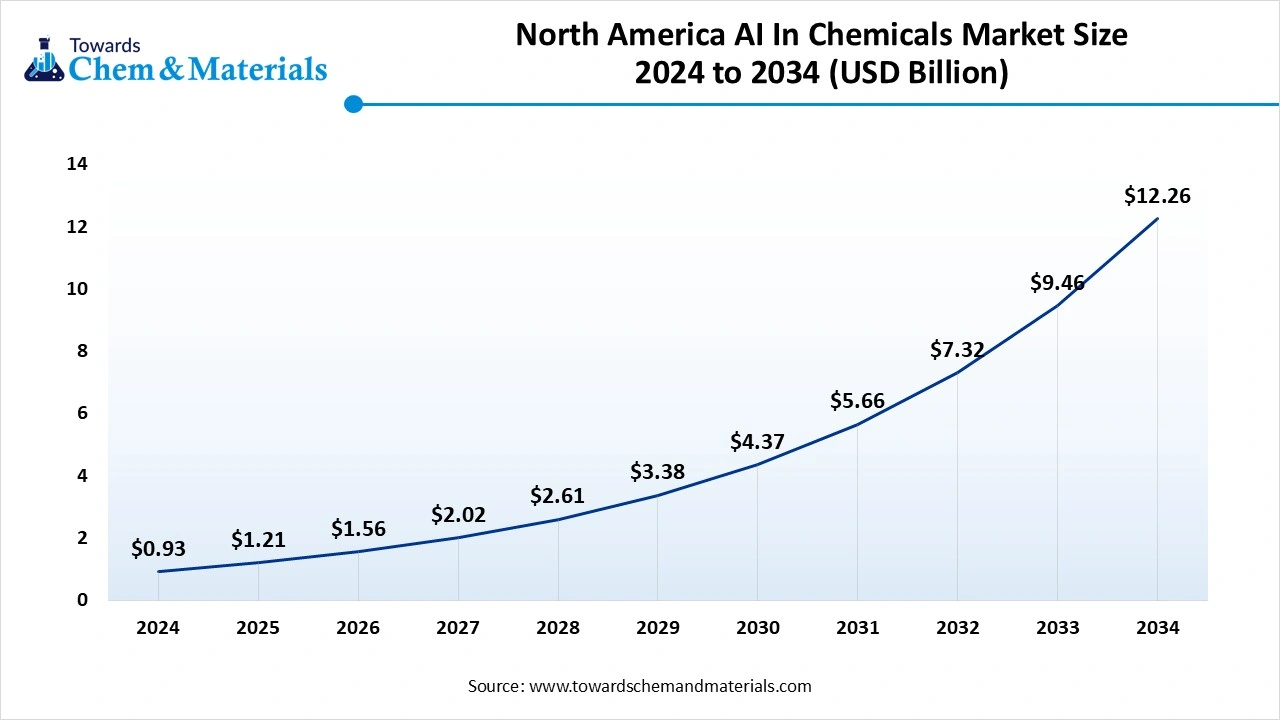
Our analysis indicates that the North American opportunity is best understood as a multi-layer market spanning AI infrastructure, industrial software, scientific discovery, process optimization, predictive maintenance, supply-chain intelligence, and generative-AI applications. Production optimization currently represents the largest application pool, while new-material innovation is among the fastest-growing areas. The United States represents the overwhelming majority of regional demand, while Canada is emerging as a faster-growing secondary market.
In our view, the strategic significance of the market is greater than its current software revenue suggests. Chemical companies are increasingly using AI to improve asset utilization, reduce process variability, accelerate R&D, and manage increasingly complex product portfolios. The full report therefore measures both direct AI market revenue and the underlying adoption economics, including AI-enabled workflows, enterprise deployments, industrial assets, R&D applications, technology maturity, and customer investment.
Key Coverage
- 2026-2035 market sizing and scenario forecasts
- U.S. versus Canada market development
- Hardware, software, services, and AI-platform economics
- Production optimization, R&D, predictive maintenance, and supply chain applications
- AI adoption and enterprise deployment maturity
- AI infrastructure, scientific AI, and industrial automation
- Competitive positioning of 20-25 relevant market participants
- Investment, partnerships, M&A, and technology white spaces
Market Size & Forecast—A Sub-$1 Billion Market Today Is Developing into a Multi-Billion-Dollar Industrial AI Opportunity
| Metric | Market benchmark |
| North America AI in Chemicals, 2024 | ~USD 479.6M |
| Alternative 2024 market estimate | ~USD 232.5M |
| North America forecast, 2030 | ~USD 2.19B |
| Reported 2025–2030 CAGR | 28.80% |
| Alternative forecast, 2029 | ~USD 1.10B |
| Alternative 2024–2029 CAGR | 36.50% |
| U.S. AI in Chemicals, 2025 | ~USD 430.1M |
| U.S. AI in Chemicals, 2033 | ~USD 3.40B |
| U.S. 2026–2033 CAGR | 29.50% |
The U.S. market alone is estimated at approximately USD 430 million in 2025, with production optimization the largest application and new-material innovation the fastest-growing application category.
Our assessment is that the market is entering a scale-up phase rather than simply a high-growth phase. Even under the more conservative market definition, a CAGR above 25% implies substantial incremental spending by chemical producers, specialty-material companies, process industries, and scientific organizations. The key uncertainty is not whether AI spending will increase, but how much value will be captured by dedicated AI vendors versus cloud platforms, industrial software providers, and internal enterprise AI teams.
The full analysis provides 2019-2035 market forecasts, base/upside/downside scenarios, country-level revenue, application contribution, technology mix, deployment model, AI infrastructure spending, and incremental revenue opportunity.
Key Coverage
- Historical and forecast revenue
- 2024-2035 CAGR analysis
- U.S. and Canada forecasts
- Incremental market opportunity
- Application-level revenue
- Technology-level forecasts
- Base/upside/downside scenarios
Segmentation Analysis—Production Optimization Leads Today, but Scientific Discovery Is Building the Higher-Value Growth Pool
The North American market is segmented across AI hardware, software, managed/professional services, predictive analytics, process optimization, predictive maintenance, supply chain management, new material innovation, R&D, quality control, and commercial applications. Hardware currently represents a significant revenue pool in broad market definitions, while software and managed services capture increasing value as enterprises move from infrastructure investment toward recurring AI workflows.
| Segment | Current position | Growth implication |
| Production optimization | Largest application pool | Core industrial adoption engine |
| Predictive maintenance | Scaling | High recurring operational value |
| Supply-chain AI | Scaling | Strong enterprise demand |
| R&D / discovery | Emerging-high value | Potentially transformational |
| New-material innovation | Fast-growing | Premium scientific AI opportunity |
| Quality/process control | Scaling | Strong plant-level adoption |
| AI hardware/infrastructure | Large revenue pool | Compute-intensive growth |
| Managed AI services | Rapidly expanding | Deployment bottleneck opportunity |
Our analysis indicates that production AI provides the market's adoption foundation, while scientific AI provides its strategic upside. Production use cases can often be justified through measurable efficiency, uptime, and quality improvements, whereas discovery applications can potentially affect product launches and revenue growth.
The report quantifies each segment by revenue, CAGR, deployment intensity, customer type, use case, technology, and country, identifying where incremental spending is likely to concentrate.
Key Coverage
- Offering segmentation
- Application segmentation
- Technology segmentation
- Business-function adoption
- Deployment model
- Customer/end-user segmentation
- Fastest-growing value pools
Market Dynamics—AI Is Moving from Cost Reduction toward Revenue, R&D, and Process Transformation
AI adoption in chemicals has historically concentrated on predictive analytics, automation, and process optimization. The next phase is broader: chemical organizations are applying AI to R&D, commercial intelligence, customer acquisition, formulation, supply chains, and technical knowledge. Industry evidence indicates that 51% of U.S. manufacturers were already using AI in daily operations, while 80% considered AI essential to maintaining or growing their business by 2030.
At the same time, chemical-industry adoption remains below many technology-intensive sectors. Generative AI exposure in energy and materials has been estimated at approximately 14%, versus 23% across industries, indicating a significant adoption gap. Potential value from generative AI across commercial, R&D, operations, and support activities has been estimated at USD 80-140 billion globally for energy and materials, although this represents potential economic value rather than directly addressable AI-market revenue.
Our analysis indicates that the central market dynamic is a shift from isolated AI use cases toward enterprise-wide data and workflow integration. In our view, the strongest adoption opportunity will occur where AI is embedded into existing manufacturing, laboratory, engineering, and commercial systems rather than deployed as a standalone chatbot.
Key Coverage
- Adoption drivers and inhibitors
- AI maturity by business function
- ROI expectations
- Digital-readiness gaps
- GenAI versus conventional AI
- Enterprise versus plant-level deployment
- High-value use cases
Pricing Analysis—AI Economics Are Shifting from Software Licenses toward Compute, Workflow, and Outcome-Based Pricing
Unlike conventional chemicals, AI in chemicals has no single physical ASP. Pricing is determined by software subscriptions, enterprise licenses, user seats, API/inference consumption, cloud compute, managed services, implementation fees, and scientific-computing usage.
Our assessment is that pricing power will increasingly correlate with workflow specificity and measurable business outcomes. Generic AI functionality is likely to experience greater price competition as foundation models become widely accessible, whereas chemistry-specific models, validated scientific workflows, and industrial AI applications can support premium economics when they demonstrably reduce development time, improve process yield, or lower maintenance costs.
| Pricing metric | Typical economic role |
| Per-seat subscription | Enterprise productivity |
| Annual enterprise license | Industrial/scientific software |
| API/inference consumption | AI applications |
| Compute consumption. | Scientific/HPC workloads |
| Managed service | Implementation and operations |
| Outcome-based pricing | High-value optimization |
| Professional services | Integration/customization |
The full report benchmarks pricing architecture, enterprise contract structures, software versus services mix, compute economics, implementation costs, and expected ROI by application.
Key Coverage
- AI software pricing
- Subscription and license models
- Compute economics
- Managed services
- Implementation costs
- ROI and payback
- Premium versus standardized AI capabilities
Demand-Supply Analysis—Demand for AI Capability Is Rising Faster Than the Availability of Integrated Industrial Deployment Expertise
North American chemical producers possess substantial digital infrastructure, but AI deployment requires integration across plant data, historians, laboratory systems, ERP, MES, supply chain platforms, engineering models, and enterprise knowledge repositories. This creates a supply-side bottleneck: access to models is increasingly commoditized, while implementation expertise and high-quality industrial data remain scarce.
Our analysis suggests that the market is therefore constrained less by the availability of AI models than by enterprise readiness. Data fragmentation, cybersecurity, model validation, legacy systems, and shortages of personnel capable of combining chemistry/process engineering with AI can extend deployment cycles.
In our view, this creates a structural opportunity for integrated providers offering AI models, industrial software, data engineering, and implementation as a single solution. The report benchmarks deployment time, use-case conversion, integration requirements, AI infrastructure availability, and customer readiness across major application categories.
Key Coverage
- Demand by industry/application
- AI deployment pipeline
- Enterprise readiness
- Data bottlenecks
- AI talent requirements
- Integration capacity
- Implementation lead times
Value Chain & Supply Chain - The Highest Strategic Value Is Shifting toward the Integration Layer
The AI-in-chemicals value chain extends from semiconductor/compute infrastructure → cloud platforms → foundation models → industrial/scientific AI software → chemical data → workflow integration → laboratory/plant deployment → measurable operational or R&D outcomes.
Our assessment is that value capture will increasingly concentrate at the integration layer. Model access alone provides limited differentiation when customers require secure connections to proprietary process data, chemical structures, equipment histories and experimental results. Providers capable of integrating AI into validated workflows can capture recurring software and service revenue while increasing customer switching costs.
Key Coverage
- AI technology value chain
- Data and model suppliers
- Industrial software
- Systems integration
- Laboratory and plant deployment
- Margin pools
- Bottlenecks and switching costs
Technology & Innovation - Scientific AI, Digital Twins and Agentic Systems Are Expanding the Addressable Market
The technology stack is progressing from conventional machine learning toward foundation models, multimodal AI, digital twins, generative chemistry, AI agents and autonomous scientific workflows. Scientific AI is particularly relevant to specialty chemicals, materials, formulations and R&D-intensive businesses because it can generate and evaluate candidates rather than simply analyze historical production data.
Our analysis indicates that the largest technological inflection is the convergence of AI with simulation and physical experimentation. This enables workflows in which AI generates a candidate, simulation evaluates it, laboratory systems validate it and the resulting data feeds the next optimization cycle.
Key Coverage
- Foundation models
- Generative AI
- Predictive ML
- Digital twins
- Scientific computing
- AI agents
- Autonomous experimentation
- Patents and R&D
- Technology maturity
Regulatory & Sustainability Analysis - Compliance, Cybersecurity and Decarbonization Are Becoming AI Adoption Drivers
AI adoption in North American chemicals intersects with environmental compliance, process safety, cybersecurity, intellectual-property protection, data governance and increasingly stringent sustainability requirements. AI can support energy optimization, emissions monitoring, waste reduction, predictive maintenance and process control, while governance requirements create additional deployment costs.
Our view is that regulatory pressure will increasingly shift AI from an optional productivity investment toward an operational-control technology. Where AI can simultaneously reduce energy consumption, improve process stability and strengthen environmental reporting, the business case becomes broader than labor productivity.
Key Coverage
- AI governance
- Industrial cybersecurity
- IP/data protection
- Environmental compliance
- Energy optimization
- Carbon reduction
- Process safety
- Sustainable-material development
Customer & Application Analysis - Manufacturing Provides the Initial ROI, but R&D and Materials Discovery Offer Higher Strategic Upside
The largest customer opportunity is concentrated among large integrated chemical producers, specialty chemical manufacturers, advanced-material companies, petrochemical operators and R&D-intensive organizations. Purchasing decisions are increasingly influenced by measurable ROI, cybersecurity, integration capability, technical validation and the ability to operate within existing enterprise architecture.
Our analysis indicates a two-speed adoption curve: production and maintenance applications scale through operational ROI, while discovery and R&D applications scale through scientific validation. The latter may require longer qualification cycles but can create substantially greater strategic value if AI reduces development time or improves the probability of successful product discovery.
Key Coverage
- Customer segmentation
- Application share
- R&D versus operations
- Purchasing criteria
- Qualification cycles
- Switching costs
- AI ROI
- Customer concentration
Competitive Landscape - Global AI Platforms, Industrial Software Leaders and Chemistry Specialists Are Converging on the Same Chemical Workflows
The North American competitive structure is unusually fragmented because AI capability is distributed across hyperscalers, industrial automation vendors, scientific software companies, AI-native chemistry specialists, enterprise software providers and chemical manufacturers developing proprietary systems.
Our analysis indicates that competition is not yet a simple race for market share. Different participants control different layers of the value chain: cloud providers control compute and AI infrastructure; industrial software companies control plant workflows; scientific platforms control chemistry and simulation; and chemical producers control proprietary data and real-world experimentation.
Key Coverage
- Competitive concentration
- Vendor archetypes
- Revenue exposure
- Technology depth
- Customer reach
- Product breadth
- Regional positioning
- Strategic partnerships
Tentative Leading Company Universe - 25 Participants Shape the North American AI-in-Chemicals Ecosystem
| Company | Headquarters | Market Position | Core Strength | Major Applications | |
| 1 | Microsoft | U.S. | AI/cloud platform | Azure, enterprise AI | R&D, copilots, agents |
| 2 | NVIDIA | U.S. | AI infrastructure | GPUs, scientific computing | AI/HPC |
| 3 | Amazon Web Services | U.S. | Cloud AI | Cloud, AI services | Enterprise/scientific AI |
| 4 | U.S. | AI platform | Foundation models | Scientific AI | |
| 5 | IBM | U.S. | Enterprise AI | AI/data platforms | R&D, operations |
| 6 | Honeywell | U.S. | Industrial AI | Automation, process software | Plant optimization |
| 7 | Emerson | U.S. | Industrial technology | Process control | Optimization, maintenance |
| 8 | Aspen Technology | U.S. | Process software | Engineering/optimization | Chemical manufacturing |
| 9 | AVEVA | U.K. | Industrial software | Digital operations | Process industries |
| 10 | Siemens | Germany | Industrial AI | Automation/digital twins | Manufacturing |
| 11 | Schneider Electric | France | Industrial automation | Energy/process management | Operations |
| 12 | Dassault Systèmes | France | Scientific/engineering software | Simulation | Materials/R&D |
| 13 | Rockwell Automation | U.S. | Industrial automation | Factory/process systems | Operations |
| 14 | Schrödinger | U.S. | Scientific AI specialist | Molecular simulation | Discovery |
| 15 | Citrine Informatics | U.S. | Materials AI specialist | Materials/chemicals AI | R&D |
| 16 | NobleAI | U.S. | Scientific AI specialist | Chemistry/materials AI | Product development |
| 17 | Kebotix | U.S. | AI/robotics specialist | Materials discovery | Autonomous R&D |
| 18 | CuspAI | U.K./U.S. | Materials AI | Generative materials | Materials discovery |
| 19 | XtalPi | China/U.S. presence | AI-for-science specialist | AI + robotics | Chemistry discovery |
| 20 | BASF | Germany/U.S. presence | Chemical AI adopter | R&D/process scale | Chemicals/materials |
| 21 | Dow | U.S. | Chemical AI adopter | Materials/process expertise | Chemicals/materials |
| 22 | DuPont | U.S. | Specialty-material adopter | Advanced materials | Materials/R&D |
| 23 | ExxonMobil | U.S. | Energy/chemicals adopter | Process/data scale | Refining/chemicals |
| 24 | LyondellBasell | U.S. | Chemical adopter | Polymers/processes | Manufacturing |
| 25 | Eastman | U.S. | Specialty chemicals adopter | Materials innovation | Specialty chemicals |
The universe deliberately combines technology suppliers and strategically important chemical adopters because the North American market is increasingly shaped by internal AI development as well as third-party purchases.
Market Share & Competitive Ranking - Revenue Leadership Does Not Equate to AI-in-Chemicals Leadership
Precise company-level market shares remain difficult to isolate because major AI vendors report revenue across broad cloud, software and infrastructure categories rather than chemical-specific AI. For example, one major cloud/AI platform generated USD 281.7 billion in FY2025 revenue, including USD 98.4 billion from server products and cloud services, while a specialized scientific-software provider generated USD 255.9 million, including USD 199.5 million of software revenue. These figures demonstrate the enormous difference in scale between infrastructure platforms and chemistry-specific specialists, but neither represents directly comparable AI-in-chemicals revenue.
Our assessment is that market-share analysis must therefore distinguish between direct AI-in-chemicals revenue, addressable AI exposure and strategic influence. The full report provides estimated shares where defensible and otherwise uses transparent qualitative tiers rather than false precision.
Key Coverage
- Estimated vendor share
- Revenue exposure
- Top-5/top-10 concentration
- Direct versus bundled AI revenue
- Share-gain/loss analysis
- Competitive tiers
Competitive Benchmarking - Integration, Scientific Depth and Installed Industrial Relationships Are the Main Sources of Advantage
| Competitive factor | Hyperscalers | Industrial software | Scientific AI specialists | Chemical incumbents |
| Compute scale | Very high | Medium | Medium | Low |
| Chemistry depth | Medium | Medium-high | Very high | Very high |
| Plant integration | Medium | Very high | Low-medium | Very high |
| Proprietary chemical data | Medium | Medium | High | Very high |
| R&D capability | High | Medium-high | Very high | Very high |
| Enterprise reach | Very high | Very high | Medium | Very high |
| Lab automation | Low-medium | Medium | High | Medium |
| Switching barriers | Medium | High | High | Very high |
Our analysis indicates that no participant currently owns all critical layers. This favors ecosystems and partnerships, but also creates an opportunity for vertically integrated players to capture more of the AI value chain.
Product Portfolio & Technology Benchmarking - Broad Platforms Compete with Deep Chemistry Specialization
The competitive portfolio spans enterprise copilots, predictive maintenance, process optimization, digital twins, scientific simulation, molecular design, materials discovery, supply-chain AI and autonomous experimentation.
Specialized scientific platforms demonstrate the economic potential of focused AI: one major scientific-software participant reported USD 199.5 million in software revenue in 2025, with a 74% software gross margin, illustrating the economics achievable when AI and simulation are embedded into high-value scientific workflows.
Our assessment is that portfolio breadth will matter most in enterprise accounts, while scientific depth will determine premium positioning in R&D applications.
Key Coverage
- Product breadth
- Scientific specialization
- AI architecture
- Simulation
- Industrial integration
- SaaS/cloud deployment
- Product gaps
Application Competitive Benchmarking - Process AI Is the Scale Market; Scientific Discovery Is the Differentiation Market
The report benchmarks competitors across:
| Application | Principal competitive requirement |
| Production optimization | Plant integration and process expertise |
| Predictive maintenance | Asset data and reliability models |
| Supply-chain AI | Enterprise data connectivity |
| R&D discovery | Scientific models and validation |
| Materials design | Proprietary materials data |
| Formulation | Experimental datasets |
| Quality control | Sensor/data integration |
| Commercial AI | Customer and product intelligence |
Our analysis suggests that application leadership will become increasingly fragmented. A vendor can lead in plant optimization without leading in molecular discovery, while a scientific-AI specialist can command strong R&D positioning without possessing the installed base required for enterprise-scale operations.
Geographic Competitive Landscape - The United States Controls Regional Scale, while Canada Provides a High-Growth Secondary Opportunity
The United States accounted for approximately USD 430.1 million of AI-in-chemicals revenue in 2025 under one current market definition, while Canada is projected to reach approximately USD 1.03 billion by 2035 and is identified as the faster-growing North American market.
Our analysis indicates that the U.S. will remain the regional center of gravity because of its combination of chemical manufacturing, AI infrastructure, scientific R&D and enterprise software adoption. Canada represents a smaller but increasingly relevant market for AI-enabled resources, chemicals, materials and scientific applications.
Key Coverage
- U.S. regional concentration
- Canada growth
- State/province-level opportunity
- Manufacturing footprint
- R&D hubs
- Technology clusters
- Regional partnerships
Manufacturing & Capacity Benchmarking - AI Deployment Is Becoming an Extension of Existing Digital Plant Infrastructure
AI adoption is closely linked to the installed base of process-control systems, sensors, MES, historians, digital twins, laboratory systems and industrial automation. Companies with mature digital infrastructure can deploy AI faster because data is already captured and operational workflows are digitized.
Our view is that the installed digital base is therefore a leading indicator of AI commercialization. The full report benchmarks facilities, production footprints, digital maturity, AI-enabled plants, automation investments and capacity expansions across major chemical participants.
Key Coverage
- Facilities
- Production footprint
- Digitalization
- AI-enabled assets
- Automation
- Capacity expansion
- Plant-level deployment
Customer & Channel Benchmarking - Enterprise Integration Creates Stronger Retention Than Standalone AI Tools
AI purchasing is increasingly shifting toward enterprise agreements involving cloud, industrial software, professional services, cybersecurity, data integration and ongoing model management. This favors vendors with established technical-support organizations and existing relationships with chemical engineering, operations and IT departments.
Our analysis suggests that channel strategy will increasingly determine AI monetization. Direct enterprise sales are important for large chemical producers, while cloud marketplaces, industrial-system integrators and existing automation relationships can accelerate deployment among mid-sized customers.
Key Coverage
- Enterprise sales
- Cloud channels
- Industrial integrators
- Technical support
- Customer concentration
- Contract duration
- Switching costs
Which Strategic Investments Are Shifting AI in Chemicals from Standalone Tools toward Integrated Industrial Intelligence?
Recent investment activity indicates a clear shift away from standalone generative-AI applications toward integrated platforms that connect AI with proprietary data, scientific workflows, industrial assets, and enterprise decision systems. Capital is increasingly being directed toward AI-enabled industrial software, scientific discovery, autonomous experimentation, cloud and accelerated-computing infrastructure, and the integration of generative models into existing R&D and operational environments. The scale of investment is also widening the competitive field: Microsoft allocated USD 32.5 billion to R&D in FY2025, while specialist AI/materials companies are attracting targeted financing, including a USD 16 million Series C raised by a materials-AI platform.
Our analysis indicates that the strategic value of AI in chemicals is increasingly determined by workflow integration rather than model access alone. The evidence suggests that platforms capable of combining domain-specific data, simulation, experimentation, industrial software, and AI models can create stronger barriers to substitution than generic chatbot or model interfaces. Our assessment is that this favors solutions embedded directly into chemical R&D, formulation, process optimization, quality management, predictive maintenance, and autonomous laboratory workflows, where switching costs and proprietary data advantages can accumulate over time.
In our view, the most significant strategic implication is that investment priorities are moving toward AI capabilities that can demonstrate measurable industrial or scientific outcomes. This creates opportunities for technology providers that can link AI to existing enterprise and laboratory infrastructure, while chemical companies are likely to place greater emphasis on partnerships, platform integration, deployment scalability, and measurable ROI rather than experimentation with isolated AI tools. The resulting market structure is therefore likely to involve greater convergence between hyperscale AI infrastructure, industrial software, scientific-computing platforms, and chemistry-specific applications.
The full report evaluates this strategic shift through a structured review of product launches, AI partnerships, platform integrations, scientific-AI investments, autonomous-lab initiatives, enterprise deployments, and strategic capital allocation, with emphasis on investment intensity, technology maturity, deployment model, application focus, partnership rationale, and potential value-capture opportunities. The analysis also distinguishes between infrastructure-led investment, software/platform investment, chemistry-specific AI, and capital deployed by industrial adopters to identify where strategic momentum is translating into commercially relevant market development.
M&A Landscape - Future Consolidation Is More Likely to Target AI Capability Than Conventional Chemical Capacity
M&A activity in this market is likely to focus on scientific software, AI talent, proprietary datasets, process-optimization platforms, industrial automation and laboratory technologies. The relatively fragmented nature of AI capabilities creates incentives for industrial-software vendors and chemical companies to acquire specialist technology rather than develop every capability internally.
In our view, the most strategically valuable acquisition targets will be companies that possess difficult-to-replicate scientific datasets, validated models or workflow integration. The report tracks disclosed transactions by acquirer, target, transaction value, technology, application, geography and strategic rationale.
Key Coverage
- 2023-2026 transactions
- AI/software acquisitions
- Scientific-AI investments
- Technology tuck-ins
- Strategic rationale
- Vertical integration
- Future consolidation themes
Company Profiles - Financial Scale Must Be Separated from Chemical-AI Revenue Exposure
The report provides detailed profiles of the 25-company universe, including revenue, AI-relevant business exposure, R&D, product portfolio, technology, customer industries, geographic presence, facilities, partnerships, acquisitions and competitive positioning.
Selected disclosed benchmarks illustrate the range: a major diversified chemical producer generated approximately €59.7 billion in 2025 sales and €2.0 billion in R&D, while a major industrial-technology participant generated USD 37.4 billion in 2025 sales. These figures are not treated as AI-market revenue; instead, they provide context for financial capacity and strategic investment potential.
Key Coverage
- Financial profile
- AI-relevant revenue
- R&D
- Product portfolio
- Technology
- Customer exposure
- Geographic footprint
- Strategic investments
- Competitive risks
Company Strategic Positioning - Future Leadership Will Depend on the Ability to Combine Scale, Data and Scientific or Industrial Depth
The competitive universe is positioned qualitatively across Market Leaders, Technology Leaders, Scale Leaders, Scientific-AI Specialists, Industrial-AI Leaders, Regional Leaders and Emerging Challengers.
Our analysis indicates that the next phase of competition will reward companies that can combine three assets: scalable AI infrastructure, proprietary chemical/industrial data and embedded customer workflows. Technology companies possess the first asset, chemical companies possess the second, and industrial-software providers often possess the third creating a competitive environment in which partnerships and integration can be as important as standalone product capability.
Opportunity & White-Space Analysis - The Largest Untapped Opportunities Sit Between Scientific Discovery and Industrial Execution
| White-space opportunity | Commercial rationale |
| AI-native materials discovery | High R&D value and differentiated outputs |
| Formulation optimization | Direct product-performance impact |
| AI process agents | Continuous operational optimization |
| Private enterprise chemical LLMs | IP and data protection |
| Autonomous laboratories | Faster experimental throughput |
| AI-enabled digital twins | Process and energy optimization |
| Mid-market chemical AI | Underserved customer segment |
| Canada expansion | Faster regional growth |
| Sustainability AI | Compliance + efficiency value |
| AI-enabled commercialization | Links R&D to revenue growth |
Our assessment is that the most attractive white space is integrated AI that links laboratory discovery, formulation, process development and manufacturing rather than isolated point solutions.
Industry Structure - High Technology Barriers Coexist with Strong Buyer Power
| Porter force | Assessment | Market evidence |
| Supplier power | High | Dependence on compute, models and specialized AI talent |
| Buyer power | High | Large chemical enterprises have significant procurement leverage |
| New entrants | Medium | Model access lowers entry barriers; scientific validation remains difficult |
| Substitutes | Medium | Conventional analytics, simulation and engineering remain viable |
| Competitive rivalry | High | Hyperscalers, industrial software and specialists increasingly overlap |
PESTLE Analysis - Industrial Policy, Data Governance and Sustainability Are Reshaping AI Economics
- Political: Industrial competitiveness and AI infrastructure investment support adoption.
- Economic: Productivity, labor efficiency and asset utilization remain primary ROI drivers.
- Social: Workforce skills are shifting toward AI-enabled scientific and engineering roles.
- Technological: Foundation models, agents, digital twins and autonomous experimentation expand use cases.
- Legal: Data protection, IP, cybersecurity and AI governance influence deployment architecture.
- Environmental: AI can improve energy efficiency, emissions monitoring, waste reduction and sustainable-material development.
Market Attractiveness - High Growth and Strong Industrial Foundations Offset Integration and Validation Barriers
Our analysis indicates that North America remains structurally attractive because it combines the world's deepest AI ecosystem with a large, technologically sophisticated chemical industry. However, the market is not uniformly attractive: generic AI applications face greater commoditization, while chemistry-specific scientific AI and deeply integrated industrial workflows offer stronger differentiation.
The full assessment compares market growth, customer willingness to invest, technology intensity, competitive rivalry, integration requirements, regulatory exposure, recurring-revenue potential and barriers to entry across applications and customer groups.
Future Outlook - AI in Chemicals Is Moving from Predictive Optimization toward an AI-Enabled Chemical Operating System
The base case anticipates continued expansion of AI across production optimization, maintenance, supply-chain planning and enterprise knowledge management, followed by greater adoption of scientific AI, generative materials design and agentic workflows. The upside case assumes faster conversion of pilots into enterprise deployments and greater integration of AI with laboratory automation and digital twins; the downside case reflects slower ROI realization, data-quality constraints and governance barriers.
Our assessment is that the next five years will be defined less by the availability of AI models and more by the ability to operationalize them at scale. The principal future profit pools are therefore likely to sit at the intersection of AI infrastructure, industrial software, proprietary chemical data, scientific discovery and workflow integration.
Key Coverage
- 2030/2035 scenarios
- Technology adoption
- Application outlook
- U.S./Canada trajectory
- Pricing and margin outlook
- AI infrastructure requirements
- Competitive shifts
- M&A scenarios
- Future profit pools
Key Strategic Questions Addressed
- How large is the North America AI in Chemicals market today, and how does the opportunity change under different market definitions?
- What CAGR and incremental revenue opportunity can be expected through 2030 and 2035?
- How much of the market is generated by hardware, software, services and scientific AI?
- Which applications production optimization, maintenance, R&D, materials discovery or supply chain will capture the greatest incremental spending?
- What is the current AI adoption gap between chemical manufacturing and more digitally mature industries?
- Which AI technologies are moving from pilot stage into commercial-scale deployment?
- How will generative AI and agentic systems change chemical R&D and manufacturing workflows?
- What pricing and monetization models are emerging across AI software, cloud, services and scientific computing?
- Where are the principal supply-side bottlenecks in data, compute, talent and system integration?
- Which 20-25 companies have the strongest exposure to the North American AI-in-chemicals opportunity?
- How should competitive market share be interpreted when AI revenue is bundled into broader cloud, software and industrial businesses?
- Which companies have the strongest combination of AI scale, scientific expertise, proprietary data and industrial integration?
- Where are the largest technology, application and customer white spaces?
- Which AI capabilities are most likely to drive M&A and strategic partnerships?
- What technologies, applications and business models are most likely to define the North American AI-in-chemicals market through 2030-2035?
Top Key Companies
- Microsoft
- NVIDIA
- Amazon Web Services
- IBM
- Honeywell
- Emerson
- Aspen Technology
- AVEVA
- Siemens
- Schneider Electric
- Dassault Systèmes
- Rockwell Automation
- Schrödinger
- Citrine Informatics
- NobleAI
- Kebotix
- CuspAI
- XtalPi
- BASF
- Dow
- DuPont
- ExxonMobil
- LyondellBasell
- Eastman
Market Report Segmentation
By Offering
- Hardware
- AI Accelerators
- GPUs
- CPUs
- High-Performance Computing Systems
- Servers
- Storage
- Networking Infrastructure
- Edge Computing Hardware
- Software
- AI Platforms
- Machine Learning Platforms
- Generative AI Platforms
- Scientific AI Software
- Industrial AI Software
- Predictive Analytics
- Digital Twin Software
- AI Copilots
- AI Agents
- Managed & Professional Services
- AI Consulting
- System Integration
- Data Engineering
- Model Development
- Implementation Services
- Managed AI Services
- Maintenance & Support
By Technology
- Machine Learning
- Deep Learning
- Predictive Analytics
- Generative AI
- Foundation Models
- Large Language Models
- Chemistry Foundation Models
- Multimodal AI
- Graph Neural Networks
- Digital Twins
- AI Agents
- Reinforcement Learning
- Scientific Computing
- Autonomous AI
- Other
By Application
- Production Optimization
- Predictive Maintenance
- Process Optimization
- Quality Control
- Supply Chain Management
- R&D and Scientific Discovery
- New-Material Innovation
- Molecular Discovery
- Materials Design
- Formulation Optimization
- Catalyst Development
- Reaction Prediction
- Process Control
- Commercial Intelligence
- Customer Intelligence
- Regulatory Intelligence
- Energy Optimization
- Sustainability & Emissions Management
- Other
By Business Function
- Manufacturing & Operations
- Research & Development
- Laboratory
- Engineering
- Quality
- Procurement
- Supply Chain
- Sales & Marketing
- Finance
- Maintenance
- Regulatory & Compliance
- Sustainability
- Corporate Strategy
- IT
By Deployment Model
- Cloud
- On-Premises
- Hybrid
- Edge
- Private AI Infrastructure
By Customer Type
- Large Integrated Chemical Companies
- Specialty Chemical Companies
- Petrochemical Companies
- Polymer & Materials Companies
- Advanced Materials Companies
- Pharmaceutical & Life Sciences Companies
- Agrochemical Companies
- Industrial Chemical Companies
- Chemical R&D Organizations
- Universities & Research Institutes
- Small & Medium-Sized Chemical Enterprises
By Industry Application
- Commodity Chemicals
- Specialty Chemicals
- Petrochemicals
- Polymers
- Advanced Materials
- Coatings
- Adhesives
- Agrochemicals
- Battery Chemicals
- Industrial Chemicals
- Pharmaceuticals
- Personal Care Chemicals
- Other
By AI Maturity
- Pilot / Proof of Concept
- Department-Level Deployment
- Plant-Level Deployment
- Enterprise Deployment
- Multi-Plant Deployment
- AI-Integrated Enterprise
- Semi-Autonomous Operations
- Autonomous Scientific Workflows
By Pricing Model
- Per-Seat Subscription
- Annual Enterprise License
- API / Inference Consumption
- Compute-Based Pricing
- Managed Services
- Professional Services
- Outcome-Based Pricing
- Customized Enterprise Contracts
By Customer Workflow
- R&D Discovery
- Molecular Design
- Materials Design
- Laboratory Automation
- Formulation
- Process Engineering
- Manufacturing
- Quality Control
- Predictive Maintenance
- Supply Chain
- Procurement
- Sales & Marketing
- Regulatory
- Sustainability
A Seven-Phase Framework
Our methodology is designed to be universally applicable across commodity chemicals, specialty chemicals, petrochemicals, construction chemicals, coatings, electronic chemicals, industrial gases, agrochemicals, water treatment chemicals, and performance materials. Each phase builds upon the last, creating a layered validation structure that minimizes estimation error and maximizes analytical confidence.
The framework ensures comprehensive market coverage, robust cross-validation, and reliable long-term forecasting — producing market estimates that withstand scrutiny from investors, regulators, and corporate strategy teams.

Seven-Phase Framework — Analytical Effort Distribution
Relative analytical effort allocated across each phase of the Chemicals & Materials research framework

Phase 1 - Secondary Research: Establishing the Foundation
Secondary research collects and evaluates publicly available information from authoritative sources, establishing the foundational understanding of market structure, value chain dynamics, competitive landscape, and end-use demand patterns. Every source is evaluated for credibility, recency, geographic relevance, and methodological soundness before inclusion.
Industry Associations
Sources include ACC, CEFIC, ICCA, JCIA, CPCIF, and SOCMA providing production volumes, consumption trends, capacity developments, and sustainability initiatives.
Company Disclosures
Annual reports, investor presentations, earnings transcripts, and regulatory filings reveal product portfolios, manufacturing footprints, capacity expansions, and revenue segmentation.
Government Databases
National statistical offices, customs authorities, environmental agencies, and industrial production databases provide verified statistics on output, trade flows, and regulatory compliance.
Trade Databases
UN Comtrade, ITC, Eurostat, and national customs authorities enable assessment of global product movement, import dependency, and export competitiveness across regions.
Our Secondary Research Sources
- Ministry of Chemicals and Fertilizers
- European Chemicals Agency
- United States Department of Energy
- Ministry of Industry and Information Technology
- Ministry of Economy Trade and Industry
- Ministry of Trade Industry and Energy
- National Institute of Standards and Technology
- Council of Scientific and Industrial Research
- Fraunhofer Society
- National Institute for Materials Science
Phase 2 — Supply-Side Assessment: Mapping Production Capabilities
Production Capacity Analysis
All major manufacturers are assessed for existing installed capacity, planned additions, expansions, new plant announcements, and technology adoption — mapped at global, regional, and country levels.
Capacity Utilization Adjustment
Installed capacity is adjusted using utilization rates based on demand conditions, feedstock availability, plant operating rates, maintenance schedules, and regulatory restrictions.
Manufacturer Revenue Analysis
Product-specific revenues, segment-level performance, regional distribution, average selling prices, and margin trends are evaluated to establish market value estimates.
Supply-Side Assessment — Capacity vs. Effective Production by Region
Illustrative comparison of installed capacity vs. effective production volume (after utilization rate adjustment) across major regions

Phase 3 — Demand-Side Assessment: Quantifying Chemical Consumption
Demand-side analysis quantifies chemical consumption across industries, applications, and geographies — identifying where and how chemicals are consumed throughout the value chain with precision.
End-Use Industry Analysis
Chemical demand is evaluated across automotive, construction, packaging, electronics, agriculture, healthcare, consumer goods, industrial manufacturing, energy and utilities, and water treatment. Industry output, production trends, and consumption intensity are analyzed to determine demand patterns.
Consumption Modeling
Demand is estimated using measurable indicators: kilograms per vehicle, kilograms per square meter of construction, dosage per cubic meter of water treated, kilograms per hectare of agricultural land, and kilograms per ton of manufactured products. Consumption factors are validated through industry publications and primary interviews.
Application Analysis
The market is segmented by application area to understand product performance requirements, formulation trends, technology adoption, customer preferences, and regulatory requirements improving demand accuracy and segmentation granularity.
Demand-Side Assessment — End-Use Industry Demand Distribution
Illustrative distribution of chemical & materials demand across key end-use industries

Phase 4 - Trade Flow Analysis: Balancing Regional Supply and Demand
Trade flow analysis reconciles regional supply and demand estimates through import and export data, identifying net supply positions, regional dependencies, and market imbalances. It serves as an independent validation layer that tests the consistency of supply-side and demand-side estimates.
Import Analysis
Import data is evaluated to determine volumes, source countries, product dependency, regional supply gaps, and pricing trends — identifying markets that rely heavily on external supply and where domestic production is insufficient to meet demand.
Export Analysis
Export assessments reveal production surplus, export competitiveness, regional manufacturing strength, and global market participation. Export patterns also help validate domestic production estimates and identify net exporting regions.
Apparent Consumption Model
Regional consumption is assessed using the standard apparent consumption formula:
Results identify net importing regions, net exporting regions, regional deficits, and surpluses — serving as an independent validation of supply and demand estimates.
Trade Flow Analysis — Net Supply Position by Region
Illustrative apparent consumption vs. domestic production across major regions — positive gap indicates net import dependency

Phase 5 — Primary Research: The Critical Validation Layer
Primary research tests and refines findings from secondary research through direct engagement with industry participants across the supply chain, demand side, and expert community. It captures intelligence that no database or published report can provide — the real-world experience of manufacturers, buyers, and specialists operating in the market.

Supply-Side Interviews
Conversations with chemical manufacturers, raw material suppliers, contract manufacturers, technology providers, and plant operators cover production trends, capacity utilization, pricing developments, technology shifts, and competitive dynamics.

Demand-Side Interviews
Engagement with OEMs, industrial consumers, procurement managers, distributors, formulators, and end-use manufacturers focuses on consumption trends, purchasing behavior, product substitution, demand outlook, and emerging applications.

Industry Expert Consultations
Additional interviews with industry consultants, independent experts, regulatory specialists, technical professionals, and research institutions provide deeper market context and validate key analytical assumptions.
Focus Areas of Primary Research:
Market Size & Forecast Validation
Revenue estimates, volume consumption, growth rates, forecast assumptions, regional demand.Supply Chain & Value Chain Assessment
Raw material sourcing, supply chain challenges, distribution networks, procurement practices.Production & Capacity Analysis
Manufacturing capacity, utilization rates, expansion projects, plant investments.Pricing & Cost Structure Analysis
Product pricing trends, feedstock costs, energy costs, margin pressures, pricing outlook.Competitive Landscape Assessment
Volume and value estimates confirmed to be fully consistent with one another before publicationInterview Volume by Market Scope
| Study Scope | Number of Interviews |
|---|---|
| Niche Market | 20 – 30 |
| Mid-Sized Market | 30 – 50 |
| Global Market | 50 – 80 |
| Highly Fragmented Market | 80 – 120 |
Interview Details:
Category : Manufacturers, Suppliers, Distributors, End Users, Experts/Associations
Average Duration : 30–60 Minutes
Interview Mode : Video calls, telephonic interviews, expert consultations
Interview Format : Structured / Semi-Structured questionnaire
Focus Areas of Primary Research:
Market Size & Forecast Validation :
Revenue estimates, volume consumption, growth rates, forecast assumptions, regional demand.
Supply Chain & Value Chain Assessment :
Raw material sourcing, supply chain challenges, distribution networks, procurement practices.
Production & Capacity Analysis :
Manufacturing capacity, utilization rates, expansion projects, plant investments.
Pricing & Cost Structure Analysis :
Product pricing trends, feedstock costs, energy costs, margin pressures, pricing outlook.
Competitive Landscape Assessment :
Market share, competitor positioning, strategic initiatives, partnerships, acquisitions.
Primary Research — Stakeholder Coverage by Category
Distribution of interview respondents across stakeholder categories (% share from PPT data)

Primary Research — Respondent Designation Profile
Seniority breakdown of interview respondents (% share from PPT data)

Primary Research — Geographic Coverage of Interviews
Regional distribution of primary research engagement (% share from PPT data)

Phase 6 — Data Triangulation and Market Validation
No single methodology is relied upon in isolation. Multiple independent estimation approaches are combined and reconciled to ensure consistency, accuracy, and analytical defensibility. Any material deviations between approaches are investigated and adjusted through additional validation cycles.
The final market size is derived through weighted triangulation of all validated methodologies. Any material deviations between approaches are investigated and adjusted through additional validation cycles. The outcome represents the most realistic assessment of the market based on available evidence and expert confirmation ensuring that volume and value estimates are fully consistent with one another.
Triangulation Framework — Input Contribution Weight
Relative weight each sizing input contributes to the final reconciled market estimate

Phase 7 — Forecast Modeling: Projecting Future Market Evolution
Forecasting evaluates the future trajectory of the market using a combination of quantitative indicators and qualitative assessments across economic, industry, and regulatory dimensions. Rather than simple extrapolation, each driver is independently modeled and integrated into a composite forecast.
Macroeconomic Indicators
GDP growth, industrial production, manufacturing output, construction activity, consumer spending, and capital investment form the quantitative foundation of long-term demand projections. These are applied at country, regional, and global levels.
Industry Growth Drivers
Urbanization, infrastructure development, industrialization, technological innovation, sustainability initiatives, and evolving product performance requirements are assessed at regional and industry levels — capturing both structural and cyclical demand drivers.
Capacity Expansion Analysis
Announced plant expansions, new manufacturing facilities, technology upgrades, and strategic investments are evaluated to determine future supply-demand dynamics and potential market tightness or oversupply situations.
Regulatory & Sustainability
Environmental regulations, chemical safety standards, emission reduction targets, circular economy initiatives, and sustainability requirements are incorporated as they often influence product adoption rates and market growth trajectories.
Scenario Forecast Range — Indexed Market Growth (Year 1–10)
Illustrative indexed growth trajectories across Base, Optimistic, and Pessimistic scenarios over a 10-year forecast horizon

Forecast Drivers — Relative Impact Score by Category
Impact score (0–100) of each driver type on chemicals & materials market forecast




Comments
Share your thoughts, ask a question, or provide feedback about this report.