
Europe Polyethylene Market Size, Share, Trends, and Forecast Analysis
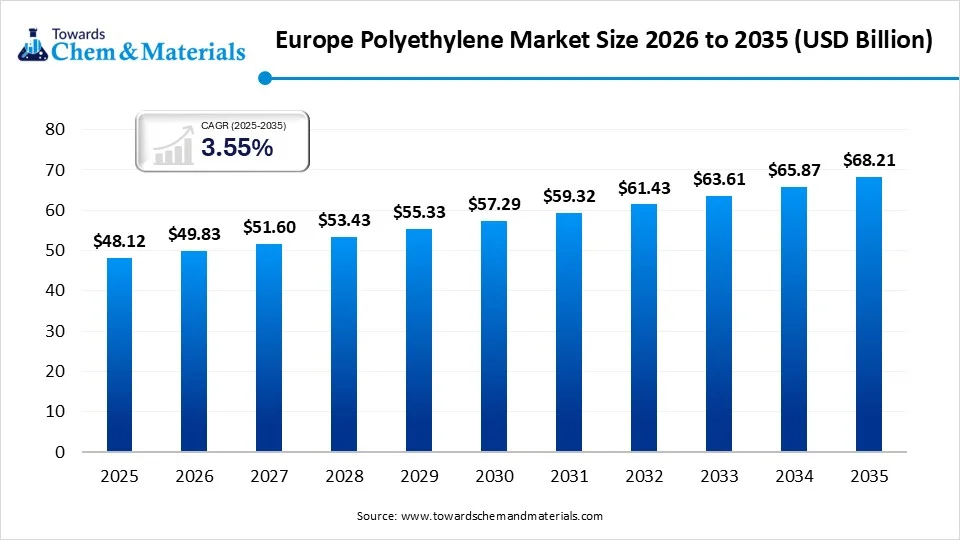
The Europe polyethylene market size was valued at USD 48.12 billion in 2025, is estimated to reach USD 49.83 billion in 2026, and is projected to reach USD 68.21 billion by 2035, exhibiting a compound annual growth rate (CAGR) of 3.55% over the forecast period from 2026 to 2035. Industry data indicates that European PE demand is approximately 16-17 million tonnes annually, representing roughly 14% of global polyethylene demand, while European PE nameplate capacity is around 16 million tonnes per year. In 2025, European PE operating rates were only about 74%, despite approximately 7% capacity rationalization, demonstrating that the market’s challenge is not simply insufficient capacity but inadequate utilization and weak producer economics. At benchmark European resin prices broadly around €900-1,200/tonne during 2025, the implied regional PE resin value pool is approximately €15-20 billion, depending on grade and market conditions.
The market is concentrated around HDPE, LDPE, and LLDPE, with HDPE/MDPE representing approximately 8.3% of European plastics production and LDPE/LLDPE approximately 13.1% in the latest polymer-level production data. Packaging remains the dominant downstream outlet, accounting for roughly 39% of European plastics conversion, while building and construction represents approximately 23%, automotive about 8%, and electrical/electronics approximately 6%. Our analysis indicates that PE demand therefore remains anchored in essential applications, but volume growth is constrained by Europe's mature industrial base, substitution pressure, lightweighting, and weaker manufacturing activity.
Our assessment is that Europe is transitioning from a volume-growth polyethylene market toward a segmented market in which cost position, asset integration, specialty grades, and circular-product capability increasingly determine profitability. The full study quantifies the market across HDPE, LDPE, LLDPE, and specialty PE grades, including revenue, volume, pricing, production, capacity, utilization, imports, exports, end-use demand, and company-level competitive exposure.
Key Coverage
- European PE market size by revenue and tonnes
- HDPE, LDPE, LLDPE, and specialty-grade segmentation
- Historical and forecast demand and production
- Capacity and utilization by country and producer
- Packaging, construction, automotive, and industrial demand
- Import dependency and regional supply imbalances
- Virgin, recycled, bioattributed, and circular PE opportunities
- Company-level capacity, market share, and competitive positioning
Market Size & Forecast—Volume Growth Is Likely to Remain Modest, Making Share Capture and Margin Expansion More Important Than Market Expansion
Global polyethylene demand reached approximately 121 million tonnes in 2026, while Europe represented roughly 13-14% of global demand. This places European consumption at approximately 16-17 million tonnes, making Europe one of the world's largest mature PE markets despite its declining share of global plastics production. European plastics production overall stabilized at approximately 54.6 million tonnes in 2024, but the region's share of global plastics production had fallen to only 12%, versus 22% in 2006. The implication is significant: Europe's PE market is large in absolute terms but increasingly exposed to lower-cost global supply.
Our analysis indicates that the European PE market is unlikely to replicate the growth rates of emerging Asian markets. Our base-case assessment points toward approximately 0.5-1.5% annual volume growth through 2030, implying a market of roughly 16.5-18 million tonnes by the end of the decade, with upside dependent on European manufacturing recovery and downside risk from further industrial contraction and import penetration. Revenue growth is likely to be more volatile than volume growth because PE pricing remains closely linked to naphtha, ethylene, crude oil, freight, and global capacity balances.
The full analysis provides historical market sizing, 2026-2030 forecasts, base/upside/downside scenarios, incremental tonnes, revenue pools, grade-level forecasts, and country-level demand and supply balances, together with sensitivity analysis for crude oil, ethylene, and imported PE prices.
Key Coverage
- 2021-2025 historical market size
- 2026 base-year estimate
- 2030 volume and revenue forecast
- CAGR and incremental tonnes
- HDPE/LDPE/LLDPE forecasts
- Country-level demand outlook
- Pricing sensitivity scenarios
- Base, upside, and downside cases
Which Polyethylene Grades Capture the Largest Volume Pools—and Where Is Europe’s Higher-Value Growth Concentrated?
European polyethylene demand is concentrated across three principal product families: HDPE, LDPE, and LLDPE. PE-HD/MD represents approximately 10% of total European polymer demand, while PE-LD/LLD accounts for approximately 14%, together representing nearly one-quarter of the regional polymer demand base. The application mix differs materially by grade: HDPE is strongly exposed to rigid packaging, containers, closures, and pipe, whereas LDPE and LLDPE have greater exposure to films, flexible packaging, agriculture, and industrial applications.
Our analysis indicates that the European PE market should not be viewed as a homogeneous commodity pool, because grade mix increasingly determines both growth exposure and value capture. LLDPE, particularly higher-performance film grades, provides opportunities to support downgauging, mechanical performance, and recyclable flexible-packaging structures, while HDPE benefits from a broader application base and infrastructure-linked demand. Our assessment is that product differentiation will become increasingly important as European producers face limited overall volume growth and persistent pressure on commodity margins; the ability to shift toward higher-specification grades can provide greater resilience than competing primarily on tonnes.
In our view, the most significant implication is that future PE opportunities are likely to be concentrated in specific grade-application combinations rather than in aggregate polymer demand. Advanced film grades, specialty HDPE, metallocene-based products, and application-specific materials can create stronger value pools where customers prioritize processing performance, downgauging, consistency, and regulatory compliance. This makes product portfolio optimization a potentially more important strategic lever than broad capacity expansion in a mature European market.
The full analysis quantifies the market across HDPE, LDPE, LLDPE, and MDPE, as well as metallocene and other differentiated PE grades, with detailed segmentation by film, blow molding, injection molding, pipe, wire and cable, packaging, construction, automotive, agriculture, and industrial applications. It provides grade-level revenue and volume, market share, growth rates, and country-level demand, enabling users to identify which product-application combinations are expanding, which remain commodity-exposed, and where higher-value segmentation opportunities are emerging.
The underlying intelligence can also be structured as a granular PE segmentation database, tracking grade, polymer type, application, country, annual volume, revenue, market share, growth rate, pricing, and end-use exposure. Users can filter and benchmark the European market by grade × application × geography, providing a quantitative view of where demand is concentrated and where differentiated PE products can capture incremental value.
Market Dynamics—Europe's PE Economics Are Being Reshaped by Global Oversupply Faster Than by Domestic Demand Growth
European PE demand remained broadly stable in 2026, but the supply environment remained highly competitive. European PE operating rates were approximately 74%, compared with 72% in 2024, even after capacity rationalization. At the global level, PE supply expanded faster than demand, with approximately 3.5 million tonnes of additional global capacity added in 2025, while global demand increased by about 2.7%. This imbalance is particularly relevant for Europe because PE is more globally traded than several other polymer categories.
Our assessment is that the primary structural risk is margin compression rather than physical product shortage. European producers face high energy and feedstock costs while competing with imported material from regions with advantaged ethane, gas, or integrated feedstock positions. At the same time, downstream European demand is concentrated in relatively mature sectors. This creates pressure for permanent capacity rationalization, portfolio optimization, and movement toward specialty products.
Key Coverage
- Demand growth and macroeconomic sensitivity
- Ethylene and naphtha exposure
- Capacity rationalization
- Import competition
- Energy-cost impact
- Packaging and construction demand
- Specialty-grade opportunities
- Margin-cycle analysis
Pricing Analysis—European PE Prices Remain Closely Linked to Ethylene and Global Supply, With Grade Premiums Creating the Main Margin Differentiator
European benchmark prices during 2026 generally ranged around €900-1,300/tonne, depending on grade, application, and timing. Indicative Central and Eastern European benchmarks in 2025 showed HDPE film around €935-1,170/tonne, LDPE film around €980-1,275/tonne, LLDPE around €930-1,120/tonne, and pipe-grade HDPE around €1,090-1,300/tonne. The range illustrates how product specification and application can create meaningful price differentiation even within commodity PE.
Our analysis indicates that European PE pricing will remain structurally volatile rather than move along a simple inflationary trajectory. Ethylene settlements, naphtha, crude oil, freight, import parity, and plant operating rates will continue to establish the commodity price floor, while specialty grades, food-contact qualification, metallocene technology, and technical-service requirements provide opportunities for premium realization.
The full report benchmarks monthly and annual price movements, grade-level ASPs, regional spreads, raw-material pass-through, producer margins, distributor economics, and virgin-versus-recycled PE price differentials, including sensitivity to feedstock and import-price changes.
Key Coverage
- HDPE, LDPE and LLDPE price benchmarks
- €/tonne by grade and region
- Ethylene-to-PE spread
- Naphtha and crude-oil sensitivity
- Import-parity pricing
- Producer margin benchmarks
- Virgin versus recycled PE premiums
- Pricing outlook through 2030
Demand-Supply Analysis - Europe Has Adequate Nominal Capacity but Insufficient Utilization to Sustain Its Historical Cost Position
With approximately 16 million tonnes of European PE capacity and operating rates of only about 74% in 2026, Europe has a substantial installed manufacturing base relative to domestic consumption. Capacity rationalization of approximately 7% helped raise utilization modestly from 2024, but supply remained adequate, and import pressure remained elevated. Broader EU polymer trade data also shows that the region recorded a net import position of approximately 0.2 million tonnes in 2024, reinforcing the shift from historical export strength toward greater external dependence.
In our view, the key supply-side question is no longer whether Europe has enough polyethylene capacity, but which assets can operate competitively through the cycle. Integrated crackers, efficient logistics, advantaged feedstock access and proximity to large converter clusters should increasingly determine asset survival, while older high-cost assets face greater rationalization risk.
Key Coverage
- Capacity by country and producer
- Operating rates and utilization
- Production versus consumption
- Supply-demand surplus/deficit
- Capacity closures and additions
- Import dependency
- Regional supply gaps
- Asset competitiveness
Value Chain & Supply Chain - Feedstock Integration and Logistics Account for a Disproportionate Share of European PE Competitiveness
The European PE value chain runs from crude oil/LPG/naphtha → ethylene → polymerization → PE resin → compounding/conversion → packaging, pipe, film, automotive and industrial products. Feedstock and energy remain the dominant upstream cost drivers, while polymerization technology, plant scale, integration, and logistics determine conversion economics. The industry's geographic structure is consequently built around integrated petrochemical clusters rather than isolated PE plants.
Our assessment is that integration is becoming a strategic advantage rather than simply an operating preference. Producers able to combine crackers, polymerization, utilities, storage, and logistics can reduce exposure to external ethylene and optimize feedstock flows. Conversely, geographically isolated plants can face higher delivered costs and greater vulnerability to supply disruptions.
Key Coverage
- Cost structure from ethylene to PE
- Feedstock sourcing
- Polymerization economics
- Logistics and storage
- Converter relationships
- Margin pools
- Supply-chain bottlenecks
- Integration advantages
How Is Rising Import Penetration Reshaping European PE Pricing, Capacity Utilization and Competitive Positioning?
Europe’s PE market is increasingly exposed to global trade flows as new capacity remains concentrated in cost-advantaged regions and international supply remains highly liquid. In 2025, European producers faced significant import pressure despite broadly stable regional demand, while the United States accounted for approximately 19% of Europe’s external polymer imports in 2024. This combination of relatively mature demand and expanding access to globally competitive material increases the importance of delivered-cost economics, trade corridors and grade-level substitutability in determining European market conditions.
Our analysis indicates that import penetration is becoming a structural competitive variable rather than a short-term supply-balancing mechanism. Higher exposure to imported PE can place downward pressure on regional reference prices and reduce utilization at higher-cost European assets, particularly where products are readily substitutable. Our assessment is that the impact will vary materially by grade: commodity PE with limited differentiation is more exposed to international arbitrage, while qualified grades supported by technical performance, customer relationships, supply reliability or application-specific specifications can retain greater pricing and volume resilience.
In our view, the strategic implication is that European producers will need to manage portfolio exposure to traded commodity grades alongside delivered-cost competitiveness. Rather than defending every tonne of structurally challenged capacity, opportunities may increasingly center on grades and applications where qualification requirements, service intensity or supply security reduce import substitution. This makes import penetration, freight-adjusted pricing and trade-policy exposure critical inputs into capacity, sourcing and portfolio decisions.
The full report quantifies PE import and export volumes and values, major trade corridors, source countries, EU trade balances and import penetration by grade, alongside freight-adjusted delivered costs, tariff and trade-policy exposure and import-substitution opportunities. The analysis also benchmarks trade flows against European production, demand and utilization to identify where external supply is exerting the greatest competitive pressure and which PE segments remain comparatively protected.
The underlying intelligence can be structured as a granular European PE trade-flow database, tracking country, origin, destination, PE grade, annual import/export volume, trade value, unit value, freight component, tariffs, trade balance and import penetration. Users can filter and benchmark flows by grade, country, origin, year, providing a quantitative view of competitive exposure, sourcing dependencies and potential import-substitution opportunities.
Technology & Innovation - Polymerization Technology Is Shifting From Commodity Efficiency Toward Specialty Performance and Circular Compatibility
PE technology differentiation increasingly centers on catalyst systems, molecular-weight distribution, comonomer control, metallocene technology, reactor configuration, and process efficiency. The commercial objective is to produce thinner films, stronger packaging, higher-performance pipes, improved sealability, and more recyclable mono-material structures without increasing material consumption.
Our assessment is that technology will increasingly protect margins rather than simply expand volume. Advanced PE grades that enable downgauging, improved barrier performance, higher recycled-content integration, or demanding food-contact and medical applications can command stronger customer relationships than conventional commodity grades. Circular-feedstock compatibility is becoming another technology axis as recycled-content obligations increase.
Key Coverage
- HDPE, LDPE and LLDPE technologies
- Catalyst platforms
- Metallocene PE
- Reactor technologies
- Product innovation
- Patent activity
- Circular and bio-attributed PE
- Technology licensing
Will Circular Polyethylene Demand Outpace Virgin PE Growth as European Recycled-Content Requirements Tighten?
Europe’s regulatory framework is creating a structural demand pool for recycled polyethylene, with the EU Packaging and Packaging Waste Regulation requiring minimum recycled content of 35% by 2030 for plastic packaging outside specified categories, rising to 65% by 2040. For contact-sensitive packaging using non-PET plastics, the requirements are 10% in 2030 and 25% in 2040. At the same time, broader recyclability requirements are increasing pressure on packaging design, resin selection and the integration of recycled content. Against this backdrop, Europe produced approximately 8.7 million tonnes of circular plastics in 2024, equivalent to 15.8% of total plastics production, but circular production growth was only around 1.2% annually, highlighting a widening potential gap between regulatory demand and available circular supply.
Our analysis indicates that regulatory-driven demand for recycled PE is likely to expand faster than the underlying virgin PE market, but the addressable opportunity will be constrained by feedstock availability, collection and sorting quality, food-contact qualification and the cost competitiveness of recycled resin. The significance of the regulation therefore extends beyond mandatory recycled-content percentages: it is likely to shift purchasing criteria toward traceability, recycled-material quality, certified supply and compatibility with demanding packaging applications. Our assessment is that the market will increasingly differentiate between recycled PE volumes that are technically available and those that are commercially qualified for regulated applications.
In our view, the most significant strategic implication is that circularity is becoming a supply-chain and product-positioning issue rather than solely a compliance requirement. Producers and converters with access to reliable post-consumer and post-industrial feedstock, advanced recycling capabilities, quality-control systems and application-specific recycled grades may be better positioned to capture the incremental value created by regulation. Conversely, persistent supply constraints or unfavorable recycled-to-virgin price economics could limit adoption in the near term, creating potential gaps between mandated demand and economically viable supply.
The full report evaluates the European PE sustainability landscape across recycled-content requirements, mechanical and advanced recycling pathways, feedstock availability, circular PE production, packaging applications and regulatory timelines, quantifying the implications for demand, supply and product economics. It also assesses how regulatory requirements could reshape resin selection, packaging specifications and the competitive positioning of virgin versus recycled PE across key end-use segments and European markets.
Key Coverage
- PPWR recycled-content requirements
- Recycled PE demand opportunity
- Chemical versus mechanical recycling
- Mass-balance products
- Food-contact requirements
- Recyclability standards
- Carbon-footprint implications
- Circular PE pricing premiums
Customer & Application Analysis - Packaging Dominates Volume, While Infrastructure and Specialty Applications Provide More Durable Value Pools
Packaging represents approximately 39% of European plastics conversion, while construction accounts for roughly 23%, automotive approximately 8%, and electrical/electronics about 6%. For PE specifically, packaging is particularly important because LDPE and LLDPE are extensively used in flexible films, while HDPE serves bottles, containers, closures, and rigid packaging. Construction provides a more durable demand pool through pipes, conduits and geomembranes.
Our analysis indicates that customer economics are increasingly bifurcated: large packaging converters remain highly price-sensitive, while pipe, medical, food-contact, specialty film and engineered applications place greater emphasis on consistency, certification, processing performance and technical support. This creates different switching barriers and margin opportunities by application.
Key Coverage
- Application market share
- Packaging subsegments
- Film and pipe demand
- Customer purchasing criteria
- Qualification requirements
- Switching costs
- Distributor/direct-sales mix
- High-value application opportunities
Competitive Intelligence
Competitive Landscape - Scale, Integration and Specialty PE Capability Are Becoming the Core Sources of Competitive Advantage
The European PE competitive structure is concentrated around a relatively small group of integrated petrochemical and polyolefin producers, supplemented by regional specialists and international suppliers. Public capacity disclosures show that selected major producers operate 1-2+ million tonnes of PE capacity in Europe, while the broader European nameplate base is approximately 16 million tonnes. One major producer reported approximately 2.1 million tonnes of European PE capacity at year-end 2025, while another operates approximately 2 million tonnes, including roughly 1 million tonnes each of HDPE and LD/LLDPE.
Our assessment is that scale alone is no longer sufficient to create sustainable advantage. The strongest competitive positions increasingly combine large-scale production with cracker integration, differentiated grades, geographic reach, circular feedstocks and embedded customer relationships. Competitive pressure is therefore shifting from simple capacity ownership toward cost position × utilization × product mix × customer stickiness.
Tentative Leading Company Universe - 22 Companies Shaping European Polyethylene Supply
| # | Company | Headquarters | Market Position | Core Strength | Major Applications/Segments |
| 1 | Borouge International | Vienna, Austria | Global polyolefin platform with major European footprint | Integrated polyolefins, specialty PE | Packaging, infrastructure, mobility |
| 2 | LyondellBasell | Rotterdam, Netherlands | Major European PE producer | Scale, technology, catalysts | Packaging, pipe, industrial |
| 3 | INEOS | London, UK | Major integrated European producer | 2 Mt European PE capacity | HDPE, LDPE, LLDPE |
| 4 | TotalEnergies | Courbevoie, France | Major integrated producer | Refining–cracker–polymer integration | Packaging, industrial |
| 5 | Dow | Midland, US | Major multinational supplier | PE technology and specialty grades | Packaging, infrastructure |
| 6 | SABIC | Riyadh, Saudi Arabia | Global PE supplier with European production | Advanced PE and global feedstock access | Packaging, industrial |
| 7 | ExxonMobil | Spring, US | Global integrated PE supplier | High-performance PE | Packaging, film |
| 8 | Repsol | Madrid, Spain | Iberian integrated producer | Specialty PE and integrated complexes | Packaging, healthcare, automotive |
| 9 | Versalis | Milan, Italy | Major Italian producer | Integrated petrochemicals and circular materials | Packaging, industrial |
| 10 | ORLEN | Płock, Poland | Central European producer | Regional integration | LDPE, HDPE, packaging |
| 11 | MOL Group / TVK | Budapest, Hungary | Central European polyolefin producer | Regional production and integration | Packaging, industrial |
| 12 | BASF | Ludwigshafen, Germany | Integrated chemicals supplier | Feedstock integration and specialty materials | Industrial, packaging |
| 13 | Shell Chemicals | London, UK | Integrated feedstock and chemicals supplier | Cracker and feedstock position | Industrial chemicals and polymers |
| 14 | Braskem | São Paulo, Brazil | Global PE supplier to Europe | Bio-based and conventional PE | Packaging |
| 15 | Westlake | Houston, US | Global polymers supplier | Commodity and specialty polymers | Packaging, industrial |
| 16 | Ravago | Luxembourg | Major polymer distributor/compounder | Distribution and formulation | Industrial, packaging |
| 17 | Ducor Petrochemicals | Rotterdam, Netherlands | European polymer specialist | Polyolefin supply and distribution | Packaging, injection molding |
| 18 | PKN ORLEN / Unipetrol | Poland/Czech Republic | Central European PE platform | Regional production and integration | HDPE, LDPE |
| 19 | ExxonMobil Chemical Europe | Brussels, Belgium | Global supplier | Advanced PE and specialty films | Flexible packaging |
| 20 | Borealis legacy European operations | Vienna, Austria | European PE technology base now within BGI | Borstar technology and specialty PE | Packaging, infrastructure |
| 21 | Nova Chemicals* | Calgary, Canada | Advanced PE technology platform | Packaging-grade PE | Flexible packaging |
| 22 | Q-Chem / Qatar-linked supply | Doha, Qatar | External competitive supplier | Cost-advantaged PE | Commodity packaging |
*Nova Chemicals is included because its integration into the broader Borouge International platform materially changes the competitive structure of global PE supply into Europe.
Market Share & Competitive Ranking - Capacity Concentration Is High, but Revenue Share Depends Heavily on Grade and Geographic Mix
A capacity-based competitive benchmark indicates that the largest European PE producers individually control approximately 7-13% of regional nameplate capacity, with the leading producer at approximately 2.1 million tonnes and another major producer at approximately 2.0 million tonnes. A third major integrated producer reports approximately 1.14 million tonnes of European PE capacity. These figures demonstrate meaningful concentration at the producer level, but they should not be interpreted as audited revenue shares because companies sell different proportions of HDPE, LDPE, LLDPE and specialty grades.
Our analysis suggests that the economically relevant competitive ranking differs from a simple capacity ranking. High-utilization assets with specialty portfolios can generate greater value per tonne than larger commodity-focused platforms. The report therefore models market share at company × polymer × grade × country level, separating volume share from revenue share.
Key Coverage
- Company market share
- Capacity-based ranking
- Revenue-share estimates
- HDPE/LDPE/LLDPE share
- Top-five and top-ten concentration
- Share gains/losses
- Specialty-grade exposure
- Country-level competitive share
Competitive Benchmarking - Cost Position and Specialty Exposure Separate Scale Leaders From Margin Leaders
The leading companies are benchmarked across European PE capacity, utilization, product breadth, integration, technology, specialty exposure, geographic reach, circular portfolio, customer access and strategic investment. Scale leaders generally benefit from integrated crackers and broad customer coverage, while specialty-focused producers compete through advanced catalyst platforms, film performance, food-contact grades, pipe performance and technical service.
In our view, the most important competitive capability is the ability to shift production toward higher-value grades when commodity spreads deteriorate. This makes product flexibility and customer qualification capabilities increasingly important alongside nameplate capacity.
Key Coverage
- Capacity and utilization
- Product breadth
- Specialty-grade exposure
- Technology platforms
- Geographic footprint
- Circular PE portfolio
- Customer relationships
- Strategic investment
Product Portfolio Benchmarking - Broad Commodity Portfolios Provide Scale, While Specialty PE Creates Margin Protection
Competitive portfolios are assessed across HDPE, LDPE, LLDPE, metallocene PE, pipe grades, film grades, blow-molding grades, injection grades, wire and cable, food-contact and circular products. The analysis distinguishes companies with broad commodity coverage from those emphasizing higher-value applications.
Our assessment is that portfolio breadth will become increasingly important as European producers face uneven demand across end-use sectors. Producers able to redirect capacity between applications and offer both virgin and circular grades can potentially reduce earnings volatility.
Key Coverage
- Product breadth
- Grade coverage
- Specialty PE
- Metallocene products
- Food-contact grades
- Circular PE
- Premium applications
- Portfolio gaps
Technology & Innovation Benchmarking - Catalyst Platforms and Circular Integration Are Emerging as the Next Competitive Frontier
European producers are investing in advanced catalyst systems, metallocene PE, recyclable mono-material structures, circular feedstocks and process optimization. Technology benchmarking evaluates patents, catalyst capabilities, R&D investment, product launches, licensing relationships and commercialization.
One major European PE producer operates approximately 2 million tonnes of PE capacity, split broadly between HDPE and LD/LLDPE, while another major producer reported 2.1 million tonnes of European PE capacity in 2025. These scale positions provide a platform for technology-led grade differentiation.
Key Coverage
- Catalyst technologies
- Patent activity
- R&D investment
- Product launches
- Metallocene PE
- Circular PE
- Licensing
- Commercialization pipeline
Application Competitive Benchmarking - Packaging Is the Largest Battlefield, but Infrastructure and Specialty Applications Offer Higher Stickiness
The competitive matrix maps producers against flexible packaging, rigid packaging, pipe, construction, agriculture, automotive, wire and cable, healthcare and industrial applications. Packaging creates the largest volume pool, while pipe, healthcare, food-contact and technically demanding films generally involve greater qualification requirements.
Our analysis suggests that application specialization can partially offset commodity-scale disadvantages. Producers with strong technical service and long qualification cycles can defend customer relationships even when imported commodity resin is cheaper.
Key Coverage
- Application leaders and challengers
- Packaging positioning
- Pipe and infrastructure exposure
- Automotive exposure
- Food-contact capability
- Technical-service intensity
- Customer qualification
- Application white spaces
Geographic Competitive Landscape - Western Europe Faces Rationalization While Central and Southern Europe Retain Strategic Manufacturing Hubs
Germany, Belgium, France, Italy, Spain, the Netherlands, Poland, Austria, Portugal and the Czech Republic form the principal European PE manufacturing and demand clusters. Germany remains the largest European plastics production base, accounting for approximately 21% of European plastics production in 2023, while Belgium, France, Italy, Spain and the Netherlands provide major integrated petrochemical infrastructure.
Our assessment is that geographic competitiveness will increasingly depend on access to integrated feedstock, energy, ports and converter clusters. Central and Eastern Europe provide growth and import-substitution opportunities, while established Western European assets face greater pressure to rationalize or specialize.
Key Coverage
- Country-level capacity
- Production footprint
- Demand by country
- Import dependence
- Manufacturing localization
- Logistics corridors
- Regional expansion
- Competitive white spaces
Manufacturing & Capacity Benchmarking - Europe Is Moving From Capacity Expansion Toward Selective Modernization and Rationalization
European PE capacity is approximately 16 million tonnes annually, but utilization of about 74% highlights the gap between nameplate capacity and economically sustainable output. Capacity rationalization is already occurring across the broader petrochemical chain, with approximately 2.7 million tonnes of European cracker capacity taken offline since the beginning of 2024, equivalent to around 13% of Western European cracker capacity.
Several companies continue to invest selectively. For example, a major Iberian producer is commissioning a €657 million Sines expansion, adding 600,000 tonnes per year of PE/PP capacity, while other producers are divesting or rationalizing older European assets.
Our analysis indicates that future capacity additions will increasingly need to be specialty-led, integrated or structurally advantaged to earn acceptable returns.
Key Coverage
- Facility-level capacity
- Capacity utilization
- Plant age
- New projects
- Closures
- Modernization
- Integration
- Capex benchmarking
Customer & Channel Benchmarking - Customer Qualification and Technical Service Are Increasingly Important Defenses Against Import Competition
Large packaging converters exert substantial purchasing influence because PE is often a high-volume input with significant price transparency. However, switching barriers rise where customers require food-contact compliance, specific processing characteristics, pipe certification, film performance or long-term consistency.
Our assessment is that customer stickiness will increasingly become a strategic asset as commodity import competition intensifies. Direct technical relationships, application engineering, qualification support and reliable logistics can protect share even when headline resin prices converge.
Key Coverage
- Direct versus distributor sales
- Converter relationships
- Customer concentration
- Qualification cycles
- Technical service
- Application engineering
- Switching barriers
- Channel economics
Strategic Developments - European Producers Are Prioritizing Portfolio Restructuring Over Pure Volume Expansion
Recent strategic activity demonstrates a clear shift toward portfolio optimization. In 2026, the combination of Borealis, Borouge and NOVA Chemicals created Borouge International, forming a significantly larger global polyolefin platform. The transaction included the acquisition of NOVA Chemicals for an enterprise value of approximately $13.4 billion. Elsewhere, European assets are being divested, consolidated or restructured as producers respond to low utilization and margin pressure.
Our analysis indicates that strategic capital is increasingly flowing toward scale, advantaged feedstocks, technology and circularity rather than undifferentiated European commodity capacity.
Key Coverage
- Capacity expansions
- Plant closures
- Portfolio restructuring
- Strategic partnerships
- Technology agreements
- Circular investments
- Geographic expansion
- Divestments
M&A Landscape - Consolidation Is Rebuilding the European PE Competitive Map Around Scale and Feedstock Advantage
M&A activity is increasingly strategic rather than purely capacity-driven. The formation of Borouge International and its $13.4 billion NOVA Chemicals transaction represents a major global-scale consolidation, while the divestment of selected European assets by other large producers demonstrates the opposite strategy: reducing exposure to structurally challenged assets.
Earlier regional transactions also illustrate vertical and geographic consolidation, including the acquisition of 100 ktpa of LDPE capacity by ORLEN, giving it roughly one-third of Poland's LDPE demand at the time.
Our assessment is that future M&A is likely to concentrate on specialty PE portfolios, advantaged production assets, recycling technology and strategically located downstream capabilities rather than simply adding commodity tonnes.
Key Coverage
- Acquirer and target
- Deal value
- Capacity acquired
- Technology
- Geography
- Strategic rationale
- Divestments
- Future M&A themes
Company Profiles - Detailed Intelligence on the Leading European PE Participants
The company-level analysis profiles the leading participants across corporate structure, headquarters, employees, revenue, PE-related exposure, production capacity, facilities, product portfolio, applications, technology, R&D, patents, sustainability, circular PE, geographic footprint, financial performance, capital expenditure, strategic investments, M&A and competitive vulnerabilities.
For major producers, the report distinguishes group-level financial performance from Europe PE-specific exposure, preventing corporate diversification from obscuring the actual competitive position within polyethylene.
Key Coverage
- Corporate overview
- PE revenue exposure
- European capacity
- Facility footprint
- Product portfolio
- Applications
- R&D and patents
- Financial performance
- Capex and M&A
- Strategic positioning
Company Strategic Positioning - Future PE Leaders Will Combine Scale With Cost Advantage, Specialty Grades and Circular Capability
The strategic positioning assessment distinguishes scale leaders, technology leaders, regional leaders, specialty specialists, integrated producers and emerging challengers. The assessment considers capacity, utilization, product breadth, technology, integration, geographic exposure, customers, circular-product capability and investment activity.
Our view is that the strongest long-term positions will be built around four capabilities: competitive feedstock economics, high utilization, differentiated PE grades and access to circular feedstocks. Companies lacking at least one of these pillars may increasingly need restructuring, partnerships or portfolio specialization.
Key Coverage
- Scale positioning
- Cost position
- Technology leadership
- Specialty exposure
- Circular capability
- Geographic strength
- Customer stickiness
- Growth opportunities
Opportunity & White-Space Analysis - The Largest Opportunities Are Emerging Where European Demand Meets Structural Supply or Sustainability Gaps
The report identifies opportunities across specialty film grades, high-performance packaging, metallocene PE, recyclable mono-material structures, circular PE, Central and Eastern European supply gaps, pipe and infrastructure grades, food-contact recycled PE and import substitution.
Europe's circular plastics transition remains underpenetrated: circular plastics represented only 15.8% of European plastics production in 2024, while approximately 19% of European converter demand for circular plastics was supplied through imports. This creates a measurable opportunity for local circular-polymer production and supply-chain localization.
Key Coverage
- Specialty-grade gaps
- Circular PE
- Import substitution
- Regional capacity gaps
- Packaging innovation
- Infrastructure demand
- Recycled-content opportunity
- New production economics
Industry Structure - Competitive Rivalry Is High as Capacity, Imports and Weak Demand Pressure Producer Economics
| Force | Assessment | Market Evidence |
| Supplier Power | High | Ethylene, naphtha, energy and utilities materially affect production economics |
| Buyer Power | High | Large converters have price transparency and multiple global supply options |
| Threat of New Entrants | Low | High capital requirements, integration needs and scale barriers |
| Threat of Substitutes | Moderate | PP, PET, paper, glass and alternative packaging formats compete in selected applications |
| Competitive Rivalry | High | Low utilization, imports, capacity rationalization and limited demand growth |
The key structural feature is the combination of high fixed costs and globally traded products. This makes utilization and cost position critical determinants of profitability.
PESTLE Analysis - Energy, Trade Policy, Circularity and Industrial Competitiveness Are the External Variables With the Greatest Impact
- Political: European industrial-policy and strategic-autonomy priorities
- Economic: Energy costs, crude oil, naphtha, ethylene and manufacturing activity
- Social: Packaging consumption, lightweighting and sustainability expectations
- Technological: Advanced catalysts, metallocene PE and circular-feedstock integration
- Legal: PPWR, recycled-content obligations and recyclability standards
- Environmental: Carbon reduction, waste reduction and circular-material requirements
Market Attractiveness - Attractive Specialty Pools Coexist With Challenging Commodity Economics
The European PE market remains commercially significant because of its approximately 16-17 Mt annual demand base, broad packaging exposure and extensive converter infrastructure. However, low operating rates, high energy costs, import competition and limited volume growth constrain commodity-market attractiveness.
Our assessment is that attractiveness is increasingly segment-specific: specialty PE, circular grades, food-contact materials, advanced films and strategically located Central/Eastern European capacity offer different economics from conventional commodity PE.
Future Outlook - Europe’s PE Market Will Shift From Volume Expansion Toward Specialization, Circularity and Asset Optimization
Through 2030, the market is likely to remain broadly stable in volume, with a base-case demand trajectory of approximately 0.5-1.5% annual growth and a potential market size of approximately 16.5-18 million tonnes. Commodity pricing will remain cyclical, while specialty grades should command stronger structural premiums. Capacity is likely to rationalize further where assets lack feedstock or energy advantages.
The circular segment represents a separate growth pool. Europe's circular plastics production reached 8.7 Mt in 2024, but growth slowed materially, indicating that regulatory requirements alone will not guarantee supply expansion. Our analysis suggests that the winners of the next cycle will be producers that combine competitive virgin PE economics with differentiated grades and credible circular-feedstock platforms.
Key Coverage
- 2030 demand forecast
- Base/upside/downside scenarios
- Grade-level outlook
- Pricing and margin outlook
- Capacity rationalization
- Circular PE growth
- Geographic opportunities
- Competitive restructuring
- M&A outlook
- Emerging profit pools
Key Strategic Questions Addressed
- What is the current size of the European polyethylene market in tonnes and revenue?
- How will European PE demand evolve through 2030?
- Which countries represent the largest PE demand and production pools?
- How are HDPE, LDPE and LLDPE shares evolving?
- Which applications will contribute the greatest incremental PE demand?
- How exposed are European PE producers to global imports?
- What is the current European PE capacity and utilization rate?
- Which assets face the greatest rationalization risk?
- How do European PE prices compare by grade and geography?
- How do ethylene, naphtha and energy costs affect producer margins?
- Which companies control the largest European PE capacity positions?
- Which producers are strongest in specialty and high-value PE grades?
- How will PPWR recycled-content requirements affect PE demand and pricing?
- Where are the largest circular polyethylene and import-substitution opportunities?
- How will consolidation, capacity restructuring and M&A reshape European PE competition through 2030?
Top Key Companies
- Borouge International
- LyondellBasell
- INEOS
- TotalEnergies
- Dow
- SABIC
- ExxonMobil
- Repsol
- Versalis
- ORLEN
- MOL Group / TVK
- BASF
- Shell Chemicals
- Braskem
- Westlake
- Ravago
- Ducor Petrochemicals
- Borealis
- NOVA Chemicals
- Unipetrol
- ExxonMobil Chemical Europe
- Q-Chem / Qatar-linked suppliers
Market Report Segmentation
By Product Type
- HDPE
- Film Grade
- Blow Molding Grade
- Injection Molding Grade
- Pipe Grade
- Wire & Cable Grade
- Other HDPE Grades
- LDPE
- Film Grade
- Coating Grade
- Injection Molding Grade
- Other LDPE Grades
- LLDPE
- Film Grade
- Injection Molding Grade
- Rotomolding Grade
- Other LLDPE Grades
- MDPE
- Pipe Grade
- Film Grade
- Other MDPE Grades
- Specialty Polyethylene
- Metallocene PE
- High-Performance PE
- Food-Contact PE
- Medical-Grade PE
- High-Barrier PE
- Circular PE
- Bio-Attributed PE
- Other Specialty PE
By Technology
- Gas-Phase Polymerization
- Slurry Polymerization
- Solution Polymerization
- High-Pressure Polymerization
- Conventional Catalyst Technology
- Metallocene Catalyst Technology
- Advanced Catalyst Technology
- Other Polymerization Technologies
By Application
- Packaging
- Flexible Packaging
- Rigid Packaging
- Films
- Bottles & Containers
- Caps & Closures
- Bags & Pouches
- Food Packaging
- Industrial Packaging
- Other Packaging
- Building & Construction
- Pipes
- Conduits
- Geomembranes
- Insulation
- Construction Films
- Other Construction Applications
- Automotive
- Fuel Systems
- Interior Components
- Exterior Components
- Under-the-Hood Components
- Other Automotive Applications
- Electrical & Electronics
- Wire & Cable
- Electrical Components
- Insulation
- Other Electrical Applications
- Agriculture
- Agricultural Films
- Irrigation Pipes
- Greenhouse Films
- Other Agricultural Applications
- Healthcare & Medical
- Medical Packaging
- Medical Devices
- Pharmaceutical Packaging
- Other Healthcare Applications
- Consumer Goods
- Industrial
- Textiles
- Other Applications
By Feedstock / Material Type
- Virgin Polyethylene
- Recycled Polyethylene
- Mechanically Recycled PE
- Chemically Recycled PE
- Bio-Attributed Polyethylene
- Circular / Mass-Balance Polyethylene
- Post-Industrial Recycled PE
- Post-Consumer Recycled PE
By Grade
- Commodity PE
- Standard PE
- Specialty PE
- High-Performance PE
- Metallocene PE
- Food-Contact PE
- Medical-Grade PE
- Pipe-Grade PE
- Film-Grade PE
- Circular PE
- Bio-Based / Bio-Attributed PE
By Sales Channel
- Direct Sales
- Distributors
- Polymer Traders
- Chemical Distributors
- Online / Digital Channels
- Other Sales Channels
A Seven-Phase Framework
Our methodology is designed to be universally applicable across commodity chemicals, specialty chemicals, petrochemicals, construction chemicals, coatings, electronic chemicals, industrial gases, agrochemicals, water treatment chemicals, and performance materials. Each phase builds upon the last, creating a layered validation structure that minimizes estimation error and maximizes analytical confidence.
The framework ensures comprehensive market coverage, robust cross-validation, and reliable long-term forecasting — producing market estimates that withstand scrutiny from investors, regulators, and corporate strategy teams.

Seven-Phase Framework — Analytical Effort Distribution
Relative analytical effort allocated across each phase of the Chemicals & Materials research framework

Phase 1 - Secondary Research: Establishing the Foundation
Secondary research collects and evaluates publicly available information from authoritative sources, establishing the foundational understanding of market structure, value chain dynamics, competitive landscape, and end-use demand patterns. Every source is evaluated for credibility, recency, geographic relevance, and methodological soundness before inclusion.
Industry Associations
Sources include ACC, CEFIC, ICCA, JCIA, CPCIF, and SOCMA providing production volumes, consumption trends, capacity developments, and sustainability initiatives.
Company Disclosures
Annual reports, investor presentations, earnings transcripts, and regulatory filings reveal product portfolios, manufacturing footprints, capacity expansions, and revenue segmentation.
Government Databases
National statistical offices, customs authorities, environmental agencies, and industrial production databases provide verified statistics on output, trade flows, and regulatory compliance.
Trade Databases
UN Comtrade, ITC, Eurostat, and national customs authorities enable assessment of global product movement, import dependency, and export competitiveness across regions.
Our Secondary Research Sources
- Ministry of Chemicals and Fertilizers
- European Chemicals Agency
- United States Department of Energy
- Ministry of Industry and Information Technology
- Ministry of Economy Trade and Industry
- Ministry of Trade Industry and Energy
- National Institute of Standards and Technology
- Council of Scientific and Industrial Research
- Fraunhofer Society
- National Institute for Materials Science
Phase 2 — Supply-Side Assessment: Mapping Production Capabilities
Production Capacity Analysis
All major manufacturers are assessed for existing installed capacity, planned additions, expansions, new plant announcements, and technology adoption — mapped at global, regional, and country levels.
Capacity Utilization Adjustment
Installed capacity is adjusted using utilization rates based on demand conditions, feedstock availability, plant operating rates, maintenance schedules, and regulatory restrictions.
Manufacturer Revenue Analysis
Product-specific revenues, segment-level performance, regional distribution, average selling prices, and margin trends are evaluated to establish market value estimates.
Supply-Side Assessment — Capacity vs. Effective Production by Region
Illustrative comparison of installed capacity vs. effective production volume (after utilization rate adjustment) across major regions

Phase 3 — Demand-Side Assessment: Quantifying Chemical Consumption
Demand-side analysis quantifies chemical consumption across industries, applications, and geographies — identifying where and how chemicals are consumed throughout the value chain with precision.
End-Use Industry Analysis
Chemical demand is evaluated across automotive, construction, packaging, electronics, agriculture, healthcare, consumer goods, industrial manufacturing, energy and utilities, and water treatment. Industry output, production trends, and consumption intensity are analyzed to determine demand patterns.
Consumption Modeling
Demand is estimated using measurable indicators: kilograms per vehicle, kilograms per square meter of construction, dosage per cubic meter of water treated, kilograms per hectare of agricultural land, and kilograms per ton of manufactured products. Consumption factors are validated through industry publications and primary interviews.
Application Analysis
The market is segmented by application area to understand product performance requirements, formulation trends, technology adoption, customer preferences, and regulatory requirements improving demand accuracy and segmentation granularity.
Demand-Side Assessment — End-Use Industry Demand Distribution
Illustrative distribution of chemical & materials demand across key end-use industries

Phase 4 - Trade Flow Analysis: Balancing Regional Supply and Demand
Trade flow analysis reconciles regional supply and demand estimates through import and export data, identifying net supply positions, regional dependencies, and market imbalances. It serves as an independent validation layer that tests the consistency of supply-side and demand-side estimates.
Import Analysis
Import data is evaluated to determine volumes, source countries, product dependency, regional supply gaps, and pricing trends — identifying markets that rely heavily on external supply and where domestic production is insufficient to meet demand.
Export Analysis
Export assessments reveal production surplus, export competitiveness, regional manufacturing strength, and global market participation. Export patterns also help validate domestic production estimates and identify net exporting regions.
Apparent Consumption Model
Regional consumption is assessed using the standard apparent consumption formula:
Results identify net importing regions, net exporting regions, regional deficits, and surpluses — serving as an independent validation of supply and demand estimates.
Trade Flow Analysis — Net Supply Position by Region
Illustrative apparent consumption vs. domestic production across major regions — positive gap indicates net import dependency

Phase 5 — Primary Research: The Critical Validation Layer
Primary research tests and refines findings from secondary research through direct engagement with industry participants across the supply chain, demand side, and expert community. It captures intelligence that no database or published report can provide — the real-world experience of manufacturers, buyers, and specialists operating in the market.

Supply-Side Interviews
Conversations with chemical manufacturers, raw material suppliers, contract manufacturers, technology providers, and plant operators cover production trends, capacity utilization, pricing developments, technology shifts, and competitive dynamics.

Demand-Side Interviews
Engagement with OEMs, industrial consumers, procurement managers, distributors, formulators, and end-use manufacturers focuses on consumption trends, purchasing behavior, product substitution, demand outlook, and emerging applications.

Industry Expert Consultations
Additional interviews with industry consultants, independent experts, regulatory specialists, technical professionals, and research institutions provide deeper market context and validate key analytical assumptions.
Focus Areas of Primary Research:
Market Size & Forecast Validation
Revenue estimates, volume consumption, growth rates, forecast assumptions, regional demand.Supply Chain & Value Chain Assessment
Raw material sourcing, supply chain challenges, distribution networks, procurement practices.Production & Capacity Analysis
Manufacturing capacity, utilization rates, expansion projects, plant investments.Pricing & Cost Structure Analysis
Product pricing trends, feedstock costs, energy costs, margin pressures, pricing outlook.Competitive Landscape Assessment
Volume and value estimates confirmed to be fully consistent with one another before publicationInterview Volume by Market Scope
| Study Scope | Number of Interviews |
|---|---|
| Niche Market | 20 – 30 |
| Mid-Sized Market | 30 – 50 |
| Global Market | 50 – 80 |
| Highly Fragmented Market | 80 – 120 |
Interview Details:
Category : Manufacturers, Suppliers, Distributors, End Users, Experts/Associations
Average Duration : 30–60 Minutes
Interview Mode : Video calls, telephonic interviews, expert consultations
Interview Format : Structured / Semi-Structured questionnaire
Focus Areas of Primary Research:
Market Size & Forecast Validation :
Revenue estimates, volume consumption, growth rates, forecast assumptions, regional demand.
Supply Chain & Value Chain Assessment :
Raw material sourcing, supply chain challenges, distribution networks, procurement practices.
Production & Capacity Analysis :
Manufacturing capacity, utilization rates, expansion projects, plant investments.
Pricing & Cost Structure Analysis :
Product pricing trends, feedstock costs, energy costs, margin pressures, pricing outlook.
Competitive Landscape Assessment :
Market share, competitor positioning, strategic initiatives, partnerships, acquisitions.
Primary Research — Stakeholder Coverage by Category
Distribution of interview respondents across stakeholder categories (% share from PPT data)

Primary Research — Respondent Designation Profile
Seniority breakdown of interview respondents (% share from PPT data)

Primary Research — Geographic Coverage of Interviews
Regional distribution of primary research engagement (% share from PPT data)

Phase 6 — Data Triangulation and Market Validation
No single methodology is relied upon in isolation. Multiple independent estimation approaches are combined and reconciled to ensure consistency, accuracy, and analytical defensibility. Any material deviations between approaches are investigated and adjusted through additional validation cycles.
The final market size is derived through weighted triangulation of all validated methodologies. Any material deviations between approaches are investigated and adjusted through additional validation cycles. The outcome represents the most realistic assessment of the market based on available evidence and expert confirmation ensuring that volume and value estimates are fully consistent with one another.
Triangulation Framework — Input Contribution Weight
Relative weight each sizing input contributes to the final reconciled market estimate

Phase 7 — Forecast Modeling: Projecting Future Market Evolution
Forecasting evaluates the future trajectory of the market using a combination of quantitative indicators and qualitative assessments across economic, industry, and regulatory dimensions. Rather than simple extrapolation, each driver is independently modeled and integrated into a composite forecast.
Macroeconomic Indicators
GDP growth, industrial production, manufacturing output, construction activity, consumer spending, and capital investment form the quantitative foundation of long-term demand projections. These are applied at country, regional, and global levels.
Industry Growth Drivers
Urbanization, infrastructure development, industrialization, technological innovation, sustainability initiatives, and evolving product performance requirements are assessed at regional and industry levels — capturing both structural and cyclical demand drivers.
Capacity Expansion Analysis
Announced plant expansions, new manufacturing facilities, technology upgrades, and strategic investments are evaluated to determine future supply-demand dynamics and potential market tightness or oversupply situations.
Regulatory & Sustainability
Environmental regulations, chemical safety standards, emission reduction targets, circular economy initiatives, and sustainability requirements are incorporated as they often influence product adoption rates and market growth trajectories.
Scenario Forecast Range — Indexed Market Growth (Year 1–10)
Illustrative indexed growth trajectories across Base, Optimistic, and Pessimistic scenarios over a 10-year forecast horizon

Forecast Drivers — Relative Impact Score by Category
Impact score (0–100) of each driver type on chemicals & materials market forecast




Comments
Share your thoughts, ask a question, or provide feedback about this report.