Revenue, 2024
50.40 Bn
Forecast, 2034
76.05 Bn
CAGR, 2025 - 2034
4.20%
Report Coverage
Worldwide
Europe Foam Market - Size, Share & Industry Analysis
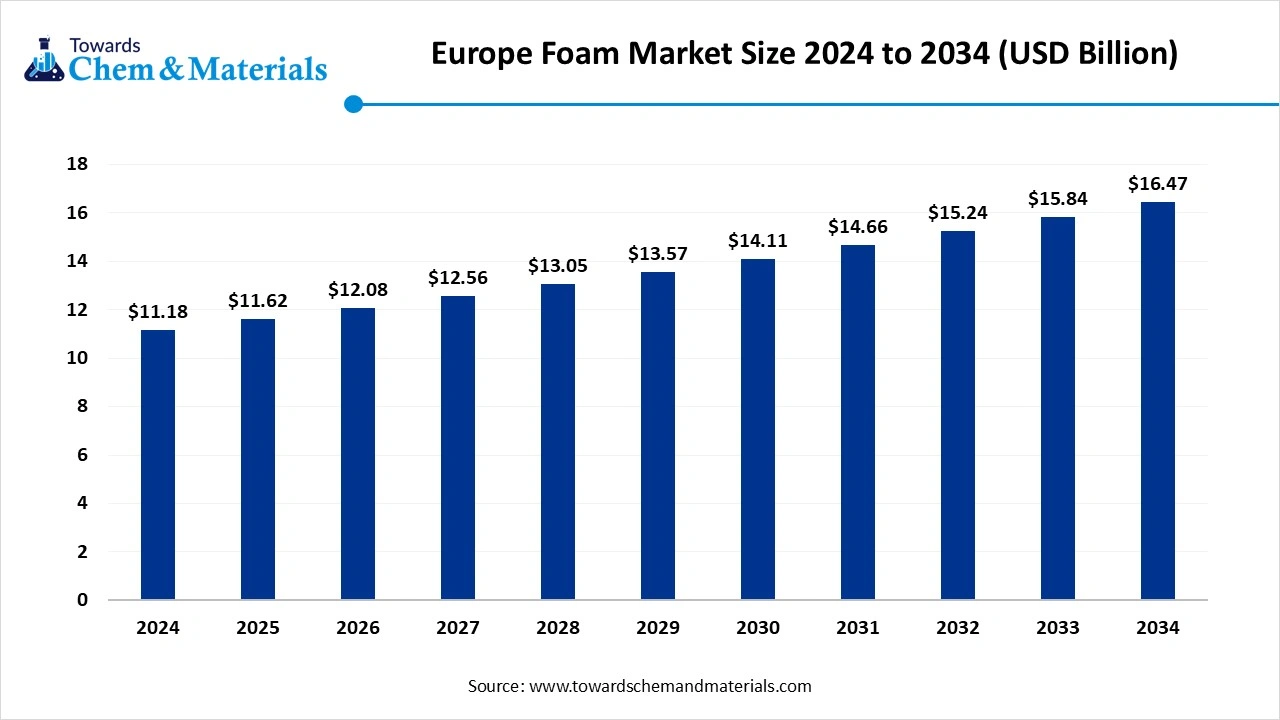
The Europe foam market size is calculated at USD 11.18 billion in 2024, grew to USD 11.62 billion in 2025, and is projected to reach around USD 16.47 billion by 2034. The market is expanding at a CAGR of 3.95% between 2025 and 2034. The growing demand for lightweight materials in the aerospace and automotive industries is the key factor driving market growth. Also, innovations in foam manufacturing and applications, coupled with the growing demand for energy-efficient solutions, can fuel market growth further.

Key Takeaways
- By type, the polyurethane foam segment dominated the market in 2024. The dominance of the segment can be attributed to the growing product demand from the automotive sector.
- By type, the others segment, especially PVC foam, is expected to grow at the fastest CAGR over the forecast period. The growth of the segment can be credited to the growing demand for durable, lightweight, and recyclable materials.
- By foam, the flexible form segment held the largest Europe foam market share in 2024. The dominance of the segment can be linked to the growing consumer spending and the trend towards high-performance, lightweight materials for fuel comfort and efficiency.
- By foam, the rigid foam segment is expected to grow at the fastest CAGR over the forecast period. The growth of the segment can be driven by a surge in renovation in the commercial and residential sectors.
- By application, the building & construction segment held the largest market share in 2024. The dominance of the segment is owed to the growing demand for energy-efficient and sustainable buildings.
- By application, the other segment, especially consumer goods, are expected to grow at the fastest CAGR during the projected period. The growth of the segment is due to growing consumer demand for durable and comfortable products.
- By end-use industry, the building & construction segment held the largest Europe foam market share in 2024. The dominance of the segment can be attributed to the growing need for energy-efficient building materials, boosted by green building initiatives.
- By end-use industry, the healthcare segment is expected to grow at the fastest CAGR during the forecast period. The growth of the segment can be credited to the rapid surge in the aging population.
Technological Advancements Are Expanding Market Growth
The Europe foam market refers to the industry focused on the production, distribution, and application of foam materials such as polyurethane, polystyrene, polyethylene, and specialty foams, which are widely utilized in construction, automotive, packaging, furniture, footwear, healthcare, and consumer goods industries.
Table & Figures
By Type
| Subsegment | 2024 | 2025 | 2026 | 2027 | 2028 | 2029 | 2030 | 2031 | 2032 | 2033 | 2034 |
|---|---|---|---|---|---|---|---|---|---|---|---|
| Molded Pulp Packaging | 28.22 | 29.10 | 29.99 | 30.90 | 31.85 | 32.81 | 33.80 | 34.82 | 35.85 | 36.93 | 38.02 |
| Starch-Based Packaging | 4.54 | 4.88 | 5.25 | 5.65 | 6.06 | 6.50 | 6.97 | 7.46 | 7.99 | 8.54 | 9.13 |
| PLA (Polylactic Acid) Packaging | 5.54 | 5.99 | 6.46 | 6.96 | 7.49 | 8.05 | 8.64 | 9.28 | 9.95 | 10.66 | 11.41 |
| Recycled Packaging | 12.10 | 12.55 | 13.02 | 13.51 | 14.02 | 14.55 | 15.10 | 15.66 | 16.25 | 16.86 | 17.49 |
| Total | 50.40 | 52.52 | 54.72 | 57.02 | 59.42 | 61.91 | 64.51 | 67.22 | 70.04 | 72.99 | 76.05 |
By Application
| Subsegment | 2024 | 2025 | 2026 | 2027 | 2028 | 2029 | 2030 | 2031 | 2032 | 2033 | 2034 |
|---|---|---|---|---|---|---|---|---|---|---|---|
| Retail | 31.25 | 32.35 | 33.49 | 34.67 | 35.89 | 37.15 | 38.45 | 39.79 | 41.18 | 42.63 | 44.11 |
| Distribution & Transportation | 19.15 | 20.17 | 21.23 | 22.35 | 23.53 | 24.76 | 26.06 | 27.43 | 28.86 | 30.36 | 31.94 |
| Total | 50.40 | 52.52 | 54.72 | 57.02 | 59.42 | 61.91 | 64.51 | 67.22 | 70.04 | 72.99 | 76.05 |
By Region
| Subsegment | 2024 | 2025 | 2026 | 2027 | 2028 | 2029 | 2030 | 2031 | 2032 | 2033 | 2034 |
|---|---|---|---|---|---|---|---|---|---|---|---|
| North America | 14.11 | 14.60 | 15.10 | 15.62 | 16.16 | 16.72 | 17.29 | 17.88 | 18.49 | 19.12 | 19.77 |
| Europe | 15.13 | 15.65 | 16.20 | 16.76 | 17.35 | 17.95 | 18.58 | 19.23 | 19.89 | 20.58 | 21.29 |
| Asia-Pacific | 15.12 | 15.92 | 16.75 | 17.63 | 18.55 | 19.51 | 20.51 | 21.58 | 22.70 | 23.87 | 25.11 |
| Latin America | 3.02 | 3.20 | 3.39 | 3.59 | 3.80 | 4.02 | 4.26 | 4.50 | 4.76 | 5.04 | 5.32 |
| Middle East & Africa | 3.02 | 3.15 | 3.28 | 3.42 | 3.56 | 3.71 | 3.87 | 4.03 | 4.20 | 4.38 | 4.56 |
| Total | 50.40 | 52.52 | 54.72 | 57.02 | 59.42 | 61.91 | 64.51 | 67.22 | 70.04 | 72.99 | 76.05 |
List of Figures & Tables
Frequently Asked Questions
Proceed To Buy
Proceed To CheckoutMake Every Move Strategic. Get Insights, Fully Customized
- On-Demand Metrics & KPIs
- Industry-Specific Dashboards
- Quick Turnaround, No Compromises
Quick Contact
- NA : +1 804 441 9344
- APAC : +91 9356 9282 04
- EU : +44 7782 560 738
- sales@towardschemandmaterials.com
Our Client

